JPYGBP trade ideas

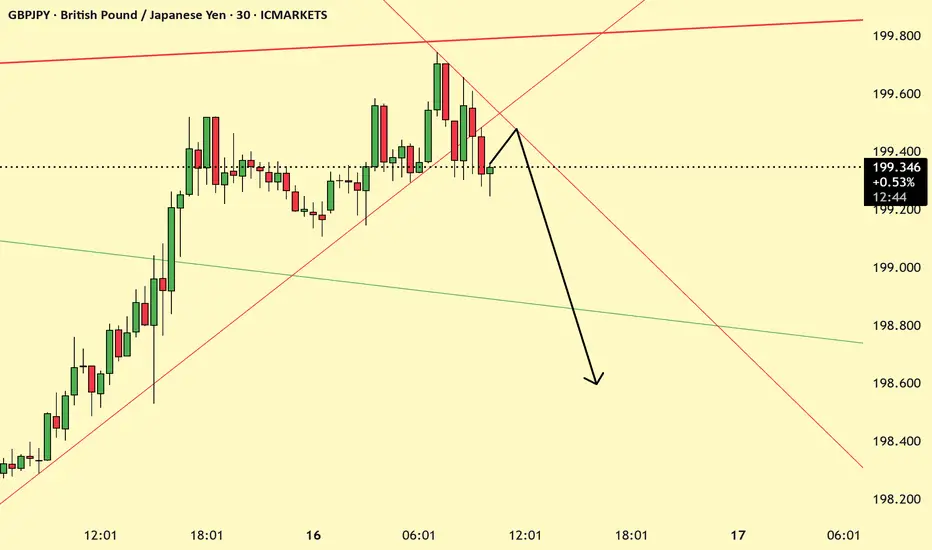
GBPJPY Broke trend line is likely to go downGBPJPY was trending up but recently has broken the trendline support and price is likely to go down after a retest.
GBPJPY SELLThe break of the support level on the H4 is complete. Looking at the retest of the broken support for the continuation of the fall

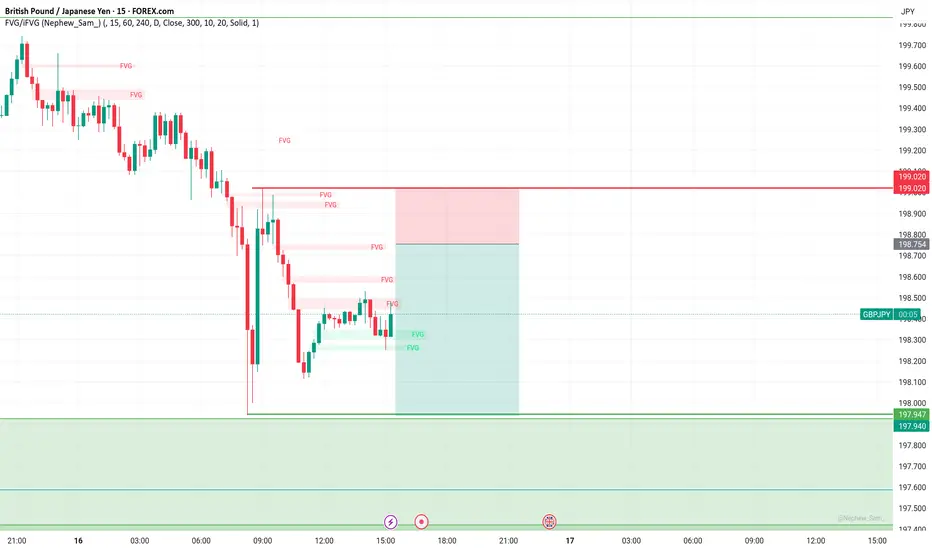
GBP/JPY Quick trade on the 15 minTrending down into a order block. Medium Risk as HTF are in the middle of the range just above the order block
GBPJPY SELLH&S pattern forming fibs also gives a clear sign of sell long tell with the market reversing.

GBPJPY in Premium Zones of 2008 Financial Crisis - {17/07/2025}Educational Analysis says that GBPJPY (FX pair) may give trend Trading opportunities from this range, according to my technical analysis.
Broker - FXCM
So, my analysis is based on a top-down approach from weekly to trend range to internal trend range.
So my analysis comprises of two structures: 1) Break of structure on weekly range and 2) Trading Range to fill the remaining fair value gap
Will Jpy start to lose value like it is doing since 2019 or it will do free fall same like 2008 crisis.
Let's see what this FX pair brings to the table for us in the future.
Please check the comment section to see how this turned out.
DISCLAIMER:-
This is not an entry signal. THIS IS FOR EDUCATIONAL PURPOSES ONLY.
I HAVE NO CONCERNS WITH YOUR PROFIT OR LOSS,
Happy Trading.

7.16 GBP/JPY LOSSSome days you go through things like this, when the markets make big moves it is great if you are on the right side and sucks if you are not. We have a limit to our exposure in the markets and ALWAYS follow our bankroll management plan. Price hit our stop on this one — no hesitation, no regrets. The setup met all the VMS criteria, but the market had other plans. This happens, and it’s built into the process. No revenge trades. No chasing. Just alignment and discipline. That’s how we grow.

GBP JPY shorti was watching people analyses that I've arrived at an analyze for gbp jpy , the analyze was telling about gbp jpy going up buy i didn't follow , went on my chart and get my idea. the challenge is kinda funny lets see it will go up or down ...

ger30 longLike I previously said, it's a very simple and repetitive approach to the markets
identifying the daily trend
identifying the 4h level
final: entering after entry patterns on the smaller time frame

7.16 GBP/JPY LIVE TRADE UPDATE DAY 4We are waiting for a break and close above the previous swing high to confirm the uptrend continuation.

GBPJPYSell. Market Execution. trade 1:2. risk 0.50%
Enter in Sell because Market retest Seller's Zone.

GBPJPY H4 I Bullish Bounce Off Based on the H4 chart analysis, we can see that the price is falling toward our buy entry at 198.65, a pullback support that aligns closely with the 61.8% Fib retracement.
Our take profit will be at 199.54, which is a swing high resistance level.
The stop loss will be placed at 197.98, which is a pullback support level.
High Risk Investment Warning
Trading Forex/CFDs on margin carries a high level of risk and may not be suitable for all investors. Leverage can work against you.
Stratos Markets Limited (tradu.com ):
CFDs are complex instruments and come with a high risk of losing money rapidly due to leverage. 66% of retail investor accounts lose money when trading CFDs with this provider. You should consider whether you understand how CFDs work and whether you can afford to take the high risk of losing your money.
Stratos Europe Ltd (tradu.com ):
CFDs are complex instruments and come with a high risk of losing money rapidly due to leverage. 66% of retail investor accounts lose money when trading CFDs with this provider. You should consider whether you understand how CFDs work and whether you can afford to take the high risk of losing your money.
Stratos Global LLC (tradu.com ):
Losses can exceed deposits.
Please be advised that the information presented on TradingView is provided to Tradu (‘Company’, ‘we’) by a third-party provider (‘TFA Global Pte Ltd’). Please be reminded that you are solely responsible for the trading decisions on your account. There is a very high degree of risk involved in trading. Any information and/or content is intended entirely for research, educational and informational purposes only and does not constitute investment or consultation advice or investment strategy. The information is not tailored to the investment needs of any specific person and therefore does not involve a consideration of any of the investment objectives, financial situation or needs of any viewer that may receive it. Kindly also note that past performance is not a reliable indicator of future results. Actual results may differ materially from those anticipated in forward-looking or past performance statements. We assume no liability as to the accuracy or completeness of any of the information and/or content provided herein and the Company cannot be held responsible for any omission, mistake nor for any loss or damage including without limitation to any loss of profit which may arise from reliance on any information supplied by TFA Global Pte Ltd.
The speaker(s) is neither an employee, agent nor representative of Tradu and is therefore acting independently. The opinions given are their own, constitute general market commentary, and do not constitute the opinion or advice of Tradu or any form of personal or investment advice. Tradu neither endorses nor guarantees offerings of third-party speakers, nor is Tradu responsible for the content, veracity or opinions of third-party speakers, presenters or participants.

British Pound / Japanese Yen (GBP/JPY) 4-Hour Chart Analysis4-hour performance of the British Pound against the Japanese Yen (GBP/JPY) via OANDA data. The current price is 199.352, reflecting a 0.129 (0.06%) increase. The chart highlights a recent upward trend, with key support levels around 198.107 and 198.994, and resistance near 200.415. A breakout above the recent high is indicated, suggesting potential for further gains.

GBPJPY long and shortOn this Pair we see a pattern within a pattern ... ascending within an ascending channel
first touch second touch which is the middle section waiting for the third touch to complete the structure to go to the downside.

correctionIt is expected that after some correction and fluctuation, the continuation of the upward trend will form and the resistance area will be broken.
If the price breaks through the support area, the continuation of the downward trend is likely.

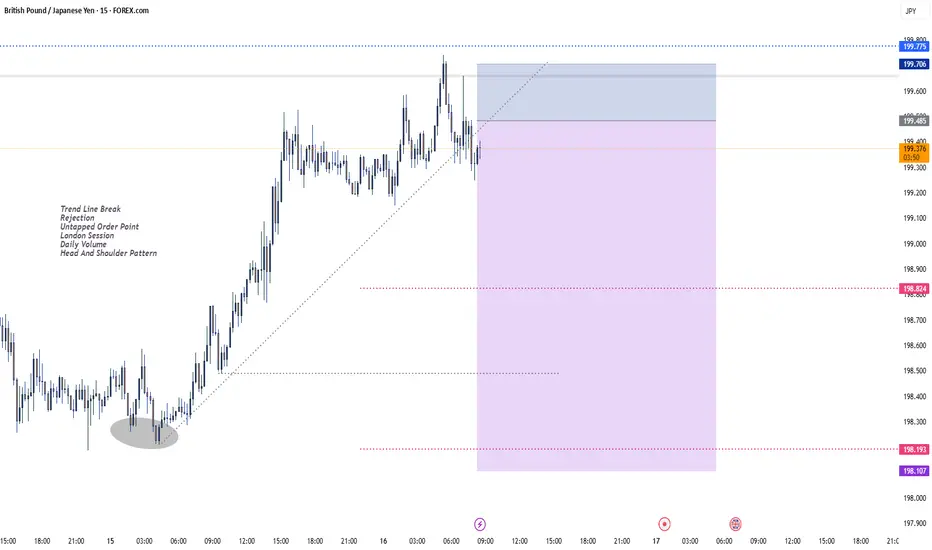
SellTrend Line Break
Rejection
Untapped Order Point
London Session
Daily Volume
Head And Shoulder Pattern
GBPJPY: Squeeze: sell ideaOn GBPJPY as you can see on the chart we would have a hight probability to have a downtrend because we have a squeeze.Thanks.


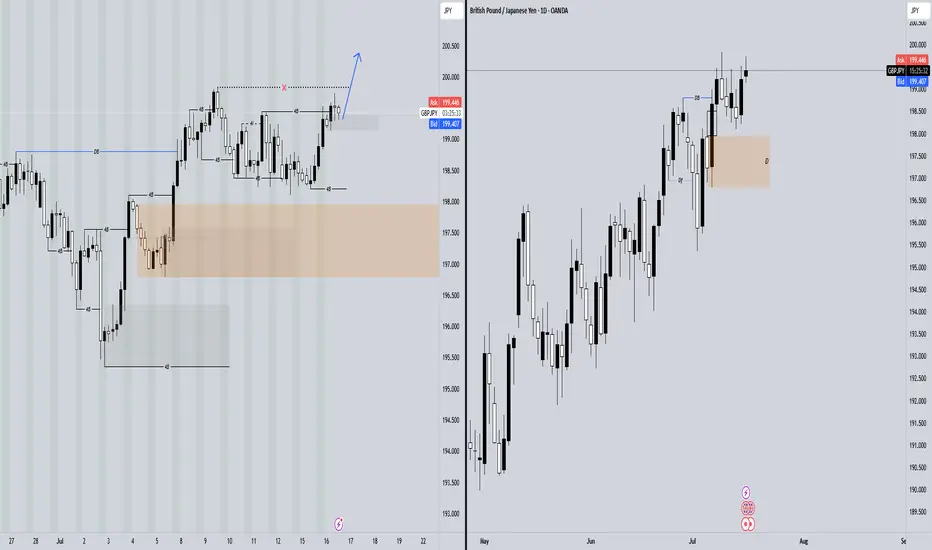
GJ Bullish Shift After Daily FVG MitigationHello Traders,
Hope everyone is having a fantastic week!
Today on GBPJPY, price has shifted the 4-hour swing structure to bullish following the mitigation of the daily Fair Value Gap (FVG)—a strong sign of a change in character (CHoCH). From this point, price may aim for the daily weak buy-side liquidity (BSL). Use your lower time frames (LTF) to identify bullish patterns that support this long trade setup.

GBPJPY RangingGBPJPY is still in the range. For this range we can trade between the zones drawn. It has taken previous day high already. There is S&R level and supply zone if gets buyer push and crosses previous week high we may expect further bullish momentum. Till now we can trade between zones if we see any bullish signs.

GBPJPY – Eyeing new highs as bullish structure holdsGBPJPY continues to trade within a steady ascending channel and has recently bounced from short-term support around 198.200. If price breaks above 199.400, bullish momentum could strengthen, targeting the previous high near 200.800 — a key resistance zone that has been rejected before.
From a fundamental perspective, expectations that the Bank of England will maintain high interest rates to combat inflation are supporting the pound. Meanwhile, investor sentiment remains cautious toward the yen following dovish signals from the Bank of Japan. If upcoming UK economic data is positive, GBPJPY may continue climbing in the sessions ahead.

buy jg from pivotgood RR buy from pivot
pre NY open
this is my trading strategy, trade on pivots point
