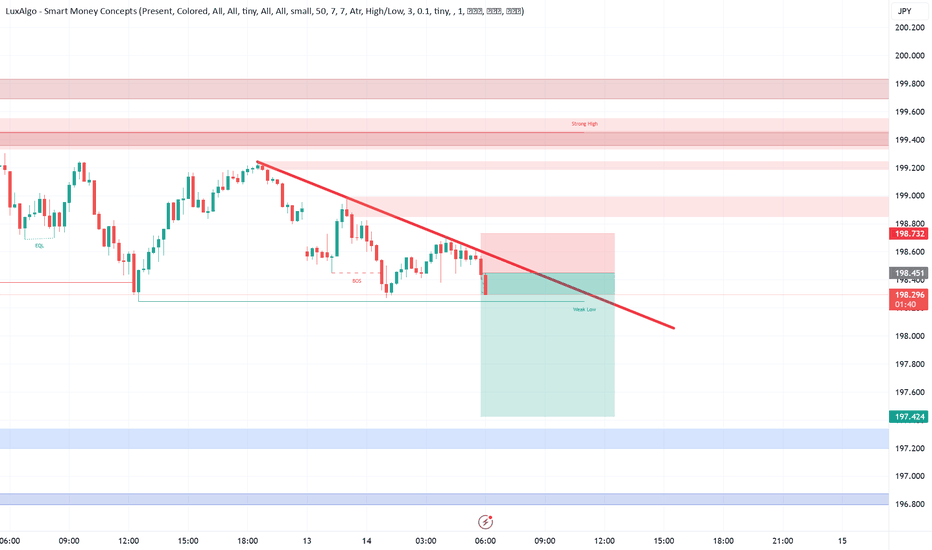
JPYGBP trade ideas
GBPJPY I Weekly CLS I Model 2 I H4 OB entry Hey, Market Warriors, here is another outlook on this instrument
If you’ve been following me, you already know every setup you see is built around a CLS Footprint, a Key Level, Liquidity and a specific execution model.
If you haven't followed me yet, start now.
My trading system is completely mechanical — designed to remove emotions, opinions, and impulsive decisions. No messy diagonal lines. No random drawings. Just clarity, structure, and execution.
🧩 What is CLS?
CLS is real smart money — the combined power of major investment banks and central banks moving over 6.5 trillion dollars a day. Understanding their operations is key to markets.
✅ Understanding the behavior of CLS allows you to position yourself with the giants during the market manipulations — leading to buying lows and selling highs - cleaner entries, clearer exits, and consistent profits.
📍 Model 1
is right after the manipulation of the CLS candle when CIOD occurs, and we are targeting 50% of the CLS range. H4 CLS ranges supported by HTF go straight to the opposing range.
"Adapt what is useful, reject what is useless, and add what is specifically your own."
— David Perk aka Dave FX Hunter ⚔️
👍 Hit like if you find this analysis helpful, and don't hesitate to comment with your opinions, charts or any questions.
GBPJPY Bearish sideways consolidation capped at 109.50The GBP/JPY currency pair continues to display a bearish outlook, in line with the prevailing downward trend. Recent price action suggests a corrective pullback, potentially setting up for another move lower if resistance holds.
Key Level: 196.50
This zone, previously a consolidation area, now acts as a significant resistance level.
Bearish Scenario (rejection at 196.50):
A failed test and rejection at 196.50 would likely resume the bearish momentum.
Downside targets include:
194.20 – Initial support
193.00 – Intermediate support
191.90 – Longer-term support level
Bullish Scenario (breakout above 196.50):
A confirmed breakout and daily close above 196.50 would invalidate the bearish setup.
In that case, potential upside resistance levels are:
197.50 – First resistance
198.30 – Further upside target
Conclusion
GBP/JPY remains under bearish pressure, with the 196.50 level acting as a key inflection point. As long as price remains below this level, the bias favors further downside toward the 194.20–191.90 region. However, a sustained break above 196.50 would shift sentiment bullish, targeting 197.50 and beyond. Traders should watch for price confirmation around 196.50 to assess the next move.
This communication is for informational purposes only and should not be viewed as any form of recommendation as to a particular course of action or as investment advice. It is not intended as an offer or solicitation for the purchase or sale of any financial instrument or as an official confirmation of any transaction. Opinions, estimates and assumptions expressed herein are made as of the date of this communication and are subject to change without notice. This communication has been prepared based upon information, including market prices, data and other information, believed to be reliable; however, Trade Nation does not warrant its completeness or accuracy. All market prices and market data contained in or attached to this communication are indicative and subject to change without notice.
GJ-Thu-19/06/25 TDA-Eyes on BoE interest rate decisionAnalysis done directly on the chart
Follow for more, possible live trades update!
Focus on your trading time. If you have missed
a move but it wasnt in your trading time
then you haven't missed anything.
Active in London session!
Not financial advice, DYOR.
Market Flow Strategy
Mister Y
GBPJPYGBPJPY
New trade setup, strong bullish momentum price action has currently moved above the 195.00 handle price action has already created a liquidity sweep at key levels H4 timeframe is in an uptrend, H4 is clearly making higher highs and higher lows. If price action breaks above 195.30 I will look for a retest at that level to go long if price fails at 195.30 I will look for a retest around 194.80 as a possible long entry.
Liquidity, Herd Behavior, and the Importance of Market BalanceLiquidity can be one of the most frustrating aspects of trading. It often feels as though price is magnetically drawn to your stop loss the moment you place it. While this may seem intentional, it actually stems from a powerful psychological and structural force in the market: herd behavior .
No matter how unique your trading system may feel, chances are you're not the only one using it—or at least not the only one identifying the same key levels. Traders around the world are often taught similar risk management techniques, such as placing stop losses just beyond recent highs or lows. As a result, we unintentionally create liquidity pools —concentrated zones of clustered orders. This is the direct result of herd behavior : large groups of traders making similar decisions at the same levels.
As covered in our earlier publication, Redefining Trading Psychology , when stop losses or take-profit levels are hit, traders are forcibly exited from the market. If many traders are exiting simultaneously from the same level, it injects a burst of liquidity into the market. Market participants with large orders—like institutions or professional traders—rely on this liquidity to enter or exit positions without causing major slippage. Once these liquidity pockets are consumed, the market often stalls and enters consolidation .
These consolidation zones are more than just sideways price action; they are areas of equilibrium , where buying and selling pressure are balanced. No side dominates, and price fluctuates within a tight range. But equilibrium is temporary.
As momentum builds—either bullish or bearish—an imbalance emerges. This is typically driven by an excess of buyers or sellers overpowering the market. But momentum doesn’t last forever. Eventually, it fades, and the price reverts to a more balanced level—often retracing to a previous consolidation zone. These zones act as gravitational points that attract price back to them, offering traders a reliable reference for potential reversals or continuations.
Many traders get stopped out prematurely because they enter during imbalanced phases of the market—often as a result of following the herd. This creates unstable setups that are more likely to fail. The key to improving trade accuracy is to avoid reactive, herd-driven entries and instead focus on entering when the market has returned to a state of balance . Entering at the right moment—when the market is in balance—gives your trades a greater potential to move into profit quickly. This not only improves the quality of your entries but also increases the likelihood of success over time.
To support this approach, I’ve developed tools that help identify market balance and momentum shifts in real-time. Visit my TradingView profile, The_Forex_Steward , to access these indicators and gain deeper insights into timing entries with greater precision—away from the noise of the herd.
GBPJPY LONG & SHORT FORECAST Q2 W25 D19 Y25GBPJPY LONG & SHORT FORECAST Q2 W25 D19 Y25
Professional Risk Managers👋
Welcome back to another FRGNT chart update📈
Diving into some Forex setups using predominantly higher time frame order blocks alongside confirmation breaks of structure.
Let’s see what price action is telling us today!
💡Here are some trade confluences📝
✅Daily order block
✅15' order block
✅Intraday breaks of structure
✅4H Order block
🔑 Remember, to participate in trading comes always with a degree of risk, therefore as professional risk managers it remains vital that we stick to our risk management plan as well as our trading strategies.
📈The rest, we leave to the balance of probabilities.
💡Fail to plan. Plan to fail.
🏆It has always been that simple.
❤️Good luck with your trading journey, I shall see you at the very top.
🎯Trade consistent, FRGNT X
GBPJPY: Pullback From Trend Line 🇬🇧🇯🇵
I think that GBPJPY may bounce from a rising trend line
that I spotted on a daily time frame.
As a confirmation, I spotted 2 intraday bullish breakouts:
a violation of a resistance line of a falling channel
and a breakout of a neckline of a cup & handle pattern.
Goal - 195.0
❤️Please, support my work with like, thank you!❤️
I am part of Trade Nation's Influencer program and receive a monthly fee for using their TradingView charts in my analysis.
GBPJPY Selling strong from bearish order block📉 GBPJPY Technical Outlook – 4H Chart
GBPJPY has been respecting the ascending channel, but we’re now seeing selling pressure emerging from a bearish order block near 196.100.
🔻 Short-Term Bearish Bias
Key Technical Targets:
🔸 1st Target: 194.200
🔸 2nd Target: 192.300
📌 Potential Reversal Zone:
Bullish order block spotted around 190.200, watch for possible reaction there.
Stay sharp, trade safe!
💬 Like, Follow, and Comment your thoughts –
🔔 Join us for more timely updates and setups!
— Livia 😜
GBPJPY Bullish Setup: Reversal Brewing a Key Zone📈 **GBPJPY Bullish Setup: Reversal Brewing at Key Zone** 🔍
**Pair:** GBPJPY
**Timeframe:** 15m / 1H Confluence
**Bias:** Bullish (waiting for confirmation)
⚡️ **Key Technical Highlights:**
🔹 **1H Demand Zone** – Price is sitting inside a strong historical reversal area around **194.00–194.20**, where we've seen multiple prior bounces.
🔹 **Trendline Support** – Tapping a clean ascending 1H trendline that has held multiple times.
🔹 **Bullish Divergence (15m RSI)** – Momentum is shifting: while price made a lower low, RSI formed a higher low — classic divergence signaling potential reversal.
🔹 **Descending Channel Forming a Wedge** – Price action is coiling inside a falling wedge. Watching closely for a **bullish breakout** above channel resistance.
🔹 **Wick Rejections / Seller Exhaustion** – Repeated long wicks into the zone indicate sellers are losing steam.
🧠 **Bullish Setup Idea:**
✅ **Trigger:**
Look for a break above **194.80** (channel resistance + 0.0 fib)
Then a **higher low retest entry** near **194.40–194.50**
🎯 **Targets:**
* **TP1:** 195.28 – 195.50 (38.2%–50% fib + intraday resistance)
* **TP2:** 196.00 – 196.42 (78.6%–88.6% fib zone)
* **TP3:** 196.86 – 197.00 (full retracement + supply zone)
🛑 **Invalidation:**
* Break below **193.50 – 193.20** with bearish momentum
* RSI falling below 30 with strong bearish close
💬 Let me know if you're watching this level too — would love to hear your take!
\#GBPJPY #Forex #FXTrading #PriceAction #Divergence #BullishSetup #SmartMoney #SupplyAndDemand #TradingViewIdeas
GBP/JPY Testing Trendline SupportGBP/JPY is currently testing an ascending trendline around the 194.30 – 193.95 area. Price action suggests potential for a bullish bounce if the support holds.
Upside targets include 194.850 and 195.304, provided that the structure remains intact.
However, a confirmed break below 193.955 would invalidate the bullish scenario and potentially trigger further downside.
🔹 Support: 193.955
🔹 Resistance 1: 194.850
🔹 Resistance 2: 195.304
🔹 Structure: Trendline bounce
🔹 Timeframe: 1H
🔹 Bias: Bullish as long as 193.95 holds
This is a technical idea only – not financial advice.
GBP/JPY H1 | Rising into an overlap resistanceGBP/JPY is rising towards an overlap resistance and could potentially reverse off this level to drop lower.
Sell entry is at 194.86 which is an overlap resistance.
Stop loss is at 195.43 which is a level that sits above the 38.2% Fibonacci retracement and a multi-swing-high resistance.
Take profit is at 193.95 which is a swing-low support.
High Risk Investment Warning
Trading Forex/CFDs on margin carries a high level of risk and may not be suitable for all investors. Leverage can work against you.
Stratos Markets Limited (tradu.com ):
CFDs are complex instruments and come with a high risk of losing money rapidly due to leverage. 63% of retail investor accounts lose money when trading CFDs with this provider. You should consider whether you understand how CFDs work and whether you can afford to take the high risk of losing your money.
Stratos Europe Ltd (tradu.com ):
CFDs are complex instruments and come with a high risk of losing money rapidly due to leverage. 63% of retail investor accounts lose money when trading CFDs with this provider. You should consider whether you understand how CFDs work and whether you can afford to take the high risk of losing your money.
Stratos Global LLC (tradu.com ):
Losses can exceed deposits.
Please be advised that the information presented on TradingView is provided to Tradu (‘Company’, ‘we’) by a third-party provider (‘TFA Global Pte Ltd’). Please be reminded that you are solely responsible for the trading decisions on your account. There is a very high degree of risk involved in trading. Any information and/or content is intended entirely for research, educational and informational purposes only and does not constitute investment or consultation advice or investment strategy. The information is not tailored to the investment needs of any specific person and therefore does not involve a consideration of any of the investment objectives, financial situation or needs of any viewer that may receive it. Kindly also note that past performance is not a reliable indicator of future results. Actual results may differ materially from those anticipated in forward-looking or past performance statements. We assume no liability as to the accuracy or completeness of any of the information and/or content provided herein and the Company cannot be held responsible for any omission, mistake nor for any loss or damage including without limitation to any loss of profit which may arise from reliance on any information supplied by TFA Global Pte Ltd.
The speaker(s) is neither an employee, agent nor representative of Tradu and is therefore acting independently. The opinions given are their own, constitute general market commentary, and do not constitute the opinion or advice of Tradu or any form of personal or investment advice. Tradu neither endorses nor guarantees offerings of third-party speakers, nor is Tradu responsible for the content, veracity or opinions of third-party speakers, presenters or participants.
GBPJPY BUY OR SELL IDEABased on HTF (Daily), the price is currently in an uptrend and approaching a previously broken weekly resistance level, which has now turned to support.
If the bullish trendline and support level are respected, a bullish candlestick signal would be a signal for a bullish move, while a break below the support level would be an indication of a fall to the next support area.
GJ June 18 UpdateWhile there's no confirmation yet for a reversal, I do see a **selling option**. However, a **buying option** is also present if the price first touches support. Ultimately, the price will reach my **target around 190.70** and continue beyond. The support zone for this will, of course, need to be broken.
GBP/JPY Technical Analysis – Targeting 198.80 on Trendline BreakGBP/JPY is currently trading around 194.75, with bullish momentum building after a clean trendline breakout and seems to be testing its support around 194.5 area with a clear market structure. The pair shows signs of institutional accumulation and a potential continuation toward the 198.80 target.
A downward sloping trendline, which capped price since late October 2024, has been decisively broken, indicating a change in sentiment.
Price formed a higher low around 193.62, which now serves as a protected low (your stop loss), supporting the idea of a bullish BOS (Break of Structure).
With momentum aligning and clean imbalance zones above, GBP/JPY could extend toward 198.80 and even further, which aligns with previous supply and fair value gap zones.
As long as price holds above 193.62, the bullish structure remains intact, with further upside likely as liquidity targets above 196.50 and 198.80 come into play.
GBPJPY: Long Trade Explained
GBPJPY
- Classic bullish setup
- Our team expects bullish continuation
SUGGESTED TRADE:
Swing Trade
Long GBPJPY
Entry Point - 194.85
Stop Loss - 194.39
Take Profit - 195.71
Our Risk - 1%
Start protection of your profits from lower levels
Disclosure: I am part of Trade Nation's Influencer program and receive a monthly fee for using their TradingView charts in my analysis.
❤️ Please, support our work with like & comment! ❤️
GBPJPY Will Fall! Short!
Here is our detailed technical review for GBPJPY.
Time Frame: 9h
Current Trend: Bearish
Sentiment: Overbought (based on 7-period RSI)
Forecast: Bearish
The market is trading around a solid horizontal structure 194.806.
The above observations make me that the market will inevitably achieve 193.727 level.
P.S
We determine oversold/overbought condition with RSI indicator.
When it drops below 30 - the market is considered to be oversold.
When it bounces above 70 - the market is considered to be overbought.
Disclosure: I am part of Trade Nation's Influencer program and receive a monthly fee for using their TradingView charts in my analysis.
Like and subscribe and comment my ideas if you enjoy them!