GBPJPY TRADE IDEA We are looking at a potential trade to the upside on GBPJPY.
Like always, we await a pullback to our Fibonacci level for a continuation trade.
Let's see how the market plays out.
JPYGBP trade ideas

GBP/JPY – Channel Break and Bearish Rejection
🔹 3H Chart by PULSETRADESFX
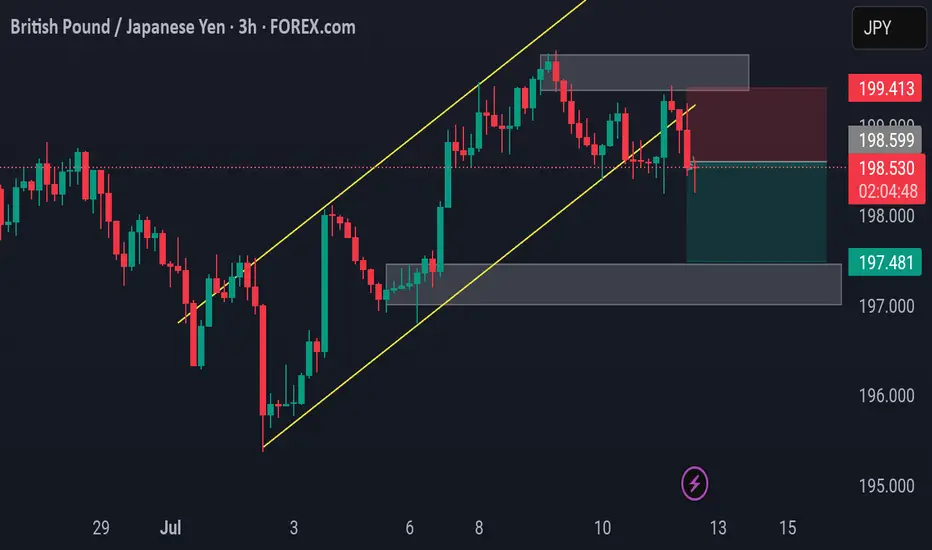
After a strong bullish trend within a rising channel, GBP/JPY has now broken structure to the downside. Price rejected the resistance zone around 198.599 – 199.413, followed by a sharp bearish candle close beneath the ascending trendline support.
This signals a shift in market sentiment, with sellers taking control and aiming for the next demand level at 197.481.
📌 Trade Breakdown:
Entry: 198.536
Stop Loss: 199.413 (Above supply)
Target: 197.481 (Major demand zone)
A classic break-retest-drop setup is in play here. Unless price reclaims 199.00+ with volume, this short bias remains valid.
---
✅ Key Confluences:
Rising channel break
Supply zone rejection
Bearish momentum confirmation
Risk-to-reward > 1:2 setup
📅 July 11, 2025
📊 Forex.com Feed via TradingView
#GBPJPY #ForexAnalysis #PriceAction #BearishSetup #SupplyZone #TechnicalAnalysis #TradingView #PULSETRADESFX
GBPJPY Forecast (4H Chart) SELL!Price rejected the 199.2 resistance and is now retesting the supply zone (~198.6). Lower highs forming, signaling potential downside continuation.
🔮 Forecast: Bearish
📍 Signal: Sell below 198.600
🎯 TP: 194.900
⛔ SL: 200.050

GBPUSD SELLFind a nice entry
Place trade based
Ensure risk management based on available funds
This is a 1:12 trade

GBPJPY Sweet ProfitsThe Key Levels that I shared previously for GBPJPY are drawn carefully by observing the market behavior previously. I suggest look at that key levels and plan your trades accordingly. I took the trade on the key levels I drawn. It gave me 1:2.85 . These key levels represent the behavior of the market.

BuyTrend Line Break
Previous High Break
Order Point
London Session
Previous Week High Break
Head And Shoulder Pattern

GBPJPY – Correction Pressure Is Building UpGBPJPY is still trading within a well-defined ascending channel on the H4 chart. However, recent signals suggest a potential short-term correction. The price has repeatedly rejected the upper boundary of the channel and is now forming a distribution pattern with lower highs. The FVG zone near 200.400 may act as a short-term take-profit area before price pulls back toward the support zone around 198.400, which also aligns with the lower trendline.
Additionally, the upcoming UK GDP data this week could strongly impact GBP. If the data comes in weaker than expected, downside pressure may intensify and reinforce the developing correction scenario. Traders should monitor price action around 198.400 for confirmation of the pullback.

GBPJPY is still in pullbackGJ possibilities has been drawn on chart. GJ is in pullback still. It had developed liquidity around S&R Level and has taken. GJ may touch PD high today because it has already taken PD low. It may go towards the demand zone residing below PD low.

GBPJPY is in the Down Trend From Resistance LevelHello Traders
In This Chart GBPJPY HOURLY Forex Forecast By FOREX PLANET
today GBPJPY analysis 👆
🟢This Chart includes_ (GBPJPY market update)
🟢What is The Next Opportunity on GBPJPY Market
🟢how to Enter to the Valid Entry With Assurance Profit
This CHART is For Trader's that Want to Improve Their Technical Analysis Skills and Their Trading By Understanding How To Analyze The Market Using Multiple Timeframes and Understanding The Bigger Picture on the Charts

GBPJPY is Holding above the SupportHello Traders
In This Chart GBPJPY HOURLY Forex Forecast By FOREX PLANET
today GBPJPY analysis 👆
🟢This Chart includes_ (GBPJPY market update)
🟢What is The Next Opportunity on GBPJPY Market
🟢how to Enter to the Valid Entry With Assurance Profit
This CHART is For Trader's that Want to Improve Their Technical Analysis Skills and Their Trading By Understanding How To Analyze The Market Using Multiple Timeframes and Understanding The Bigger Picture on the Charts

GBPJPY - Multi Year SHORTS Coming! (Over 10,000pips)Here we have the 2 month chart of GBPJPY. We can see that we're in a massive ending diagonal made up of 5 waves.
We are currently on wave 4 and have almost completed. At the moment we are working within the parameters of a channel however we must be aware that we may exceed the channel. The channel is just there for us to use as a guideline.
In 2007, we have a really nice ending diagonal (expanding) before we made that ridiculous +13k pip drop.
See below for the 2D GBPJPY chart from 2007:
We can see that the lower timeframe diagonal broke down beautifully.
We are anticipating something similar this time round!
See below for the 2D GBPJPY chart of the current diagonal:
We've got an almost identical price action as 2007. We just got to wait a little and watch for the break of the red trendline and enter and hold.
See below for the 2week chart of GBPJPY:
Trade Idea:
- Watch for a break of the ending diagonal
- Alternatively, you can wait for a pullback after the ending diagonal breaks
- stop loss above highs once entry trendline breaks
- Swing Target: 100 (10,000pips)
What do you guys think?
Goodluck and as always, trade safe!

GBPJPY - Multi-Year Short Update! In our last setup for GBPJPY, we identified a massive diagonal pattern, with price completing wave 4 and preparing for a multi-year drop into wave 5.
Since then, price has played out exactly as forecasted — we've seen a clean impulse lower for wave 1, followed by an ABC correction for wave 2, which looks to have now completed.
This sets the stage for the next major leg — wave 3 of 5 — which historically carries the most power and momentum.
📉 See monthly chart here:
📊 GBP/JPY Wave‑3 Trade Idea
Background:
We’ve completed wave 1 down and wave 2 up (ABC correction).
GBPJPY is now positioned to start a powerful wave 3 down — the most impulsive leg in an Elliott sequence.
🔍 Current Price Action:
Price is rejecting major resistance (previous wave A high + shaded zone)
Structure shows a completed 5-wave move up within C, suggesting exhaustion.
A clean ascending trendline (red) has formed under wave v — a break here signals the first confirmation.
Option 1 – Aggressive Entry:
- Trigger: Break and close below the red trendline (~198.00–197.80 zone) on the daily.
- Entry: On candle close below trendline
- Stop Loss: Above recent high ~199.80 and then breakeven once we move lower
Option 2 – Conservative Entry (preferred):
- Trigger: Trendline break + correction
- Entry: On bearish confirmation and then a correction to indicate further downside
- Stop Loss: Above recent high ~199.80 and then breakeven once we move lower
Take Profit Levels:
- TP1: 192
- TP2: 180
- TP3: 175
- Final Target: Trail for extended move toward wave (3) lows (could be 10,000+ pips over long term)
🔐 Invalidation:
Daily close back above 200.00 or impulsive rally beyond the pink resistance zone invalidates the short bias in the short term.
✅ Summary:
This is a high-conviction, structure-backed setup with:
- Wave count + Fib confluence
- Bearish structure at key resistance
- Confirmation-based trigger (trendline break + retest)
- Excellent long-term risk-to-reward profile
📂 Previous GBPJPY Setups (Track Record):
📌 Free Setup (Big Picture Outlook) – Multi-Year Shorts Incoming (Wave 4 Completion)
✅ Swing 1 – 1,200 Pips (VIP GBPJPY Long)
✅ Swing 2 – 1,000 Pips (VIP GBPJPY Short)
✅ Swing 3 – 1,100 Pips (VIP GBPJPY Short)
✅ Swing 4 – 700 Pips (VIP GBPJPY Short)

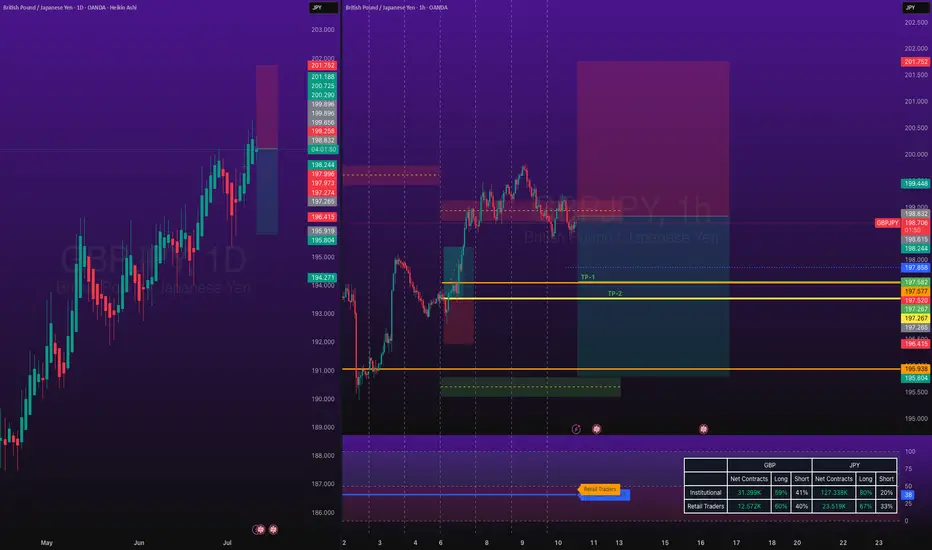
GBPJPY Short Trade - COT TradeOANDA:GBPJPY Short trade using COT Data - institutional bias, with my back testing of this strategy, it hits multiple possible take profits, manage your position accordingly.
This is good trade, don't overload your risk like greedy, be disciplined trader, this is good trade.
Use proper risk management
Looks like good trade.
Lets monitor.
Use proper risk management.
Disclaimer: only idea, not advice
GJ bearslooking for a break of this new support and closure below before entering. daily candle is bearish, and the 4 hr resistance above has been respected.
you can monitor entries on the 30min, again just looking for a candle to close bearish below the zone before entering.

GBP/JPY At Selling Area , Can We Sell It Now To Get 150 Pips ?Here is my opinion on GBP/JPY , The price at daily res area that forced the price to go down very hard last time and now the price retesting it , i want to see a good bearish price action on 4H T.F To get A Confirmation to can sell and i feel safe , we can enter now a sell trade with small lot size and when we have a good confirmation on bigger T.F We can add another entry , if we have a daily closure above my daily res then this idea will not be valid .

SellPrevious Day Low
Trend Line Break
Divergence Volume
London Session
Previous Week High Breach
Market Structure Shift Bearish

GBPJPY uptrend support at 196.75Key Support: 196.75
This level marks the prior consolidation zone and serves as a critical pivot. A corrective pullback toward 196.75 followed by a bullish reversal would validate the uptrend, with upside targets at:
199.20 – Initial resistance and short-term target
199.70 – Minor resistance zone
200.40 – Longer-term breakout objective
However, a daily close below 196.75 would invalidate the bullish scenario, potentially triggering a deeper retracement toward:
195.80 – Near-term support
194.80 – Key downside level in a bearish reversal
Conclusion:
As long as 196.75 holds, the bias remains bullish, favoring continuation toward the 199–200 zone. A confirmed break below this support would shift momentum, opening the door for a broader corrective decline.
This communication is for informational purposes only and should not be viewed as any form of recommendation as to a particular course of action or as investment advice. It is not intended as an offer or solicitation for the purchase or sale of any financial instrument or as an official confirmation of any transaction. Opinions, estimates and assumptions expressed herein are made as of the date of this communication and are subject to change without notice. This communication has been prepared based upon information, including market prices, data and other information, believed to be reliable; however, Trade Nation does not warrant its completeness or accuracy. All market prices and market data contained in or attached to this communication are indicative and subject to change without notice.

GBP/JPY BULLISH BIAS RIGHT NOW| LONG
Hello, Friends!
It makes sense for us to go long on GBP/JPY right now from the support line below with the target of 198.556 because of the confluence of the two strong factors which are the general uptrend on the previous 1W candle and the oversold situation on the lower TF determined by it’s proximity to the lower BB band.
Disclosure: I am part of Trade Nation's Influencer program and receive a monthly fee for using their TradingView charts in my analysis.
✅LIKE AND COMMENT MY IDEAS✅

GBPJPY Will Go Lower From Resistance! Sell!
Here is our detailed technical review for GBPJPY.
Time Frame: 12h
Current Trend: Bearish
Sentiment: Overbought (based on 7-period RSI)
Forecast: Bearish
The market is trading around a solid horizontal structure 199.046.
The above observations make me that the market will inevitably achieve 196.674 level.
P.S
Overbought describes a period of time where there has been a significant and consistent upward move in price over a period of time without much pullback.
Disclosure: I am part of Trade Nation's Influencer program and receive a monthly fee for using their TradingView charts in my analysis.
Like and subscribe and comment my ideas if you enjoy them!

BUYPrevious Day Low
Trend Line Rejection
Divergence Volume
London Session
Previous Week High Breach
Market Structure Shift Bullish

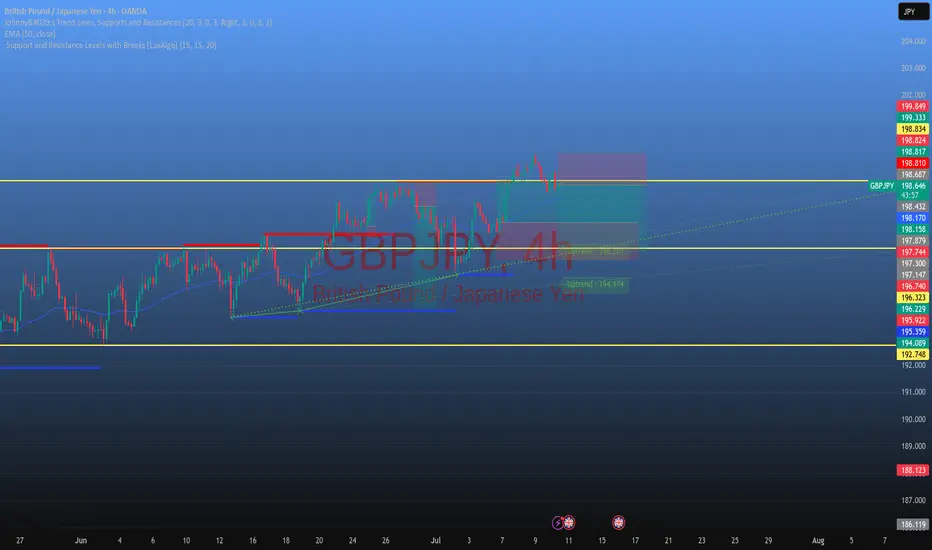
Lingrid | GBPJPY possible Pullback From Psychological LevelThe price perfectly fulfilled my last idea . FX:GBPJPY is testing the upper boundary of the resistance zone near the psychological 200.000 mark after a strong bullish impulse. Price is showing early signs of rejection from the red trendline and horizontal resistance, suggesting potential for a corrective move. If confirmed, a drop toward the 197.600–197.000 region becomes likely, aligning with the lower bound of the rising channel. A break below this level could expose deeper downside toward the 195.5 support.
📉 Key Levels
Sell trigger: confirmed rejection from 200.000 with bearish engulfing
Sell zone: 200.50–200.00 (key resistance zone and trendline touch)
Target: 197.600
Invalidation: sustained close above 200.500 flips structure bullish
💡 Risks
Strong bullish continuation above 200.000 would invalidate short setup
Yen weakness from BOJ policy shifts could drive GBPJPY higher
Support at 197.600 may cause bounce and false breakout scenarios
If this idea resonates with you or you have your own opinion, traders, hit the comments. I’m excited to read your thoughts!

GBPJPY: Bullish Move From SupportGBPJPY may continue rising from the highlighted blue horizontal support level.
A brief liquidity spike below that, followed by a bullish imbalance candle on the 4-hour chart, supports this.
I anticipate a rise to 199.94.
