GBP/JPY - Channel BreakoutThe GBP/JPY pair on the M30 timeframe presents a Potential Selling Opportunity due to a recent Formation of a Breakout Pattern. This suggests a shift in momentum towards the downside and a higher likelihood of further advances in the coming hours.
Possible Short Trade:
Entry: Consider Entering A Short Position around Trendline Of The Pattern.
Entry: 197.347
Stop Loss: 197.662
Take Profit: 196.332
JPYGBP trade ideas

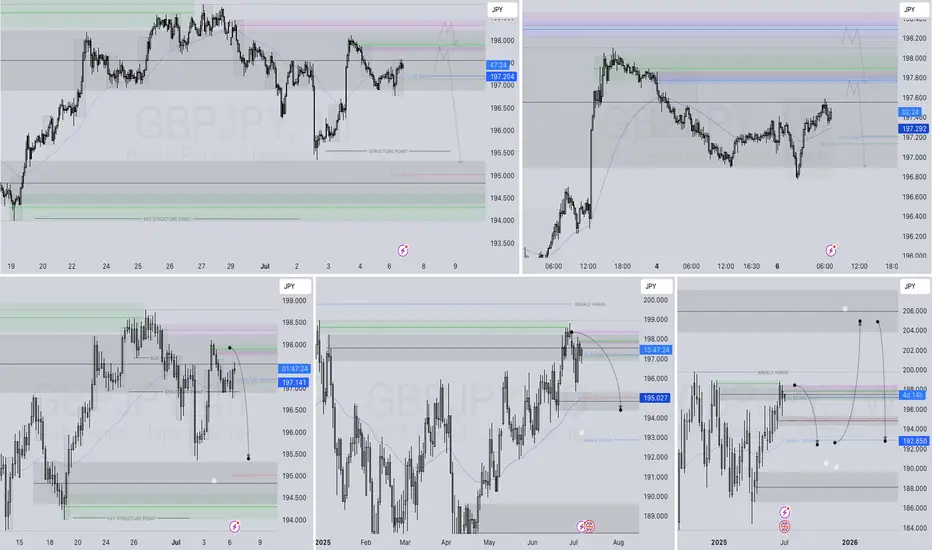
Uptrend Resumes After BOS – Ready to Load LongsI am expecting price to continue higher after mitigation of this fractal 4hr demand zone. In 4hr Price has shifted the swing structure to bullish with strong momentum and now price has formed a another bullish continuation structure within the bullish leg imbalance zone. This is the very clean winning trade setup and has the higher probability. The closest target is the 4hr swing weak HH.

Possibility of uptrend It is expected that a trend change will take place within the green support area and we will witness the start of an upward trend. Otherwise, the correction trend will continue to the next support levels.

BUY GBPJPYWhile everyone sells, the chart prints signs of bullish movement. Buy this double bottom from 197,2 and take profit it 198. 80 pips trade

Market ViewWatch
Trade
Manage
Smile
@New-day, breath and appreciate the life taking the right call of decision backed with action. You got the control, take charge.

GBPJPY SHORT DAILY FORECAST Q3 D7 W28 Y25GBPJPY SHORT DAILY FORECAST Q3 D7 W28 Y25
Professional Risk Managers👋
Welcome back to another FRGNT chart update📈
Diving into some Forex setups using predominantly higher time frame order blocks alongside confirmation breaks of structure.
Let’s see what price action is telling us today! 👀
💡Here are some trade confluences📝
✅Daily Order block identified
✅4H Order Block identified
✅1H Order Block identified
🔑 Remember, to participate in trading comes always with a degree of risk, therefore as professional risk managers it remains vital that we stick to our risk management plan as well as our trading strategies.
📈The rest, we leave to the balance of probabilities.
💡Fail to plan. Plan to fail.
🏆It has always been that simple.
❤️Good luck with your trading journey, I shall see you at the very top.
🎯Trade consistent, FRGNT X
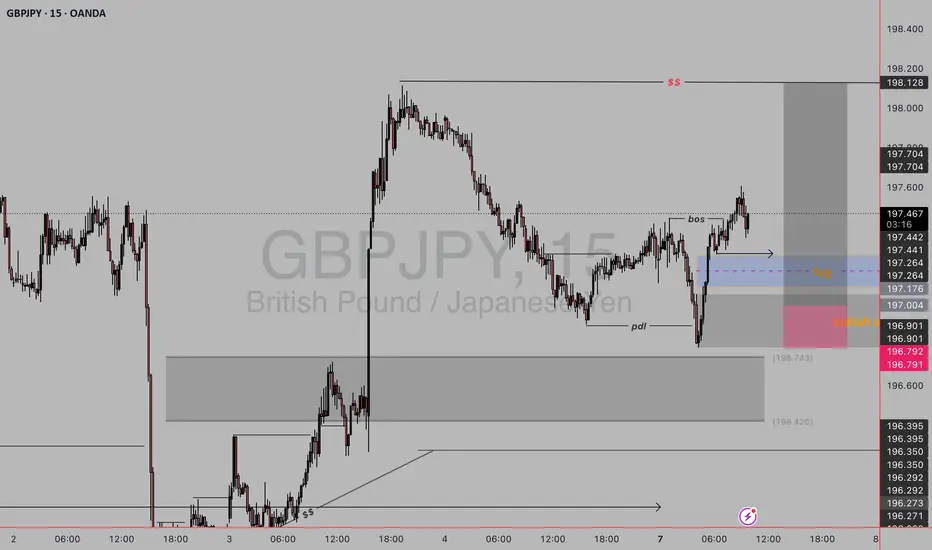
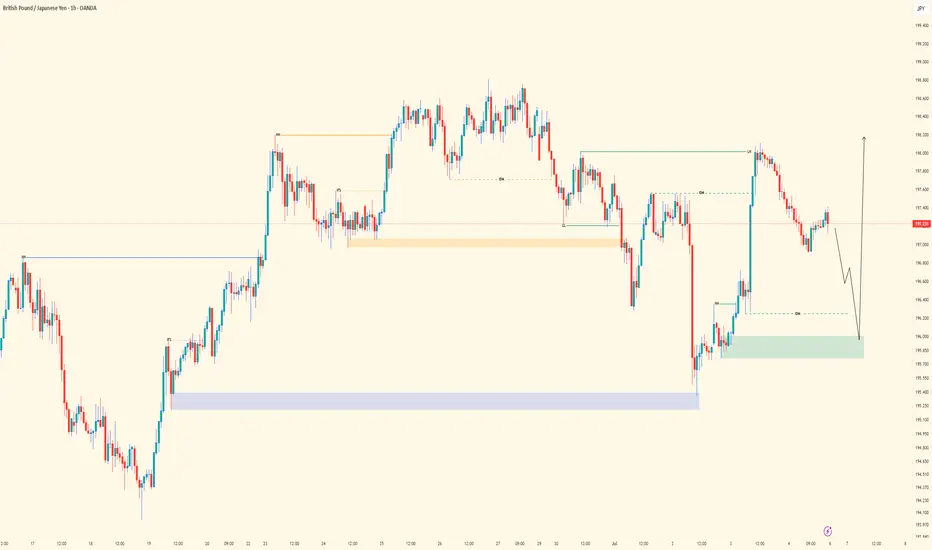
gbpjpy sell setup🔍 Key Concepts in This Setup:
1. Break of Structure (BOS) – Bullish Shift
The BOS shows that price has broken above a previous swing high, signaling a shift from bearish to bullish market structure.
This confirms bullish intent and opens the door for pullback buys.
2. Fair Value Gap (FVG) – Blue Zone
This imbalance zone is created when price aggressively moves up, leaving a gap.
Price is expected to return to this area to fill orders before continuing up.
3. Bullish Order Block – Orange Zone
A bullish order block (OB) is marked just below the FVG.
It represents the last bearish candle before a bullish impulse — an area where institutions may re-enter long positions.
4. PDL Sweep (Previous Day Low)
Price took out the previous day’s low (PDL) and then reversed.
This is a liquidity grab – a classic smart money move before shifting bullish.
5. Premium to Discount Retracement
Price moved from a discount zone after sweeping lows and breaking structure.
Now waiting for a retracement back into a discounted FVG/OB zone to enter a buy.
✅ Buy Entry Plan:
Entry Zone: Around the FVG + OB confluence (196.90–197.10 area).
Confirmation: You might wait for bullish PA (price action) like a bullish engulfing or lower-timeframe BOS at the FVG.
Stop Loss: Below the order block or just under 196.79.
Target: Back to recent highs near 198.10 or even the supply zone (SS) above it.
GJ-Mon-07/07/25 TDA-Both sides possible, more structure->clarityAnalysis done directly on the chart
Follow for more, possible live trades update!
I often share my live trades in Tradingview public chat in London session, stay tuned!
I often repeat in my analysis, more structure, more clarity,
easier trend identification. I won't and I will never catch
every single move but with more structure and more clarity
you'll likely to increase the probability that a move will
happen in either direction.
I don't give signals blindly, people should learn
and understand the skill.
Following blindly signals you won't know how to
manage the trade, lot size and replicate the move
over time.
That's why you need active real time discussions.
Trading is not get rich quick scheme!
Active in London session!
Not financial advice, DYOR.
Market Flow Strategy
Mister Y

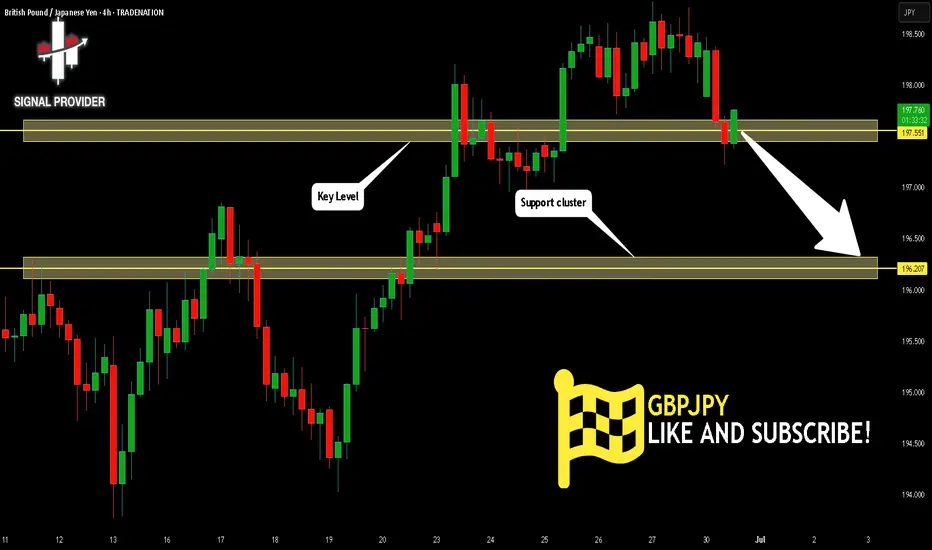
GBPJPY Will Go Down From Resistance! Sell!
Please, check our technical outlook for GBPJPY.
Time Frame: 4h
Current Trend: Bearish
Sentiment: Overbought (based on 7-period RSI)
Forecast: Bearish
The price is testing a key resistance 197.551.
Taking into consideration the current market trend & overbought RSI, chances will be high to see a bearish movement to the downside at least to 196.207 level.
P.S
Overbought describes a period of time where there has been a significant and consistent upward move in price over a period of time without much pullback.
Disclosure: I am part of Trade Nation's Influencer program and receive a monthly fee for using their TradingView charts in my analysis.
Like and subscribe and comment my ideas if you enjoy them!
GBPJPY...LONGPrice is nearing a critical level around . No setup, no trade. For me, a solid plan always comes before any prediction.
If the zone is broken and confirmed with a retest, I’ll adjust my plan accordingly for a possible reverse trade.

GBP/JPY Rejection from Resistance Zone GBP/JPY Rejection from Resistance Zone 🧱📌 | Bearish Setup In Play 🔻💹
📌 Technical Analysis Overview:
The chart illustrates a clear rejection from the resistance zone around 198.460, where previous price action formed a double-top pattern (🔴 red arrow). This suggests a strong supply area with selling pressure building.
🔍 Key Observations:
📏 Trendline Break:
The upward trendline (blue) has been decisively broken.
This break signals a loss of bullish momentum.
🧱 Resistance Zone @ 198.000–198.460:
Price tested this zone multiple times but failed to break above.
Acts now as a strong resistance zone.
🟠 Support Turned Resistance:
Former support has now turned into resistance (highlighted in blue text: "SUPPOT").
📉 Bearish Projection:
The projected path indicates a possible retest of the resistance zone before a sell-off continuation.
Target area: around 194.500, marked as “TAEGET FAXS” (typo: should be “TARGET ZONE”).
🔄 Possible Scenarios:
✅ Bearish Continuation:
If price rejects again near 198.000, expect a bearish move toward 194.500.
⚠️ Invalidation:
A strong breakout above 198.460 would invalidate the bearish thesis and may resume bullish momentum.
🔚 Conclusion:
The pair is currently under pressure with a confirmed break in trend structure. As long as price remains below 198.460, the bias remains bearish with a target toward the 194.500 zone. 📉👀

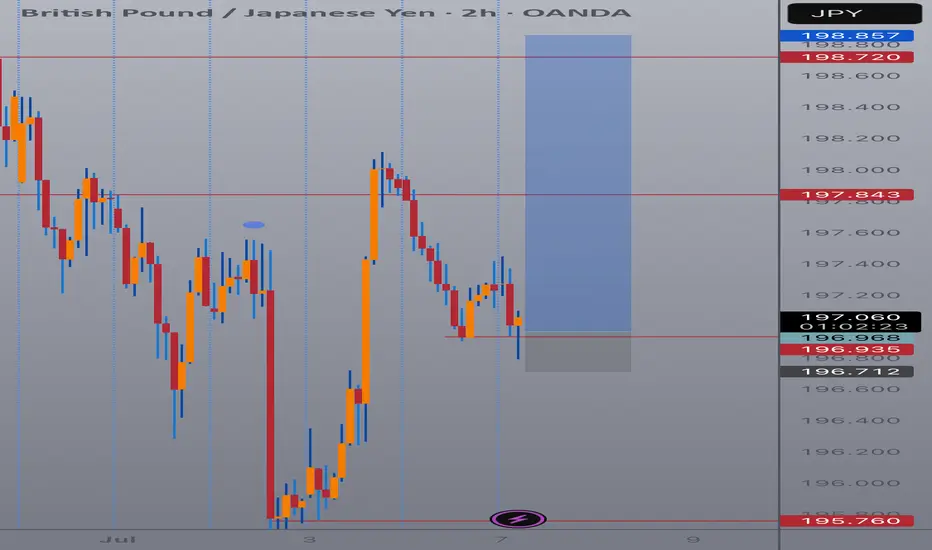
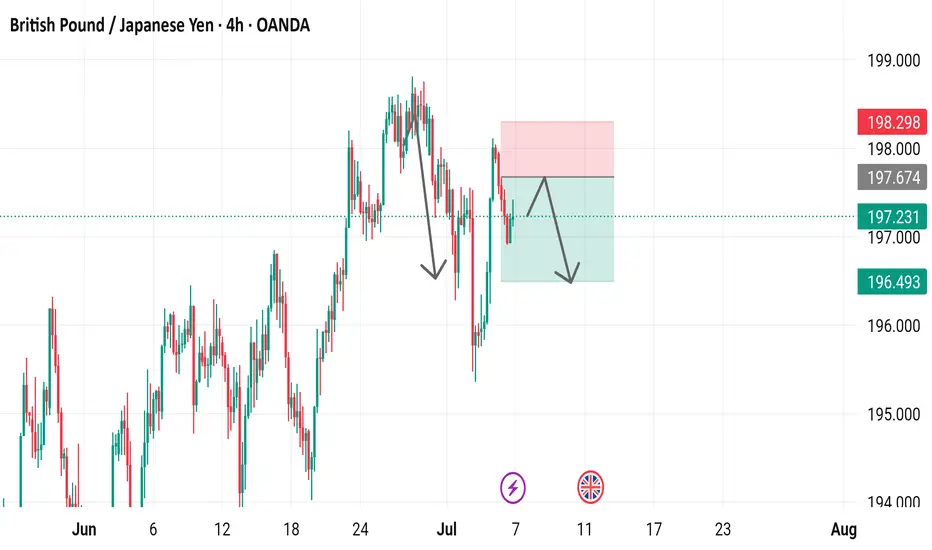
GBP/JPY 4-Hour Chart Analysis - OANDA4-hour chart of the British Pound (GBP) against the Japanese Yen (JPY) from OANDA shows a recent price of 197.231, with a decrease of 0.653 (-0.33%). The chart highlights a sell signal at 197.006 and a buy signal at 197.456, with a 45.0 pip difference. A downward trend is indicated with a shaded resistance zone between 198.298 and 197.674, suggesting potential selling pressure as the price approaches this level. The chart covers data from late June to early July 2025.
GBPJPY OutlookClean Sweep Event (SE) tapped liquidity, followed by a Trend Signature Shift (TSS) hinting bullish reversal. Eyes on price retesting the LRP zone before targeting Primary Liquidity at 198.800, with extended focus on the OCZ/W-PIZ zone above 199.500.

"GBPJPY Eyes 198.10 After Bouncing from Key Support"The price of GBP/JPY is moving inside an ascending channel and has recently rebounded from a support level around 197.06. If the bullish momentum continues, we may see the price test 197.65 and potentially reach 198.10. However, if the price breaks below 196.41, this bullish idea may be invalidated.

Shorty GbpJpyLook for liquidity sweep at the end of each trend
Mark your retracement zones
Use Fibonacci to find your sl and tp zones
Rule of your deposit
Try to set sl at 10% of your deposit
Use a reasonable lot size
AND MAKE A TRADE

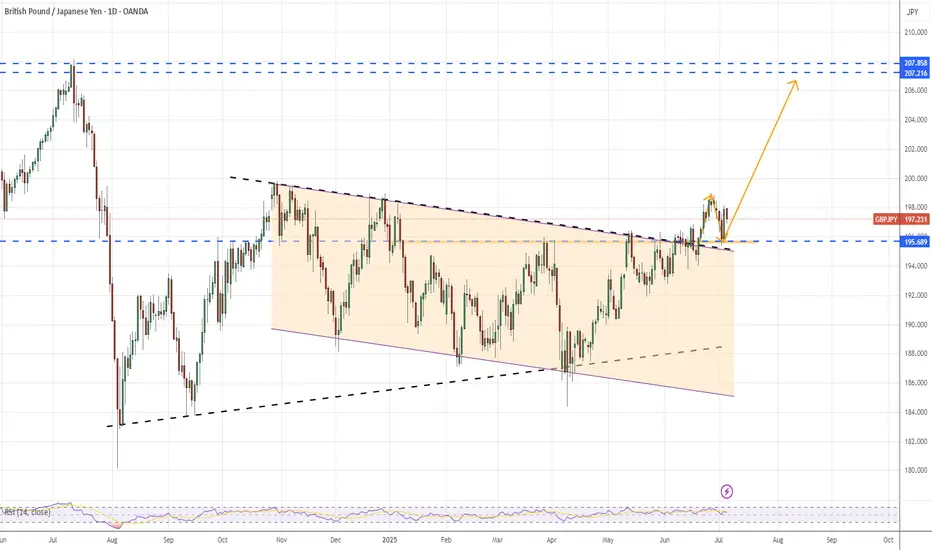
GBPJPY Daily swing opportunitiesHow should we view the current market situation?
1:It can be seen as a breakthrough of large triangle convergence
2:It can also be seen as a breakthrough of a large channel
3:It can also be seen as a breakthrough of a large double bottom
Can be regarded as a retracement after a breakthrough
Expect the bullish trend to continue in the later period
GBPJPY Breakout and Potential RetraceHey Traders, in the coming week we are monitoring GBPJPY for a buying opportunity around 196.600 zone, GBPJPY was trading in a downtrend and successfully managed to break it out. Currently is in a correction phase in which it is approaching the retrace area at 196.600 support and resistance zone.
Trade safe, Joe.

GJ| - Bullish Flow Maintained |Continuation into Next Week Pair: GBPJPY
Bias: Bullish
Timeframes: 4H, 1H, 30M
• 4H structure remains clean and bullish — no break in flow. Price is still respecting HTF order and momentum.
• 30M gave us that deeper SSL sweep, likely grabbing the early buyers and fast hands. But we stayed patient and followed the structure.
• 1H shows my view clearly — bullish pressure confirmed with reaction from OB and shift in momentum.
🔹 Entry: After sweep of SSL into demand (OB)
🔹 Entry Zone: Green zone marked — same level from earlier in the week
🔹 Target: Near structure highs — letting price flow up clean
Mindset: Week played out with precision. All levels still valid going into next week — no need to erase, just observe how price continues to respect our framework.
Bless Trading!
Forex. Orderflow. [30.06--04.07]Covering forex pairs. Thoughts and weekly runs and GJ for possible expansion next week
Having a sore throat bear with that

GBPJPY DAILY MARKET OUTLOOK!Price just retested a symmetrical triangle after a breakout to the upside. From the technical standpoint, we’re going to see more bullish price action developments away from the current market price.

BUY GBPJPY now for a four hour time frame bullish trend continuBUY GBPJPY now for a four hour time frame bullish trend continuation ...............
STOP LOSS: 196.33
This buy trade setup is based on hidden bullish divergence trend continuation trading pattern
TAKE PROFIT : take profit will be when the trend comes to an end, feel from to send me a direct DM if you have any question about take profit or anything...
Remember to risk only what you are comfortable with... trading with the trend, patient and good risk management is the key to success here

GBPJPY 4HRPrice has reached a demand area. It is expected that it would rise as directed by the arrow.
