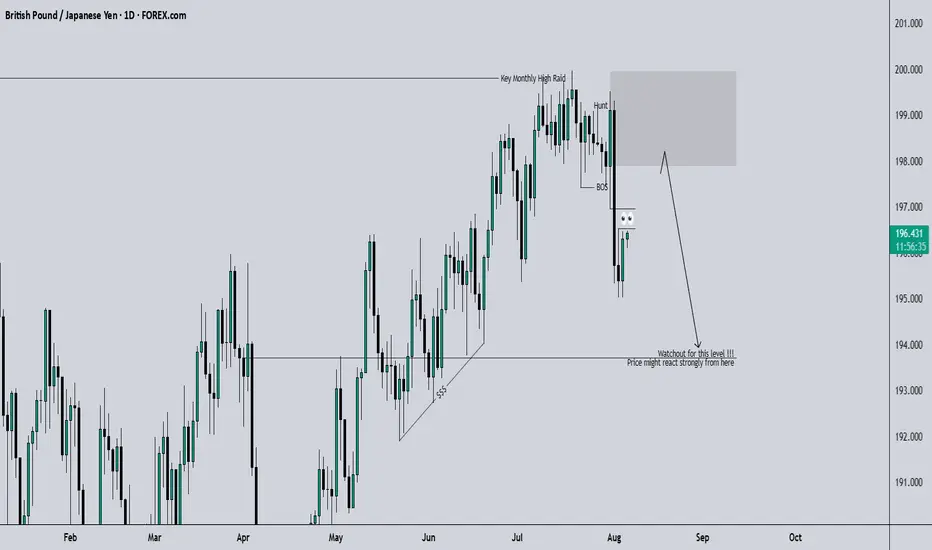
GBPJPY SWING: SHORT-TERM BEARISH OPPORTUNITYHi there,
Overall for the 3rd quarter of the year, I speculate a bullish candle close, however, for price to rally, it needs to trade lower to gather the needed liquidity. Hence, the short-term bearish move.
If you turn your chart to the 3M, you will see the wick of the last quarter's candle which translates to the Monthly OB that price is most likely to trade into after running multiple stops.
Check out my next post on CADJPY.
Cheers,
Jabari
JPYGBP trade ideas
GBPJPY: Will Start Falling! Here is Why:
Our strategy, polished by years of trial and error has helped us identify what seems to be a great trading opportunity and we are here to share it with you as the time is ripe for us to sell GBPJPY.
Disclosure: I am part of Trade Nation's Influencer program and receive a monthly fee for using their TradingView charts in my analysis.
❤️ Please, support our work with like & comment! ❤️

GBPJPY - at ResistanceSterling Yen long term was consolidating since Aug 24.
Now the price reached the FR 127.2 and respected it as Resistance.
On Aug 1st the support at FR 100 was broken. Yet, price crossed down SMA200 (4H)
Now price is testing the SMA200 from below, which is aligned with FR 61.8 of the latest impulse down.
If the Resistance at 198 holds, price may commence a longer correction, potentially down to 194 or even to 190.
Just my humble opinion.

GBP/JPY Could Be Rising Into a Bear ZoneGBP/JPY is trying to notch its third bullish day heading into today's Bank of England (BOE) meeting. But with a cut expected and the potential for a dovish tone, I suspect its upside could be limited. Besides, the technical clues on the daily and weekly chart suggest we may have seen a major top in July.
Matt Simpson, Market Analyst at City Index and Forex.com

GJ|- Bullish Momentum Setup for Next Week4H – From the top-down, price has been respecting structure and just broke major highs with strong momentum to the upside.
30M – Price pulled back into structure, refined to the cleanest level. Before that, we had the professional sweep I mentioned in my last GJ post.
5M – I’m watching for a sweep of SSL into my refined zone before taking an entry. Once that happens, I’ll look for bullish follow-through.
Buy Zone: 196.264
SL: 195.925
Bias: Bullish continuation into next week — pending liquidity sweep confirmation.

GBPJPY; Heikin Ashi Trade Idea📈 Hey Traders!
Here’s a fresh outlook from my trading desk. If you’ve been following me for a while, you already know my approach:
🧩 I trade Supply & Demand zones using Heikin Ashi chart on the 4H timeframe.
🧠 I keep it mechanical and clean — no messy charts, no guessing games.
❌ No trendlines, no fixed sessions, no patterns, no indicator overload.
❌ No overanalyzing market structure or imbalances.
❌ No scalping, and no need to be glued to the screen.
✅ I trade exclusively with limit orders, so it’s more of a set-and-forget style.
✅ This means more freedom, less screen time, and a focus on quality setups.
✅ Just a simplified, structured plan and a calm mindset.
💬 Let’s Talk:
💡Do you trade supply & demand too ?
💡What’s your go-to timeframe ?
💡Ever tried Heikin Ashi ?
📩 Got questions about my strategy or setup? Drop them below — ask me anything, I’m here to share.
Let’s grow together and keep it simple. 👊

GBPJPY Sell IdeaGBPJPY – Daily Chart Sell Setup
Entry Zone: 198.850 – 199.300
Stop Loss: 199.845
Take Profits:
1️⃣ 197.880
2️⃣ 196.900
3️⃣ 195.450
Rationale:
Price is testing a key resistance zone. I'm watching for rejection signals to ride the move down. Ideal for swing entries.
Stick to your plan & manage risk accordingly.

gbpjpy shortwelcome
monday played out bullish like over last week.
we reached a cruical level.
possible price drops / corrects to weekly pivot.
lets see.
thank god the be a part of it.

gbpjpy sell ideanice impulsive move.. retracement phase complete.. supply area has been reached.. wick rejection.. get a close below this support level and a nice continuation sell can play out

I’m bearish on GBPJPY — a countertrend short from resistance.GBPJPY – Resistance Holds as Momentum Shifts 📉
Trends don’t last forever — sometimes the turn starts quietly, deep inside the lower timeframes. GBPJPY’s daily uptrend is losing its edge, with 4H momentum already rolling over. Price is now pressing against a heavy resistance zone, flashing early sell signals.
📉 I’m bearish on GBPJPY — a countertrend short from resistance.
Key Drivers:
GBP hit by a 25 bps Bank of England rate cut 📉
Daily uptrend losing momentum, 4H showing reversal patterns 🔄
JPY still fundamentally weak, but sentiment extremely bearish (ripe for short-covering) ✅
Clear invalidation if price breaks above resistance 🎯
The British Pound’s bullish streak took a hit after the BoE confirmed a 25 basis point rate cut, marking a dovish shift to support the UK’s slowing economy. This move reduces GBP’s yield advantage and puts pressure on its recent strength, especially against currencies that could benefit from even a small sentiment reversal.
The Japanese Yen remains structurally weak — slow policy tightening, weak GDP growth, and heavy debt keep it under pressure. But with market positioning heavily skewed against the Yen, even modest safe-haven flows or profit-taking could spark upside moves in JPY pairs.
In this setup, I’m looking to fade GBPJPY’s test of resistance, leaning on the loss of short-term momentum as the first sign that the broader uptrend may be tiring. A rejection here could open a retracement toward recent 4H support zones, while risk remains clearly defined above resistance.
Would you take this countertrend shot, or wait for daily structure to fully break?

GJ SHORTS 199.540 AREACurrently looking at GJ shorts, could potentially look towards targeting the 198.650 broken resistance.
I personally wait for a confirmation, will not take any entry until I see so.
There is still a MARKET GAP at 199.540, so will also anticipate for that to be filled first before knowing where price can go to.
The also is a hidden 15min supply inside the market gap which could be respected.


GBP JPY SELL SETUPSee the chart for GBP JPY. came at the zone and expecting a sell continuation ..see the targets (tp-1 & tp2) trade this as swing.. do comment Ur feedback if u like my charting and analysis.
if you are interested to join my personal mentorship group which is i planning to expand ..then please join . i will assist you with more trade setups and real trade information.
message me to @thanz_123
SELLING OPPORTUNITYin high timeframe jpy baskert is at support level
gbpjpy is at resistance level
formation of candlestick pattern

GBPJPY will fall or break up!?GBPJPY is at 200.00, this is a major resistance and on break or this zone can lead GJ to move more upside but before breaking we can expect a retest before breaking resistance.
On Higher Time Frame, We saw that GJ moved upside continuously due to JPY, It didn't hunted and liquidity so we can expect a liquidity hunt before moving up, this sell trade can be risky as trend is positive for upside but we can get a scalp trade and then plan a buy from support zones.

Trading balanceTrading balance The price of the asset has rebounded from the balance zone. With the prospect of growth into the resistance zone.
@fxopen

GBPJPY Falling Wedge - Bearish-to-bullish reversal patternI see a breakout and retest of a bullish confirmation pattern and price is showing strong rejections in the form of bullish hammers on H4 TF

GBP/JPY Approaches Monthly HighGBP/JPY extends the recent series of higher highs and lows to approach the monthly high (199.31), with a move/close above the 199.80 (61.8% Fibonacci retracement) to 200.50 (78.6% Fibonacci extension) zone opening up 201.20 (23.6% Fibonacci retracement).
Next area of interest comes in around 202.00 (23.6% Fibonacci extension), but the bullish price series may turn out to be temporary should GBP/JPY fail to test the July high (199.98).
A move/close below the 195.70 (61.8% Fibonacci extension) to 196.60 (23.6% Fibonacci extension) region brings the monthly low (195.04) on the radar, with the next area of interest coming in around 192.40 (50% Fibonacci extension) to 193.50 (38.2% Fibonacci extension), which incorporates the June low (192.73).
--- Written by David Song, Senior Strategist at FOREX.com

GBP/JPY breaks 200 barrierThe GBP/JPY has just broken above the 200.00 mark for first time since July 2024. The pounds has been boosted by a hawkish BoE rate cut last week, and mixed UK data underpins, while rising global yields and rallying equity markets are undermining the low-yielding Japanese yen.
With the pair now above the 200.00 level, the key question now is whether the breakout will hold. Assuming it does, we could see a continuation of the rally towards the 202.00 level, which is now the next big resistance above here. Interim resistance comes in at 201.00 level.
In terms of support 199.00 is a clear support level, marking the high from the day before and the middle trend of the bullish channel, which the pair has just reclaimed. Below that? 197.50 is the next stop in the event we see a sudden drop.
UK wages fall more than expected
Earlier today, we had some mixed data from the UK following last week’s Bank of England rate cut, which was a very close call when policymakers were sharply divided but ultimately agreed to cut rates.
Today’s data showed average earnings increased by 4.6% in the three months to June compared to a year ago — weaker than the 5.0% rise we saw the previous month. On the jobs front, employment has now fallen eight times in the past nine months. However, the latest drop of 8,000 jobs is the smallest decline so far, suggesting the labour market may be stabilising.
A weakening jobs market could ease wage inflation pressures and open the door to further rate cuts, but whether this happens at November’s meeting remains uncertain following that hawkish cut last week, meaning the chance of another cut in November is now lower.
Meanwhile, a UK data dump is scheduled for Thursday when we will have Q2 GDP as well as monthly data on construction output, manufacturing production and a few other indicators to look forward to. The odds of a further BoE rate cut this year will continue to tumble in the event we see stronger data from the UK this week.
By Fawad Razaqzada, market analyst with FOREX.com


GBPJPYAnticipating a sell-off on GBPJPY. Price broke a trendline with heavy selling pressure ,so am expecting this trend to continue.


Management options for GBPJPY trade.If anyone took this setup I posted last week, you can move sl to break even and protect the trade. We had a chance at 1:1 earlier in the week, which would have been a good time to get out if you were trading intraday. All else is normal; we are experiencing a correction on smaller timeframes, and I expect this trend to continue downward. We are stress-free in the trade, and that is the goal, friends. Stress-free and profitable.
