GBPJPY SHORT DAILY FORECAST Q3 D2 W27 Y25GBPJPY SHORT DAILY FORECAST Q3 D2 W27 Y25
Professional Risk Managers👋
Welcome back to another FRGNT chart update📈
Diving into some Forex setups using predominantly higher time frame order blocks alongside confirmation breaks of structure.
Let’s see what price action is telling us today! 👀
💡Here are some trade confluences📝
✅Daily Order block identified
✅4H Order Block identified
✅1H Order Block identified
🔑 Remember, to participate in trading comes always with a degree of risk, therefore as professional risk managers it remains vital that we stick to our risk management plan as well as our trading strategies.
📈The rest, we leave to the balance of probabilities.
💡Fail to plan. Plan to fail.
🏆It has always been that simple.
❤️Good luck with your trading journey, I shall see you at the very top.
🎯Trade consistent, FRGNT X
JPYGBP trade ideas

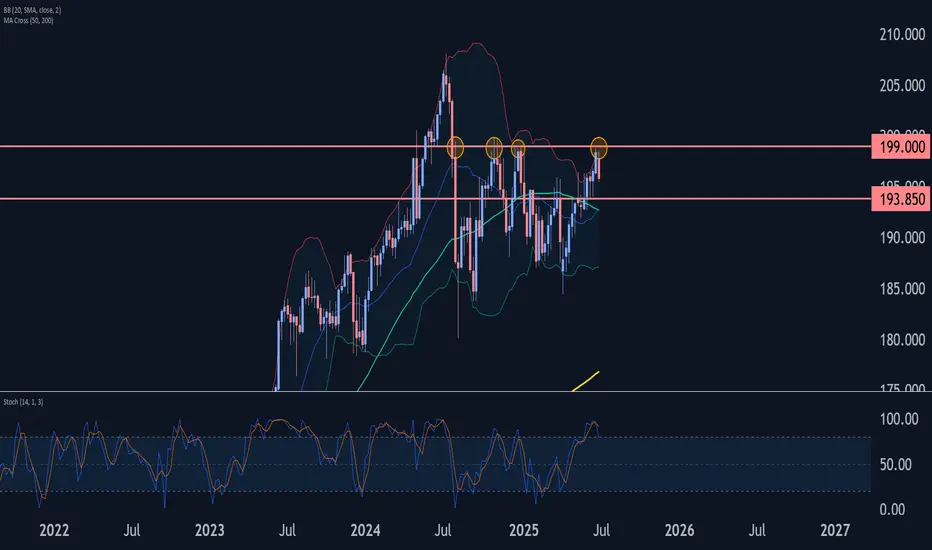
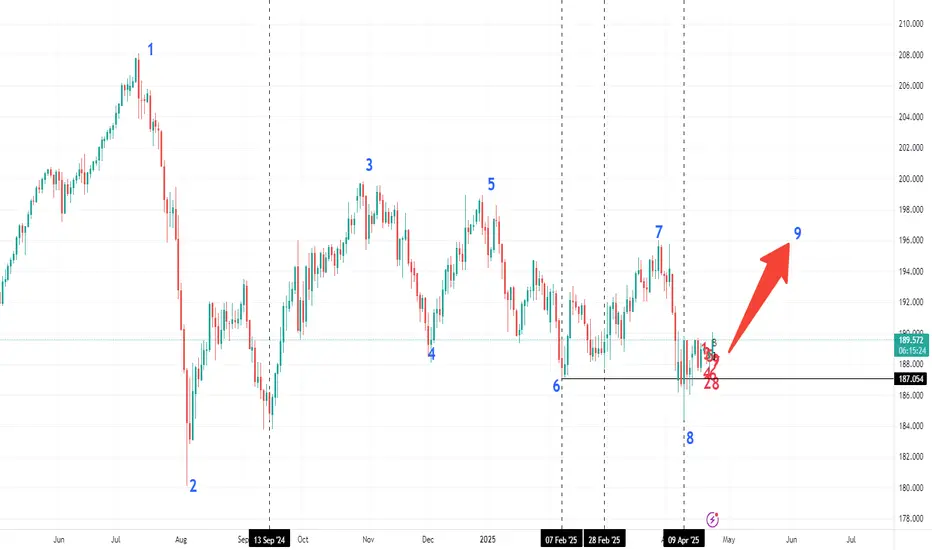
GBPJPY Wave Analysis – 2 July 2025- GBPJPY reversed from resistance zone
- Likely to fall to support level 193.85
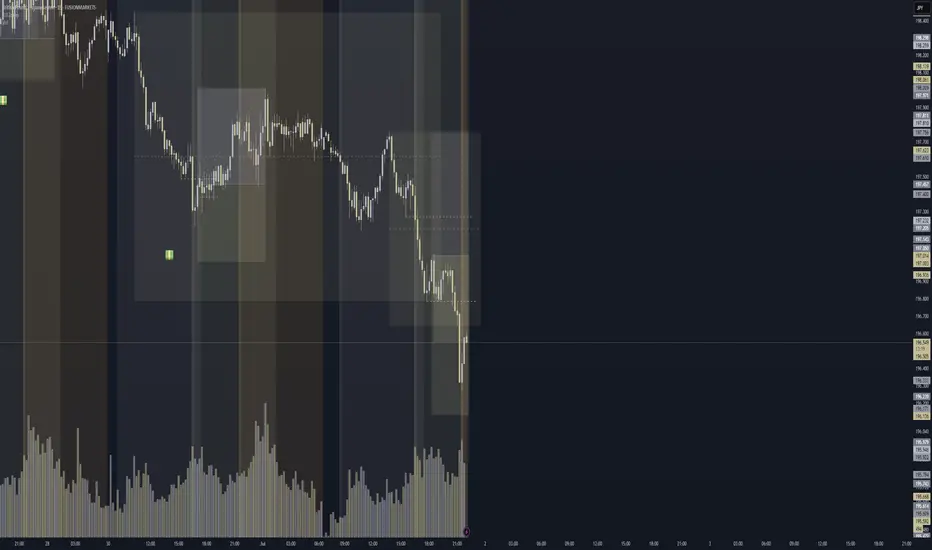
GBPJPY currency pair recently reversed down from the resistance zone between the strong resistance level 199.000 (which has been reversing the price from last October) and the upper weekly Bollinger Band.
The downward reversal from this resistance zone stopped the C-wave of the previous ABC correction (2) from April.
Given the strength of the resistance level 199.000 and the overbought weekly Stochastic GBPJPY currency pair can be expected to fall to the next support level 193.85.
GJ idea - could all YEN pairs head down?We're looking at GJ apart of me is wanting to execute but then the A+ TRADER wants me to wait for a proper break to the downside. We see price down trending, creating LL's & LH's, now we just wait for price to break our CTL. We also see multiple bearish engulfings. Feeling good about this let's scale in lightly.

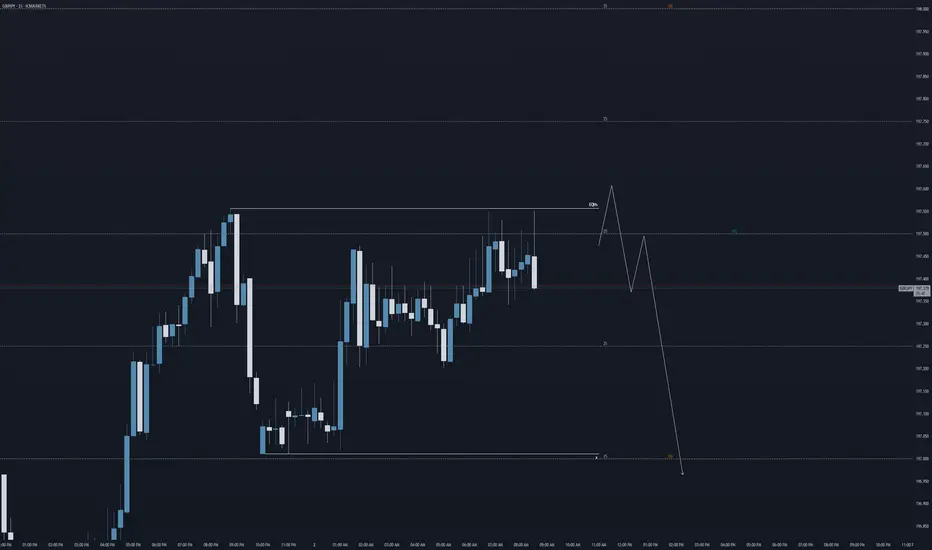
GBPJPY Short – Extended M Completion & Structural Break
Price formed an extended M pattern in premium territory, sweeping buyside liquidity at 197.473. A clean structural break followed the second peak, confirming bearish intent and shifting narrative downward. Entry was taken post-break, with a protective alert set at 197.613 to manage invalidation risk. Targeting 196.744—the upper third of the discount zone—this trade capitalizes on liquidity engineering, structure alignment, and session timing for a high-probability move toward sellside draw.
Trading balanceTrading balance The price of the asset has rebounded from the balance zone. With the prospect of growth into the resistance zone.
Potential buys on GBPJPYWaiting for price to retrace at the recent low, confirmation wicks and momentum to enter the market. Or break the recent high.

Correction It is expected that after some fluctuation and correction within the identified resistance and support areas, the correction trend will end and we will witness the beginning of an upward trend. A break of the support area will cause a continuation of the downward trend.

GBP/JPY) back bullish trend analysis Read The captionSMC trading point update
Technical analysis of GBP/JPY on the 2-hour timeframe, signaling a potential rally from a key support area. Here’s a breakdown of this analysis:
---
Technical Breakdown
1. Key Support Zone (Yellow Box):
Price has pulled back to a strong support level around 196.50–197.00.
This level previously acted as resistance and now flipped to support (classic support-resistance flip), marked by the green arrow.
2. EMA 200 as Dynamic Support:
The 200 EMA (~196.567) is just below the support zone, reinforcing the likelihood of a bullish bounce from this area.
3. Bullish Price Projection:
The chart suggests a bounce off this support zone with a projected move toward the target point at 200.132, indicating a +1.71% upside.
4. RSI Indicator (14):
RSI is at 43.47, approaching the oversold region but curving upward — supporting a potential reversal to the upside.
---
Forecasted Move
Expected Move: Bullish reversal from support, targeting 200.132.
The chart outlines a potential entry at current levels, with a bounce confirmed by price respecting the yellow support zone.
Mr SMC Trading point
---
Trading Idea Summary
Bias: Bullish
Entry Zone: Around 196.50–197.00
Stop-Loss: Below support zone (~196.00 or lower)
Take-Profit: 200.132
Confirmation: Bullish candlestick pattern or RSI crossover
plesse support boost 🚀 this analysis

GBPJPY Long – Deep Sweep Reversal from 196.786 Sellside Liquidit
Price swept major sellside liquidity at 196.786, forming the deepest leg of a broader structural draw during London session. Entry followed a clean W pattern formation and bullish reaction from deep discount territory. This setup aligned with structure, liquidity engineering, and session timing. Trade captured a reversal opportunity with price lifting from the sweep zone and targeting EQ/premium within the intraday box.
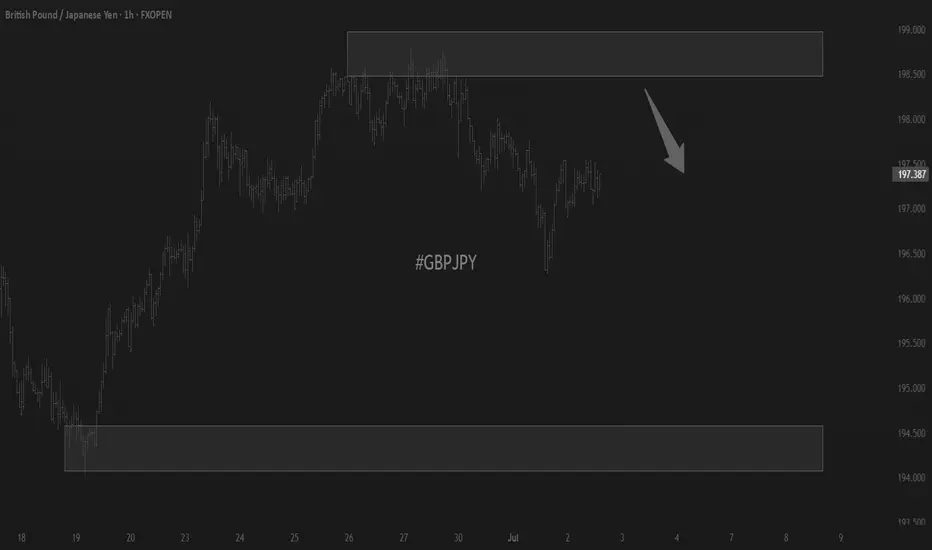
GBP/JPY Shifts to Bearish Trend – Key Levels to MonitorGBP/JPY Shifts to Bearish Trend – Key Levels to Monitor
The GBP/JPY pair has entered a confirmed bearish trend structure, with the formation of a lower low signaling increasing selling pressure. This technical development suggests the currency pair may continue its downward trajectory in upcoming trading sessions, presenting potential shorting opportunities for traders.
Bearish Confirmation
The recent lower low formation serves as a classic technical confirmation of bearish momentum. This pattern indicates sellers are successfully pushing prices below previous support levels, establishing a new downward trajectory. The breakdown follows what appears to be exhaustion of the prior bullish trend, with bears now taking control of market direction.
Downside Targets
The pair now eyes potential support levels at:
- 196.300 (immediate target)
- 194.300 (secondary objective)
These levels may provide temporary support, but a decisive break below could accelerate the decline. Traders should watch for potential bearish continuation patterns or reversal signals around these zones.
Key Resistance
The 198.900 level now stands as critical resistance. Any corrective rallies toward this zone:
- May attract fresh selling pressure
- Could offer potential short entry opportunities
- Would need to be decisively broken to invalidate the bearish outlook
Market Considerations
Several factors could influence GBP/JPY's movement:
- Bank of England vs. Bank of Japan policy divergence
- Risk sentiment in global markets
- UK economic data releases
Trading Strategy
With the bearish structure confirmed, traders might consider:
- Short positions on rallies toward resistance
- Tight stop-losses above 198.900
- Profit-taking near support levels
The bearish outlook remains valid unless price reclaims and sustains above the 198.900 resistance level. As always, proper risk management is essential when trading this volatile currency pair.

GJ: 50 pip bear leg forecastHi everyone,
I'm forecasting a 50 pip bearish leg on GBPJPY from 197.5 down to 197.0
Looking at price to sweep the highs first (liquidity sweep), before then waiting for the right confirmations to take it lower... IF the price says so.
Kind regards,
Aman | SMC Wolf FX
1-1 student onboarding is currently open (website in my signature & profile)
GBPJPY ENTERED IN BEARISH TREND STRUCTUREGBPJPY ENTERED IN BEARISH TREND STRUCTURE.
Lower low confirms bearish trend structure in market.
Market is expected to remain bearish in upcoming trading sessions.
On lower side market may hit the target levels of 196.300 & 194.300.
On higher side 198.900 can act as a major resistance level for the market.

GJ-Wed-02/07/25 TDA-Daily support 196.371 tapped and rejectedAnalysis done directly on the chart
Follow for more, possible live trades update!
I often share my live trades in Tradingview public chat in London session, stay tuned!
Patience.
There are periods where price move smoothly
and some others less smoothly. The trader's
job is to adapting to market changing conditions.
Active in London session!
Not financial advice, DYOR.
Market Flow Strategy
Mister Y

GJ Potentially BearishHi there,
We take another look at GJ. I see an ascending channel pattern with GBP/JPY trading within parallel trendlines. The pair respected both the upper and lower boundaries of this bullish channel, with the current price action showing consolidation near the upper resistance around 198.20 levels.
🎙️ **Key Support and Resistance Levels**
We have critical levels at the time of this writing as following:
- **Immediate Support**: 197.30 (61.8% Fibonacci retracement level) and 196.434 (38.2% Fibonacci retracement)
- **Major Support**: 194.0 37 representing the main channel support
- **Resistance**: 198.80 acting as the primary obstacle.
- **Extended Target**: 199.55 as the next potential bullish objective
**Wave Structure Analysis**
We have ABC wave pattern, with the pair seeming to have completed a Wave (C) bullish rally and now forming a temporary retracement. The current consolidation suggests the pair is "catching its breath" before a breakout.
## 🎲 Some Fundamental Highlights Appealing to Bullish Bias:
**1. Bank of England's Cautious Easing Stance**
BoE Governor Bailey has signaled a "gradual and careful" approach to monetary policy, pointing to sticky inflation concerns while acknowledging a softening labor market with over 100,000 fewer payrolled workers in May. This measured approach is keeping the British Pound supported near year-to-date highs.
**2. Bank of Japan's Divided Policy Response**
The BoJ remains cautious despite rising inflationary pressures, with Governor Ueda maintaining a data-dependent approach. While hawkish board member Naoki Tamura suggests "decisive" rate hikes may be needed, the central bank's measured pace at just 0.5% rates keeps the Yen defensive against stronger currencies.
**3. Inflation Dynamics Favoring GBP**
Japan's Consumer Price Index has surged due to higher food and energy costs, yet the BoJ's hesitant response contrasts with the BoE's more proactive stance on inflation management. This divergence in central bank responses to inflation is supporting GBP strength against the Yen.
**4. Upcoming Japanese Economic Data Releases**
Key Japanese economic indicators are scheduled for release, including June Tokyo CPI, May Unemployment Rate, and Retail Trade data. These releases could provide clarity on the BoJ's future policy direction and potentially impact the Yen's performance against the Pound.
Happy Trading,
K.
Not trading advice.

GBPJPYPrice action trading is a methodology where traders make decisions based on the interpretation of actual price movements on a chart, rather than relying primarily on lagging indicators. It involves observing and analyzing candlestick patterns, trend lines, support and resistance levels, and volume to identify potential trading opportunities and manage risk. The focus is on understanding the story the market is telling through its price behavior.

TCB Checklist Score: 95%🧠 TCB Strategy Breakdown:
This is a textbook example of a TCB Flow setup:
🔹 Trend Phase
The market had been in a strong bullish trend leading into the end of June, topping near 198.800. That bullish impulse set the directional context — the market is overall bullish on the higher timeframe.
Even though price pulled back from those highs, no structural break to the downside occurred. So we still treat the overall flow as bullish.
🔹 Countertrend Phase
From the highs, price began a clean descending channel — the typical correction we look for. It wasn’t random chop — it had defined boundaries, touchpoints, and aligned with the psychology of a cooling market before the next push.
The countertrend ended with a false breakdown below 197.00, quickly rejecting off the 196.850 support zone. That created the final “spring” setup to trap early sellers.
🔹 Breakout Phase
We then get the breakout — price slices through the countertrend channel and closes strongly above it, just above 197.350–197.500 — which also acted as an earlier support–turned–resistance zone. That dual confluence makes this breakout high probability.
The best part? After the breakout, price dipped back into the zone, gave a clean retest wick, and showed bullish rejection — our TCB-style entry trigger.
🧭 Why This Trade Stands Out:
✅ Structure is clear — trend, pullback, breakout all line up visually
✅ No conflicting zones — clean path to TP (198.627)
✅ Risk–Reward solid — SL below last reaction low, TP back to major resistance
✅ Session timing — breakout happening around NY session, ideal for momentum
Clean TCB structure unfolding:
🔹 Trend Phase: Bullish move into 198.800 zone
🔹 Countertrend: Descending channel formed from highs
🔹 Breakout: Price broke above the countertrend channel with confluence at 197.35–197.50 support
✅ TCB Checklist Score: 95%
🎯 Entry: 197.50
🛡️ SL: 196.95
🏁 TP: 198.627
📈 R-Multiple: Projected 2.25R
NY session momentum could push this clean breakout toward target.
Trade the Flow. Master the Market – #TCBFlow

Bearish continuationI am expecting price to continue lower from here for the short term. Since we have already mitigated the HTF bullish continuation demand zone this is a medium probability setup. Often this types of setup works best when applied with the LTF confirmation. Also there is a strong spike after the mitigation of daily demand zone so that is a good indication of big money buying pressure.

Can the pound-yen maintain its uptrend?Fundamental:
BoE Governor Bailey signaled potential rate cuts ahead, with markets expecting a 0.25% rate cut in Aug. Political uncertainty persists as UK PM Starmer scaled back on welfare reforms amid a party rebellion, adding to fiscal caution. Trade tensions intensified as US President Trump threatened new tariffs on Japan and demanded greater agricultural access.
Technicals:
GBPJPY retreated from recent highs following a break above the ascending channel's upper bound. If GBPJPY rebounds from the support at 196.50, the price could extend its rally to the psychological resistance at 200.00. Conversely, a break below 196.50 could prompt a decline to the following support at 193.80.
By Li Xing Gan, Financial Markets Strategist Consultant to Exness

GBP/JPY Best Place To Buy Very Clear , Let`s Get This 200 Pips !Here is my 4H T.F Chart and if we check we will see that we have a very good support area very near the price now and we have already a good breakout and the price never retest the broken res and new supp so i`m waiting the price to retest it and give me any bullish price action and then we can buy it and targeting from 100 to 200 pips . and if we have a daily closure below my support then this idea will not be valid .

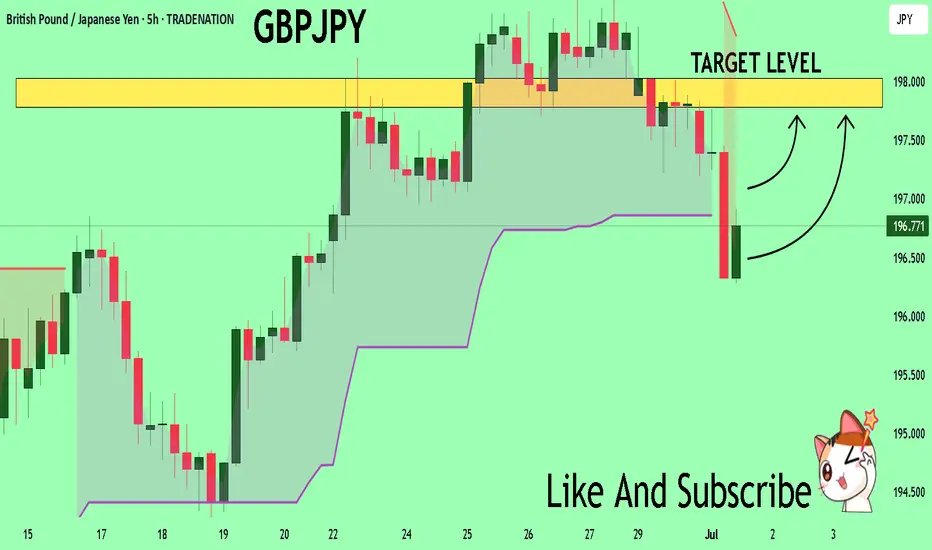
GBP_JPY WILL GROW|LONG|
✅GBP_JPY made a pullback
From the resistance above just
As we predicted, however, the
Pair made a retest of the horizontal
Support below around 196.500 and
We are already seeing a beautiful
Rebound so as the pair is in the
Uptrend we will be expecting
A further bullish move up
LONG🚀
✅Like and subscribe to never miss a new idea!✅
Disclosure: I am part of Trade Nation's Influencer program and receive a monthly fee for using their TradingView charts in my analysis.

#GBPJPY Buy 196.732#GBPJPY Buy 196.732
SL 196.132
TP 196.932
TP 197.732
TP 199.132
Trade at your own risk
Protect your capital
The Wizard 🧙♂️ SWFX

GBPJPY On The Rise! BUY!
My dear friends,
Please, find my technical outlook for GBPJPY below:
The instrument tests an important psychological level 196.72
Bias - Bullish
Technical Indicators: Supper Trend gives a precise Bullish signal, while Pivot Point HL predicts price changes and potential reversals in the market.
Target - 197.78
About Used Indicators:
Super-trend indicator is more useful in trending markets where there are clear uptrends and downtrends in price.
Disclosure: I am part of Trade Nation's Influencer program and receive a monthly fee for using their TradingView charts in my analysis.
———————————
WISH YOU ALL LUCK