GBPJPY: Pullback From Trend Line 🇬🇧🇯🇵
I think that GBPJPY may bounce from a rising trend line
that I spotted on a daily time frame.
As a confirmation, I spotted 2 intraday bullish breakouts:
a violation of a resistance line of a falling channel
and a breakout of a neckline of a cup & handle pattern.
Goal - 195.0
❤️Please, support my work with like, thank you!❤️
I am part of Trade Nation's Influencer program and receive a monthly fee for using their TradingView charts in my analysis.
JPYGBP trade ideas

GBPJPY Bullish Setup: Reversal Brewing a Key Zone📈 **GBPJPY Bullish Setup: Reversal Brewing at Key Zone** 🔍
**Pair:** GBPJPY
**Timeframe:** 15m / 1H Confluence
**Bias:** Bullish (waiting for confirmation)
⚡️ **Key Technical Highlights:**
🔹 **1H Demand Zone** – Price is sitting inside a strong historical reversal area around **194.00–194.20**, where we've seen multiple prior bounces.
🔹 **Trendline Support** – Tapping a clean ascending 1H trendline that has held multiple times.
🔹 **Bullish Divergence (15m RSI)** – Momentum is shifting: while price made a lower low, RSI formed a higher low — classic divergence signaling potential reversal.
🔹 **Descending Channel Forming a Wedge** – Price action is coiling inside a falling wedge. Watching closely for a **bullish breakout** above channel resistance.
🔹 **Wick Rejections / Seller Exhaustion** – Repeated long wicks into the zone indicate sellers are losing steam.
🧠 **Bullish Setup Idea:**
✅ **Trigger:**
Look for a break above **194.80** (channel resistance + 0.0 fib)
Then a **higher low retest entry** near **194.40–194.50**
🎯 **Targets:**
* **TP1:** 195.28 – 195.50 (38.2%–50% fib + intraday resistance)
* **TP2:** 196.00 – 196.42 (78.6%–88.6% fib zone)
* **TP3:** 196.86 – 197.00 (full retracement + supply zone)
🛑 **Invalidation:**
* Break below **193.50 – 193.20** with bearish momentum
* RSI falling below 30 with strong bearish close
💬 Let me know if you're watching this level too — would love to hear your take!
\#GBPJPY #Forex #FXTrading #PriceAction #Divergence #BullishSetup #SmartMoney #SupplyAndDemand #TradingViewIdeas

GBP/JPY Testing Trendline SupportGBP/JPY is currently testing an ascending trendline around the 194.30 – 193.95 area. Price action suggests potential for a bullish bounce if the support holds.
Upside targets include 194.850 and 195.304, provided that the structure remains intact.
However, a confirmed break below 193.955 would invalidate the bullish scenario and potentially trigger further downside.
🔹 Support: 193.955
🔹 Resistance 1: 194.850
🔹 Resistance 2: 195.304
🔹 Structure: Trendline bounce
🔹 Timeframe: 1H
🔹 Bias: Bullish as long as 193.95 holds
This is a technical idea only – not financial advice.

GBP/JPY H1 | Rising into an overlap resistanceGBP/JPY is rising towards an overlap resistance and could potentially reverse off this level to drop lower.
Sell entry is at 194.86 which is an overlap resistance.
Stop loss is at 195.43 which is a level that sits above the 38.2% Fibonacci retracement and a multi-swing-high resistance.
Take profit is at 193.95 which is a swing-low support.
High Risk Investment Warning
Trading Forex/CFDs on margin carries a high level of risk and may not be suitable for all investors. Leverage can work against you.
Stratos Markets Limited (tradu.com ):
CFDs are complex instruments and come with a high risk of losing money rapidly due to leverage. 63% of retail investor accounts lose money when trading CFDs with this provider. You should consider whether you understand how CFDs work and whether you can afford to take the high risk of losing your money.
Stratos Europe Ltd (tradu.com ):
CFDs are complex instruments and come with a high risk of losing money rapidly due to leverage. 63% of retail investor accounts lose money when trading CFDs with this provider. You should consider whether you understand how CFDs work and whether you can afford to take the high risk of losing your money.
Stratos Global LLC (tradu.com ):
Losses can exceed deposits.
Please be advised that the information presented on TradingView is provided to Tradu (‘Company’, ‘we’) by a third-party provider (‘TFA Global Pte Ltd’). Please be reminded that you are solely responsible for the trading decisions on your account. There is a very high degree of risk involved in trading. Any information and/or content is intended entirely for research, educational and informational purposes only and does not constitute investment or consultation advice or investment strategy. The information is not tailored to the investment needs of any specific person and therefore does not involve a consideration of any of the investment objectives, financial situation or needs of any viewer that may receive it. Kindly also note that past performance is not a reliable indicator of future results. Actual results may differ materially from those anticipated in forward-looking or past performance statements. We assume no liability as to the accuracy or completeness of any of the information and/or content provided herein and the Company cannot be held responsible for any omission, mistake nor for any loss or damage including without limitation to any loss of profit which may arise from reliance on any information supplied by TFA Global Pte Ltd.
The speaker(s) is neither an employee, agent nor representative of Tradu and is therefore acting independently. The opinions given are their own, constitute general market commentary, and do not constitute the opinion or advice of Tradu or any form of personal or investment advice. Tradu neither endorses nor guarantees offerings of third-party speakers, nor is Tradu responsible for the content, veracity or opinions of third-party speakers, presenters or participants.

Technical analysis on GBPJPYYou can buy GBPJPY now at this current price let see if price would respect our analysis
Caution ⚠️: Use a proper risk management

GBPJPY BUY OR SELL IDEABased on HTF (Daily), the price is currently in an uptrend and approaching a previously broken weekly resistance level, which has now turned to support.
If the bullish trendline and support level are respected, a bullish candlestick signal would be a signal for a bullish move, while a break below the support level would be an indication of a fall to the next support area.

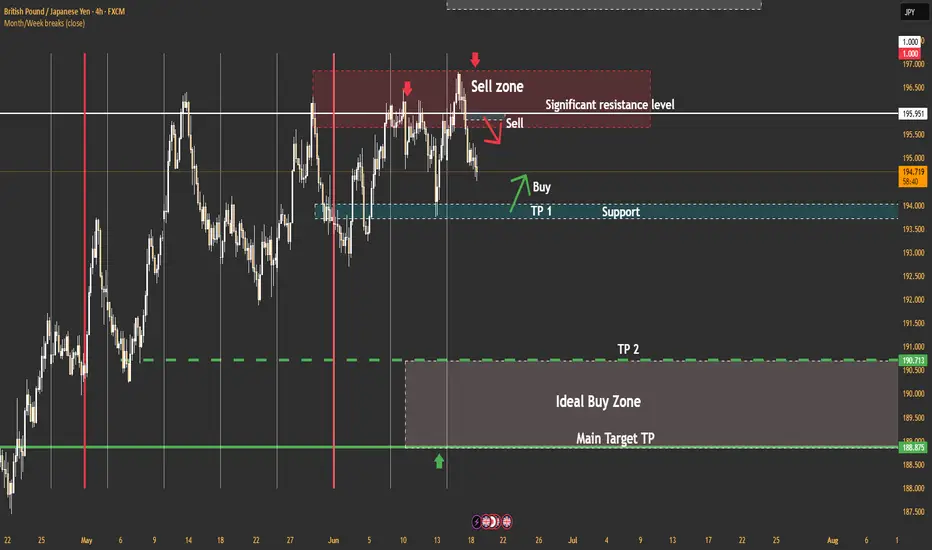
GJ June 18 UpdateWhile there's no confirmation yet for a reversal, I do see a **selling option**. However, a **buying option** is also present if the price first touches support. Ultimately, the price will reach my **target around 190.70** and continue beyond. The support zone for this will, of course, need to be broken.
GBP/JPY Technical Analysis – Targeting 198.80 on Trendline BreakGBP/JPY is currently trading around 194.75, with bullish momentum building after a clean trendline breakout and seems to be testing its support around 194.5 area with a clear market structure. The pair shows signs of institutional accumulation and a potential continuation toward the 198.80 target.
A downward sloping trendline, which capped price since late October 2024, has been decisively broken, indicating a change in sentiment.
Price formed a higher low around 193.62, which now serves as a protected low (your stop loss), supporting the idea of a bullish BOS (Break of Structure).
With momentum aligning and clean imbalance zones above, GBP/JPY could extend toward 198.80 and even further, which aligns with previous supply and fair value gap zones.
As long as price holds above 193.62, the bullish structure remains intact, with further upside likely as liquidity targets above 196.50 and 198.80 come into play.

GBPJPY BULLISHGBPJPY is in bullish trend it printing HH and HL ,right now it came to retracment most likly it bounce from entry point .

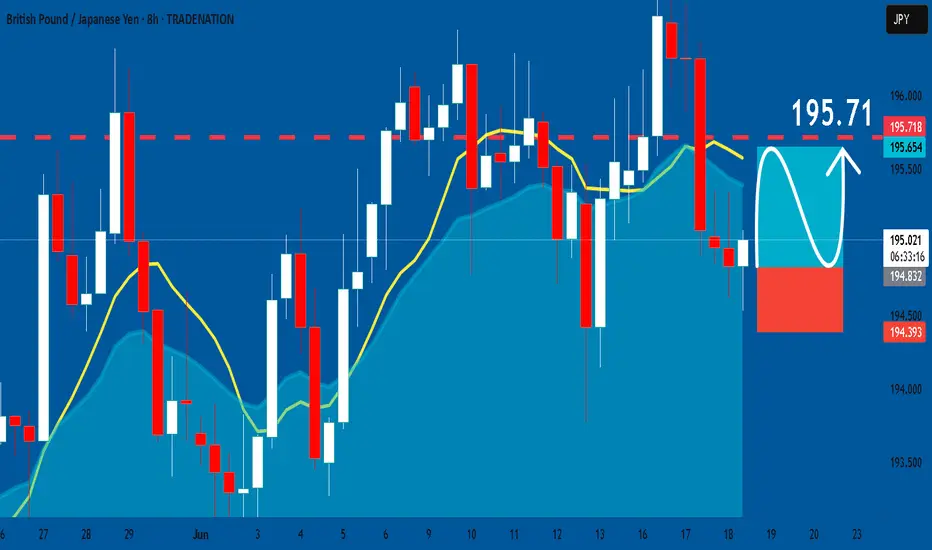
GBPJPY: Long Trade Explained
GBPJPY
- Classic bullish setup
- Our team expects bullish continuation
SUGGESTED TRADE:
Swing Trade
Long GBPJPY
Entry Point - 194.85
Stop Loss - 194.39
Take Profit - 195.71
Our Risk - 1%
Start protection of your profits from lower levels
Disclosure: I am part of Trade Nation's Influencer program and receive a monthly fee for using their TradingView charts in my analysis.
❤️ Please, support our work with like & comment! ❤️
GBPJPY Will Fall! Short!
Here is our detailed technical review for GBPJPY.
Time Frame: 9h
Current Trend: Bearish
Sentiment: Overbought (based on 7-period RSI)
Forecast: Bearish
The market is trading around a solid horizontal structure 194.806.
The above observations make me that the market will inevitably achieve 193.727 level.
P.S
We determine oversold/overbought condition with RSI indicator.
When it drops below 30 - the market is considered to be oversold.
When it bounces above 70 - the market is considered to be overbought.
Disclosure: I am part of Trade Nation's Influencer program and receive a monthly fee for using their TradingView charts in my analysis.
Like and subscribe and comment my ideas if you enjoy them!

GBPJPY SELLGBPJPY will continue to decline from this area after breaking support with some bearish strength. Double top pattern can be seen. Price should test 193,500 before the end of today


EUR/JPY, GBP/JPY, CAD/JPY, CHF/JPY Price Action SetupsWith the conclusion of the FOMC meeting just hours away, I wanted to move away from the US dollar and look at some crosses. Here are some interesting setups on yen pairs to keep in mind.
Matt Simpson, Market Analyst at City Index and Forex.com

18.06.25 Morning ForecastPairs on Watch -
FX:GBPJPY
FX:EURCAD
FX:CADJPY
A short overview of the instruments I am looking at for today, multi-timeframe analysis down to what I will be looking at for an entry. Enjoy!

GJ-Wed-18/06/25 TDA-Uncertainty looms, play it safe!Analysis done directly on the chart
Follow for more, possible live trades update!
Today topic: what's something you do outside
of trading that helps you trade?
For me example: I exercise, letting the oxygen
flow through the whole body. If you want to
perform great then not just your mind but also
your body is has to be trained.
Comment down below your opinion!
Active in London session!
Not financial advice, DYOR.
Market Flow Strategy
Mister Y


GBP_JPY RISING SUPPORT|LONG|
✅GBP_JPY is trading along the rising support
And as the pair will soon retest it
I am expecting the price to go up
To retest the supply levels above at 195.733
LONG🚀
✅Like and subscribe to never miss a new idea!✅
Disclosure: I am part of Trade Nation's Influencer program and receive a monthly fee for using their TradingView charts in my analysis.


GBPJPY Wave Analysis – 17 June 2025- GBPJPY reversed from the resistance area
- Likely to fall to support level 193.65
GBPJPY currency pair recently reversed down from the resistance area between the pivotal resistance level 196.00 (which has been reversing the price from March) and the upper daily Bollinger Band.
The downward reversal from this resistance zone will most likely form the daily Japanese candlesticks reversal pattern Bearish Engulfing - if the price closes today near the current levels.
Given the overbought daily Stochastic, the GBPJPY currency pair can be expected to fall to the next support level at 193.65 (the low of the previous minor correction ii).

Risking 25 Pips on GBPJPYGreat R:r Trade set up on GBPJPY. JPY Basket has been weak. May find support in this area
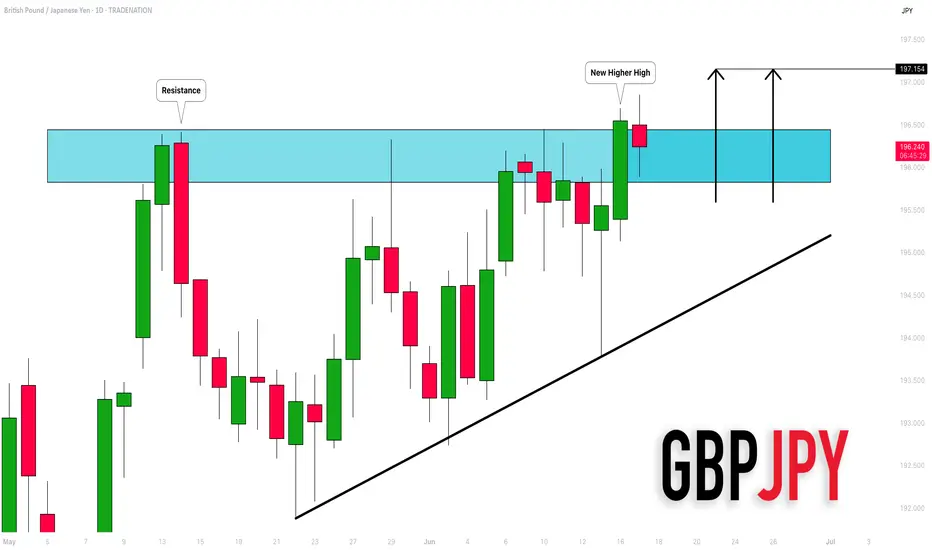
GBPJPY: Important New High 🇬🇧🇯🇵
GBPJPY set a new higher high higher close on a daily,
violating a key horizontal resistance cluster.
I think that it opens a potential for more growth.
Next strong resistance is 195.15
❤️Please, support my work with like, thank you!❤️
I am part of Trade Nation's Influencer program and receive a monthly fee for using their TradingView charts in my analysis.
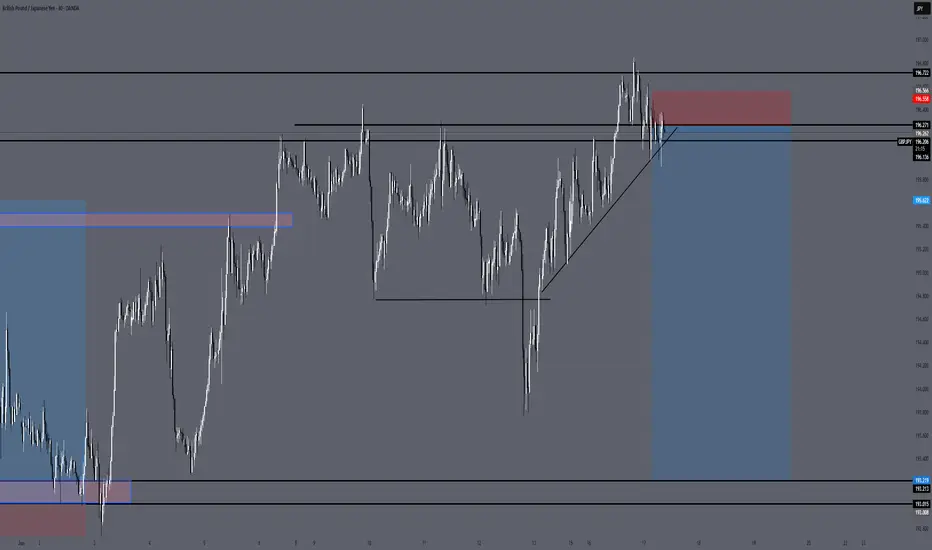
GBPJPY SHORT FORECAST Q2 W25 D17 Y25GBPJPY SHORT FORECAST Q2 W25 D17 Y25
Professional Risk Managers👋
Welcome back to another FRGNT chart update📈
Diving into some Forex setups using predominantly higher time frame order blocks alongside confirmation breaks of structure.
Let’s see what price action is telling us today!
💡Here are some trade confluences📝
✅Daily order block
✅15' order block
✅Intraday breaks of structure
✅Daily high rejection
🔑 Remember, to participate in trading comes always with a degree of risk, therefore as professional risk managers it remains vital that we stick to our risk management plan as well as our trading strategies.
📈The rest, we leave to the balance of probabilities.
💡Fail to plan. Plan to fail.
🏆It has always been that simple.
❤️Good luck with your trading journey, I shall see you at the very top.
🎯Trade consistent, FRGNT X
