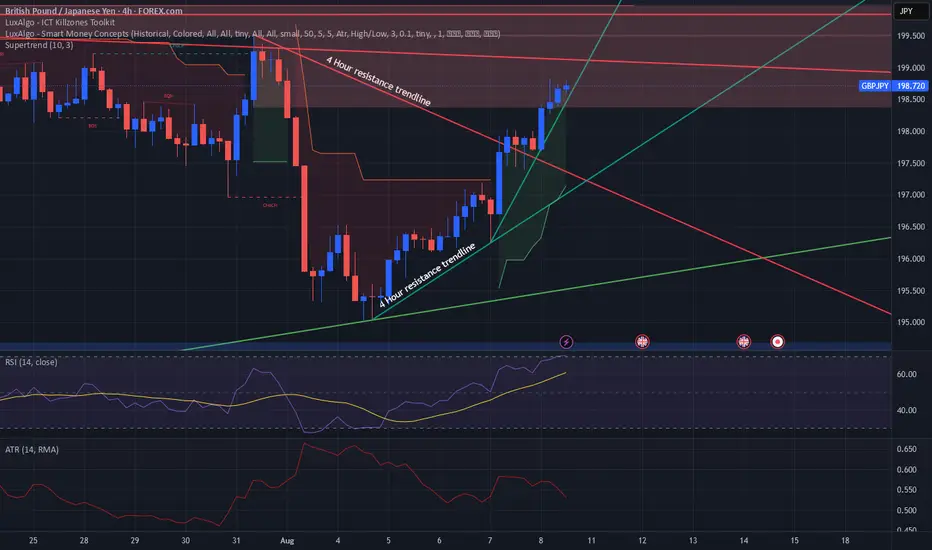
Possible downward bounce off of 199.25 for GBPJPY?Last week's run up of the GBPJPY was impressive and a trade that I frankly missed. Looking at the Smart Money Concepts indicator, it looks like the pair's price will move into sell range while approaching my monthly resistance trend line around 199.25. RSI seems strong at around 70 but not too overbought and the decline in ATR was most likely due to Friday's weakening volume after the London session close.
On the fundamental side, GDP numbers are being released for both countries that could also be a catalyst for a downward move if the British GDP misses or the Japanese GDP hits. One of those is more likely than the other in my opinion.
Feel free to comment your thoughts or opinions. This is an idea and does not constitute trading advice.
JPYGBP trade ideas
GBPJPY UPDATE MAPPING 🚨 GBPJPY Update Mapping
Price has officially broken above my previous SBR, which now acts as a strong RBS zone.
Currently, I'm looking for buy opportunities based on H4 bullish engulfing confirmation. I’ll be refining my entry on M15, ideally waiting for a break of structure or a clean bullish engulfing setup before executing.
This is my current trading idea — if you guys have any thoughts or setups on this pair, feel free to share in the comments below! Let’s grow together 📈💬
#GBPJPY #TradingSetup #PriceAction #TVABreakdown #ForexCommunity #SmartMoneyConcepts #StructureTrading


GBPJPY potential roadmapshort signal activated at highs zone. possibility 1 more push up. momentum seems to be shifting to lower. SL moved to breakeven. waiting for the move to play out impulsively failing that. be patient and wait for entry signal and repeat!

GBPJPY: Bullish Trend Intact But Showing Slowing MomentumShould we buy up to sell?
(H4)
Strong impulsive bullish leg from 197.00
Clean untested demand zone: 197.20–197.40
(H1)
OB: 198.10–198.20 could act as intraday support
Above 198.80 opens imbalance toward 200
(M15)
Consolidation near 198.50–198.80 liquidity zone
Expecting either:
Pullback to demand zones before continuation
Direct breakout above 198.80 for momentum push
Game Plan For Selling:
Watch for London session liquidity grab above 199.40–199.60
As soon as M15 prints a bearish BOS after the sweep, look for a retest into the M15 supply for entry

Breakout upPrice is in a right angle broadening descending triangle . Looking for breakout to the upside. 177 pips target should equal the last move down.

GBPJPY; Heikin Ashi Trade Idea📈 Hey Traders!
Here’s a fresh outlook from my trading desk. If you’ve been following me for a while, you already know my approach:
🧩 I trade Supply & Demand zones using Heikin Ashi chart on the 4H timeframe.
🧠 I keep it mechanical and clean — no messy charts, no guessing games.
❌ No trendlines, no fixed sessions, no patterns, no indicator overload.
❌ No overanalyzing market structure or imbalances.
❌ No scalping, and no need to be glued to the screen.
✅ I trade exclusively with limit orders, so it’s more of a set-and-forget style.
✅ This means more freedom, less screen time, and a focus on quality setups.
✅ Just a simplified, structured plan and a calm mindset.
💬 Let’s Talk:
💡Do you trade supply & demand too ?
💡What’s your go-to timeframe ?
💡Ever tried Heikin Ashi ?
📩 Got questions about my strategy or setup? Drop them below — ask me anything, I’m here to share.
Let’s grow together and keep it simple. 👊

Looking nice for more downsideThe price action looks promising so far, possibly even an add-on trade here. We will be watching on and off. Good Luck!

GBPJPY in bullish trend GBPJPY in bullish trend potential continuation setup, entry with a buy stop above the last high RR .5: .5

GBP/JPY Breakout Done , Short Setup Valid To Get 150 Pips !Here is my 1H Chart on GBP/JPY , We Have A Daily closure below my old support and new res and we have a very good bearish Price Action on 1 And 2 Hours T.F Also the price trying to retest the area now and giving a good bearish price action on smaller time frames , , So i see it`s a good chance to sell this pair and targeting 100 to 150 pips . and if we have a daily closure again above my new res then this idea will not be valid anymore .

GBP/JPY - Top Down Analysis (BULLISH)Price is still long term bullish
Higher time frame Bullish, we do see lower Buy side Liquidity I would like to see test but I dont feel price wants to return down to this level
Mid Term time frames suggest due to the failed Change of character that sellers are losing control and that price remains to want to continue in this uptrend state.
Currently price is in a large supply and not slowing down BUT I will still wait for some sort of swing range to be taken before looking for a new trade Idea. I do see this supply zone failing before then looking for price to return lower into this 50% level before buying into the Higher TF Supply for then we could look for some longer sells.
In conclusion we are short term still buying.
DM me or follow me for more

GBPJPY - PullbackGBP/JPY Analysis
The main trend remains bullish, with targets already identified.
In the current active fractal, 200.67 is the first target.
📉 However, a pullback is expected and is acceptable down to 197.69.
A break and confirmed close below 197.69 would invalidate the bullish scenario.

GBPJPY Is Very Bullish! Long!
Here is our detailed technical review for GBPJPY.
Time Frame: 12h
Current Trend: Bullish
Sentiment: Oversold (based on 7-period RSI)
Forecast: Bullish
The market is testing a major horizontal structure 198.776.
Taking into consideration the structure & trend analysis, I believe that the market will reach 200.007 level soon.
P.S
Overbought describes a period of time where there has been a significant and consistent upward move in price over a period of time without much pullback.
Disclosure: I am part of Trade Nation's Influencer program and receive a monthly fee for using their TradingView charts in my analysis.
Like and subscribe and comment my ideas if you enjoy them!

Volatile Times for GBPJPY: What’s Going On Behind the Moves?Good morning, Guys,
I’m anticipating a new short opportunity on GBPJPY once the pair reaches my sell zone level. From there, my target is set at 197.934.
Every like from you is what truly motivates me to keep sharing these insights.
Massive thanks to everyone who shows love and support!

Short Buddy!!!Close below 196.00 by 6am central time
My nsync and macD divergence have triggered
Short bias on the 1hr TF
What are your thoughts?
Trade safely my friends

GBP/JPY BULLS ARE GAINING STRENGTH|LONG
Hello, Friends!
Previous week’s red candle means that for us the GBP/JPY pair is in the downtrend. And the current movement leg was also down but the support line will be hit soon and lower BB band proximity will signal an oversold condition so we will go for a counter-trend long trade with the target being at 197.696.
Disclosure: I am part of Trade Nation's Influencer program and receive a monthly fee for using their TradingView charts in my analysis.
✅LIKE AND COMMENT MY IDEAS✅

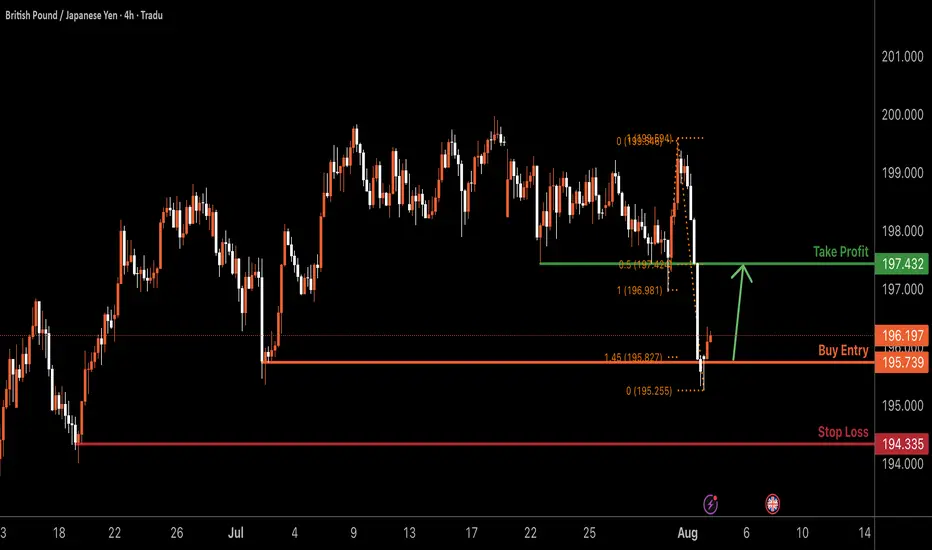
GBPJPY H4 | Bullish bounce offGBP/JPY has bounced off the buy entry, which has been identified as a swing low support and could potentially rise from this level to the take profit.
Buy entry is at 195.73, which is a swing low support that lines up with the 145% Fibonacci extension.
Stop loss is at 194.33, which is a swing low support.
Take profit is at 197.43, which is a pullback resistance that aligns with the 50% Fibonacci retracement.
High Risk Investment Warning
Trading Forex/CFDs on margin carries a high level of risk and may not be suitable for all investors. Leverage can work against you.
Stratos Markets Limited (tradu.com ):
CFDs are complex instruments and come with a high risk of losing money rapidly due to leverage. 65% of retail investor accounts lose money when trading CFDs with this provider. You should consider whether you understand how CFDs work and whether you can afford to take the high risk of losing your money.
Stratos Europe Ltd (tradu.com ):
CFDs are complex instruments and come with a high risk of losing money rapidly due to leverage. 66% of retail investor accounts lose money when trading CFDs with this provider. You should consider whether you understand how CFDs work and whether you can afford to take the high risk of losing your money.
Stratos Global LLC (tradu.com ):
Losses can exceed deposits.
Please be advised that the information presented on TradingView is provided to Tradu (‘Company’, ‘we’) by a third-party provider (‘TFA Global Pte Ltd’). Please be reminded that you are solely responsible for the trading decisions on your account. There is a very high degree of risk involved in trading. Any information and/or content is intended entirely for research, educational and informational purposes only and does not constitute investment or consultation advice or investment strategy. The information is not tailored to the investment needs of any specific person and therefore does not involve a consideration of any of the investment objectives, financial situation or needs of any viewer that may receive it. Kindly also note that past performance is not a reliable indicator of future results. Actual results may differ materially from those anticipated in forward-looking or past performance statements. We assume no liability as to the accuracy or completeness of any of the information and/or content provided herein and the Company cannot be held responsible for any omission, mistake nor for any loss or damage including without limitation to any loss of profit which may arise from reliance on any information supplied by TFA Global Pte Ltd.
The speaker(s) is neither an employee, agent nor representative of Tradu and is therefore acting independently. The opinions given are their own, constitute general market commentary, and do not constitute the opinion or advice of Tradu or any form of personal or investment advice. Tradu neither endorses nor guarantees offerings of third-party speakers, nor is Tradu responsible for the content, veracity or opinions of third-party speakers, presenters or participants.
GBPJPY - Catching The Falling Knife... ConservativelyDon't catch the falling knife! This is a common warning in the trading industry. Although i do agree with it (in some circumstances), I think what's more important is for us to perform analysis and be confident on where that knife may find a floor at.
In the case of the OANDA:GBPJPY I think we've seen that floor which may present us with the opportunity to but IF... I say if because simply making that prediction isn't enough. As a trade, what I want to see if some sort of signal from the market (while at that level) that price is more likely to do what I predict, than not.
If you have any questions, comments or want to share your views, please do so below. Also be sure to hit that like button & give me a follow, that way you don't miss my future trading ideas.
Akil

GJ| Bullish Outlook | IDM + SSL Sweep - OB Reaction(Refined & Structured):
• Pair: GBPJPY
• Bias: Bullish
• 4H Overview: Price broke major highs with bullish structure still intact. After pulling back into discounted territory, I dropped to mid timeframes to anticipate continuation.
• 30M Structure: Price took out sell-side liquidity and IDM, then mitigated a clean internal order block. Structure is refined and showing signs of smart money activity.
• Entry Zone: Watching LTFs for a clean change of character off fresh demand zones.
• Targets: 5M and 30M structural highs depending on delivery.
• Mindset Note: Patience wins here. When structure and liquidity align this clean, all that’s left is letting LTF confirm it. No need to chase—let the setup speak first.

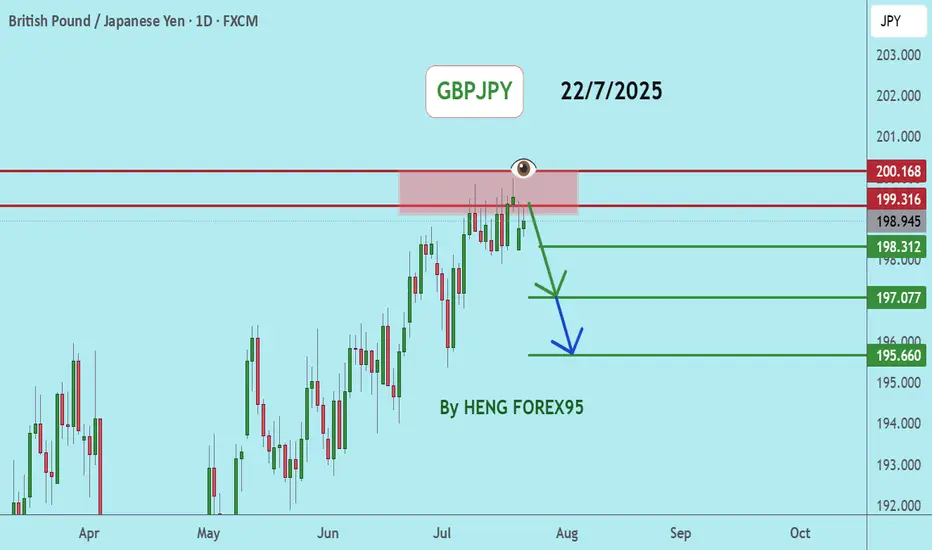
GBPJPYGBPJPY price is near the main resistance zone 200.168. If the price cannot break through the 200.186 level, it is expected that the price will go down. Consider selling the red zone.
🔥Trading futures, forex, CFDs and stocks carries a risk of loss.
Please consider carefully whether such trading is suitable for you.
>>GooD Luck 😊
❤️ Like and subscribe to never miss a new idea!
GBPJPY Will Move Higher! Long!
Take a look at our analysis for GBPJPY.
Time Frame: 1h
Current Trend: Bullish
Sentiment: Oversold (based on 7-period RSI)
Forecast: Bullish
The market is approaching a key horizontal level 195.702.
Considering the today's price action, probabilities will be high to see a movement to 197.050.
P.S
Please, note that an oversold/overbought condition can last for a long time, and therefore being oversold/overbought doesn't mean a price rally will come soon, or at all.
Disclosure: I am part of Trade Nation's Influencer program and receive a monthly fee for using their TradingView charts in my analysis.
Like and subscribe and comment my ideas if you enjoy them!

GBPJPY: A BULLISH REVERSALThe GBP/JPY pair has shown a significant turnaround, bouncing back strongly from a critical support zone. This resurgence is in line with the overall upward trend seen in GBP pairs, largely due to the Japanese yen's weakness stemming from the Bank of Japan's accommodative monetary policy.
From a technical standpoint, the 4-hour chart reveals a notable pattern. The pair has rebounded decisively from the 195.30-195.50 support range, indicating a potential shift in market sentiment. With the pair currently trading at 195.73, it's poised for a possible upward move.
Looking ahead, as long as the pair holds above 195.34, it's likely to target 197.30 and potentially 199.70 if the GBP's strength endures. This outlook hinges on sustained buying interest and the pair's ability to break through key resistance levels.
The fundamental picture supports a bullish view, driven by:
1. The Bank of England's balanced approach to monetary policy, which is bolstered by ongoing inflation concerns.
2. The Japanese yen's fundamental weakness, which is rooted in the Bank of Japan's dovish stance and reluctance to tighten policy.
3. A mildly positive risk appetite, which tends to favor the GBP over the safe-haven JPY.
However, two key risks could impact this outlook:
1. Intervention by the BoJ in the FX markets, which could temporarily boost the JPY and disrupt the bullish trend.
2. A shift in the BOE's policy stance towards a more dovish tone, which could undermine the GBP's momentum and alter the bullish trajectory.
Potential bearish drop?GBP/JPY is reacting off the resitance level which is anoverlap resistance and could drop from this level to our takeprofit.
Entry: 198.05
Why we like it:
There is anoverlap support.
Stop loss: 199.79
Why we like it:
There is a multi swing high resistance.
Take profit: 195.78
Why we like it:
There is a swing low support.
Enjoying your TradingView experience? Review us!
Please be advised that the information presented on TradingView is provided to Vantage (‘Vantage Global Limited’, ‘we’) by a third-party provider (‘Everest Fortune Group’). Please be reminded that you are solely responsible for the trading decisions on your account. There is a very high degree of risk involved in trading. Any information and/or content is intended entirely for research, educational and informational purposes only and does not constitute investment or consultation advice or investment strategy. The information is not tailored to the investment needs of any specific person and therefore does not involve a consideration of any of the investment objectives, financial situation or needs of any viewer that may receive it. Kindly also note that past performance is not a reliable indicator of future results. Actual results may differ materially from those anticipated in forward-looking or past performance statements. We assume no liability as to the accuracy or completeness of any of the information and/or content provided herein and the Company cannot be held responsible for any omission, mistake nor for any loss or damage including without limitation to any loss of profit which may arise from reliance on any information supplied by Everest Fortune Group.
