Buy GJBuy according to price action sign of reversal after pullback to 23fib within strong uptrend
Look at the chart for levels.
JPYGBP trade ideas

GBPJPY → Return to range. Possible price decline.FX:GBPJPY is forming a local bearish trend amid a correction in the dollar. The price is returning to the range and entering strong resistance.
Amid a correction in the dollar, the Japanese yen is strengthening, putting pressure on the currency pair.
GBPJPY is returning below a strong level (within the range) and consolidating in the selling zone, which could trigger a continuation of the decline towards areas of interest. Technically, the global trend is neutral and the currency pair is forming a rebound from strong downward resistance. If the bears keep the price below 193.45 - 193.74, the local downward trend may continue.
Resistance levels: 193.45, 193.74, 194.22
Support levels: 193.04, 192.35, 191.65
Price consolidation below 193.74 - 193.45 will confirm that bears are holding the range resistance. The sell-off may continue, and in this case, the price will head towards the indicated zones of interest and liquidity.
Best regards, R. Linda!

Trade Recap CW20Quick Recap of my two positions from last week and also covering a potential higher risk trade on EURUSD.

GBPJPY: Break, Retest, Boom ?Eyes on GBPJPY, Bulls Loading Up?
Price is respecting a clear ascending trendline on the 4H timeframe. After breaking through a minor Resistance Level, it looks set to pull back for a retest before continuing higher. The next target lies in the higher supply zone around the 192.500 193.000 area. As long as the trendline holds, the bullish bias remains intact.
⚠️ Not a financial advice
#GBPJPY #Forex #PriceAction #SmartMoney #TrendlineTrading #SupplyAndDemand #TechnicalAnalysis #BullishSetup #SwingTrading #MarketStructure

GBPJPYWeekly, it's on a consolidation.
The price must first touch the Key Level of 180, before anything else.

GBPJPY - Bullish No More!Hello TradingView Family / Fellow Traders. This is Richard, also known as theSignalyst.
📈As per our last GBPJPY analysis (attached on the chart), it rejected the lower bound of the rising blue channel.
What's next?
GBPJPY is currently approaching the upper bound of its falling trend marked in red.
Moreover, the green zone is a strong structure and resistance.
🏹 Thus, the highlighted red circle is a strong area to look for sell setups as it is the intersection of structure and upper red trendline acting as a non-horizontal resistance.
📚 As per my trading style:
As #GBPJPY approaches the red circle zone, I will be looking for bearish reversal setups (like a double top pattern, trendline break , and so on...)
📚 Always follow your trading plan regarding entry, risk management, and trade management.
Good luck!
All Strategies Are Good; If Managed Properly!
~Rich
Disclosure: I am part of Trade Nation's Influencer program and receive a monthly fee for using their TradingView charts in my analysis.

GBPJPY Weakens Within RangeGBPJPY Slips Below Resistance as Yen Firms Up
GBPJPY is showing signs of weakness, slipping back into a consolidation zone amid a stronger yen and dollar correction. The pair is testing key resistance between 193.45 and 193.74, with sellers gaining traction. A sustained move below this zone could open the path toward 193.04 and potentially deeper support at 192.35 and 191.65.
While the broader trend remains neutral, the current price action hints at bearish momentum. If resistance holds, the pair may extend its decline as selling pressure builds near range highs.
Key Levels
Resistance: 193.45, 193.74, 194.22
Support: 193.04, 192.35, 191.65

Trading balanceTrading balance The price of the asset has rebounded from the balance zone. With the prospect of growth into the resistance zone.

GBP/JPY🔹Symbol: GBP/JPY
🔹Price: 193.376 & 193.930
🔹Stop loss: 191.953
🔹Take profit 1: 194.788
🔹Take profit 2: 195.764
🔹Take profit 3: 197.592
🔹Take profit 4: 198.990
📊Check your chart before entering.
♦️Check before use to make sure there is no important news.

GBPJPY The Target Is UP! BUY!
My dear followers,
I analysed this chart on GBPJPY and concluded the following:
The market is trading on 193.32 pivot level.
Bias - Bullish
Technical Indicators: Both Super Trend & Pivot HL indicate a highly probable Bullish continuation.
Target - 194.72
About Used Indicators:
A super-trend indicator is plotted on either above or below the closing price to signal a buy or sell. The indicator changes color, based on whether or not you should be buying. If the super-trend indicator moves below the closing price, the indicator turns green, and it signals an entry point or points to buy.
Disclosure: I am part of Trade Nation's Influencer program and receive a monthly fee for using their TradingView charts in my analysis.
———————————
WISH YOU ALL LUCK

GBPJPY SWING TRADE.📊 GBPJPY Trade Setup
Bias: Bullish (HTFs)
Current Move: Pullback to facilitate continuation of uptrend
Timeframes: Watching 1H / 15M for break of lower high (entry trigger)
🔍 Fundamentals:
JPY: Bearish
GBP: Bullish / Neutral
✅ Fundamentals support long bias
📈 Technical Setup:
Entry: On break of lower high marked on 1H/15M
TP1: 1:1.5
TP2: 1:3
SL: Below most recent swing low
Risk per trade: 1.5%
🧠 Notes:
Ensure price closes above the marked lower high before entry.

GBPJPY Will Go Lower From Resistance! Sell!
Take a look at our analysis for GBPJPY.
Time Frame: 2h
Current Trend: Bearish
Sentiment: Overbought (based on 7-period RSI)
Forecast: Bearish
The market is on a crucial zone of supply 195.398.
The above-mentioned technicals clearly indicate the dominance of sellers on the market. I recommend shorting the instrument, aiming at 194.206 level.
P.S
We determine oversold/overbought condition with RSI indicator.
When it drops below 30 - the market is considered to be oversold.
When it bounces above 70 - the market is considered to be overbought.
Disclosure: I am part of Trade Nation's Influencer program and receive a monthly fee for using their TradingView charts in my analysis.
Like and subscribe and comment my ideas if you enjoy them!

GBPJPY 1HGBPJPY 1H
1 Hour Fair Value Gap
1 Hour Order Block
4 Hour Rejection
1 Hour Sell Side Liquidity

USDJPY and GBPJPY Analysis todayHello traders, this is a complete multiple timeframe analysis of this pair. We see could find significant trading opportunities as per analysis upon price action confirmation we may take this trade. Smash the like button if you find value in this analysis and drop a comment if you have any questions or let me know which pair to cover in my next analysis.

GBP/JPY SELLERS WILL DOMINATE THE MARKET|SHORT
GBP/JPY SIGNAL
Trade Direction: short
Entry Level: 193.409
Target Level: 190.219
Stop Loss: 195.512
RISK PROFILE
Risk level: medium
Suggested risk: 1%
Timeframe: 1D
Disclosure: I am part of Trade Nation's Influencer program and receive a monthly fee for using their TradingView charts in my analysis.
✅LIKE AND COMMENT MY IDEAS✅

CHECK GBPJPY SIGNAL READ CAPTAIN gbpjpy signal technical analysis satup 👇🏼
(gbpjpy) buy zone
( TRADE SATUP)
ENTRY POINT (193.300) to (193.400) 📊
FIRST TP (193.700)
2ND TARGET (194.100) 📊
LAST TARGET (194.500) 📊
STOP LOOS (192.800)❌
FALLOW RISK MANAGMENT

GBPJPY Take Profit Hit!Dear traders, we had a real sniper entry today. As soon as the trade was executed, price began to drop immediately—allowing us to secure profits at both 1:1.5 and 1:2 Risk-to-Reward levels. Clean execution, clean result.
This was my first and last trade of the day.
See you again tomorrow with new opportunities!

GBPJPYHello Traders,
Today’s first setup comes from GBPJPY. Based on current market conditions, I’ve identified a high-probability sell opportunity. The trade has already been executed on my end, with a Risk-to-Reward Ratio set between 1:1.5 and 1:2, depending on your individual risk appetite.
🔍 Trade Details:
✔️ Timeframe: 15-Minute
✔️ Risk-to-Reward Ratio: 1:1.50 / 1:2
✔️ Trade Direction: Sell
✔️ Entry Price: 193.564
✔️ Take Profit: 193.256
✔️ Stop Loss: 193.768
🔔 Disclaimer: This is not financial advice. I'm simply sharing a trade I’m personally taking, based on my own methodology. It is intended purely for educational purposes.
📌 If you're interested in a more systematic and data-driven approach to trading:
💡 Follow the page and turn on notifications to stay up to date with future trade ideas and market breakdowns.

GJ-Fri-16/05/25 TDA-Finally Gap filled completely, interesting!Analysis done directly on the chart
Follow for more, possible live trade updates!
Push, set back, recharge.
Push again, set back, recharge again.
Rinse and repeat.
Not financial advice, DYOR.
Market Flow Strategy
Mister Y

GBPJPY SHORT FORECAST Q2 W20 D16 Y25GBPJPY SHORT FORECAST Q2 W20 D16 Y25
Professional Risk Managers👋
Welcome back to another FRGNT chart update📈
Diving into some Forex setups using predominantly higher time frame order blocks alongside confirmation breaks of structure.
Let’s see what price action is telling us today!
💡Here are some trade confluences📝
✅Weekly order block rejection
✅Daily order block rejection
✅Intraday 15' order blocks
✅Higher time frame bearish structure
🔑 Remember, to participate in trading comes always with a degree of risk, therefore as professional risk managers it remains vital that we stick to our risk management plan as well as our trading strategies.
📈The rest, we leave to the balance of probabilities.
💡Fail to plan. Plan to fail.
🏆It has always been that simple.
❤️Good luck with your trading journey, I shall see you at the very top.
🎯Trade consistent, FRGNT X

GBP/JPY: From Fibo Resistance to Gap SupportFor JPY-weakness I think GBP/JPY still makes for a compelling argument, especially when compared to EUR/JPY. I looked at a big spot of Fibonacci resistance that came into play earlier in the week and bulls spent three days stumbling there until sellers took firmer hold today. But - now there's another major level that's in-play and that's the 193.61 level, which has reference to all the way back in the Financial Collapse...
In August of 2008 GBP/JPY closed the month at 198.08. September opened with a far different feel, and the pair gapped-down to 193.61 to begin the month. That gap was partially filled in September but for the next seventeen years has continued to carry weight. In 2015, on the heels of Abe-nomics launching huge Yen-trends, GBP/JPY found resistance at the bottom of that gap for three months before ultimately reversing.
And then last March, that gap came back into play as resistance and in the year since, it's had a big pull on price, in both directions. Most recently that 193.61 level was resistance for the past two weeks - until the Monday breakout (and breakdown in the Yen) launched the pair past the 195.00 level. But now that Yen bulls have clawed back that early-week loss, GBP/JPY is back to testing this as short-term support, as taken from prior resistance.
Like EUR/JPY in the prior post the weekly close here is huge, as bulls failing to defend this level would not only spell a more bearish looking weekly bar, but they would be giving up defense of a major long-term level in the pair. But - until there's greater evidence of Yen-strength, GBP/JPY makes for a compelling argument for Yen-weakness scenarios, perhaps even moreso than USD/JPY with the 145.00 level a little further away. -js

Resistance turning support on GJ. 193.60With that being said the Area of Value is perfect as well. With the 50 ema being above the 200ema and price pulling back to the 200 ema with the recent break through resistance at 193.60 which now may be support. Look to targer recent highs at 195-196.50.

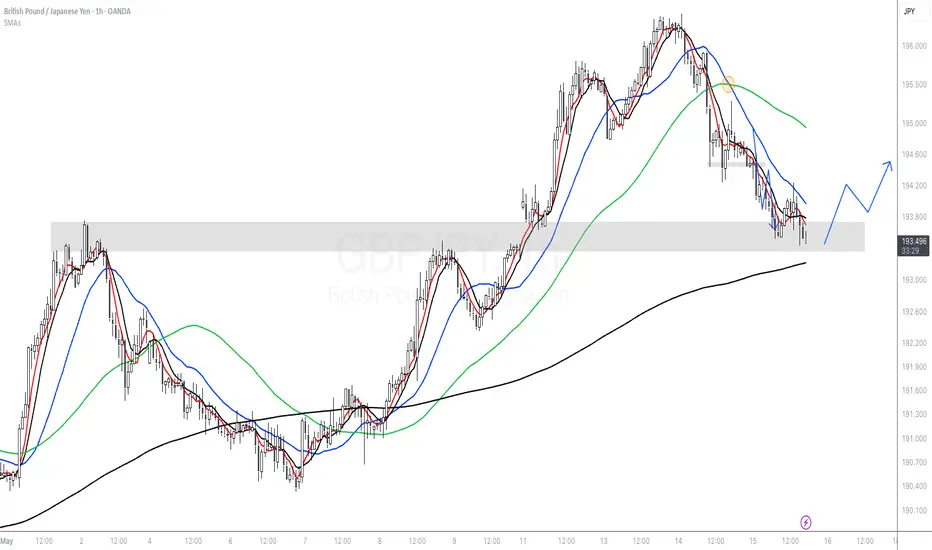
GBPJPY Role Reversal Setup (GBPJPY 1HR)Price has now closed the gap previously set, and is now on a strong level of support on the 1hr chart. I will be watching this level closely for possible reversal signs and a push higher as this may be a longer term plan.
- 1d trend change confirmed
- Support level being tested
- Watch the 15min chart for price action to confirm
- Scalp the entry
Thats the plan.
We may push lower, which would involve breaking current support and retesting for next leg lower.