GBPJPYHello everyone,
Today’s first trade signal comes from GBPJPY. I’ve set three different target levels for this trade. Feel free to close the position at any of these levels depending on your strategy.
🔍 Trade Details:
✔️ Timeframe: 15-Minute
✔️ Risk-to-Reward Ratio: 1:1 / 1:1.50 / 1:2
✔️ Trade Direction: Sell
✔️ Entry Price: 193.987
✔️ Take Profit: 193.602
✔️ Stop Loss: 194.179
🔔 Disclaimer: This is not financial advice. I’m simply sharing a trade I’ve taken based on my personal trading system, strictly for educational and illustrative purposes.
📌 Interested in a systematic, data-driven trading approach?
💡 Follow the page and turn on notifications to stay updated on future trade setups and advanced market insights.
JPYGBP trade ideas

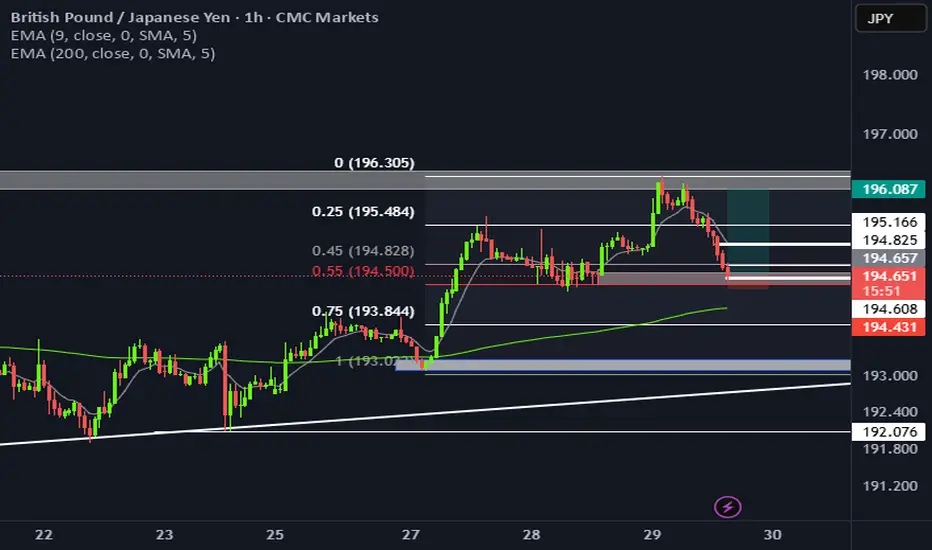
Uptrend Given the price behavior within the Fibonacci levels, a trend change is likely. Then the start of an uptrend is possible.
If the price breaks through the support zone, a continuation of the downtrend is likely.

GBPJPY - Bearish Control, Again!Hello TradingView Family / Fellow Traders. This is Richard, also known as theSignalyst.
📉As per our last GBPJPY analysis (attached on the chart), it rejected the upper red trendline and traded lower.
What's next?
GBPJPY is currently retesting the upper bound of the falling red channel again.
Moreover, the green zone is a strong structure and resistance.
🏹 Thus, the highlighted red circle is a strong area to look for sell setups as it is the intersection of structure and upper red trendline acting as a non-horizontal resistance.
📚 As per my trading style:
As #GBPJPY is around the red circle zone, I will be looking for bearish reversal setups (like a double top pattern, trendline break , and so on...)
📚 Always follow your trading plan regarding entry, risk management, and trade management.
Good luck!
All Strategies Are Good; If Managed Properly!
~Rich
Disclosure: I am part of Trade Nation's Influencer program and receive a monthly fee for using their TradingView charts in my analysis.

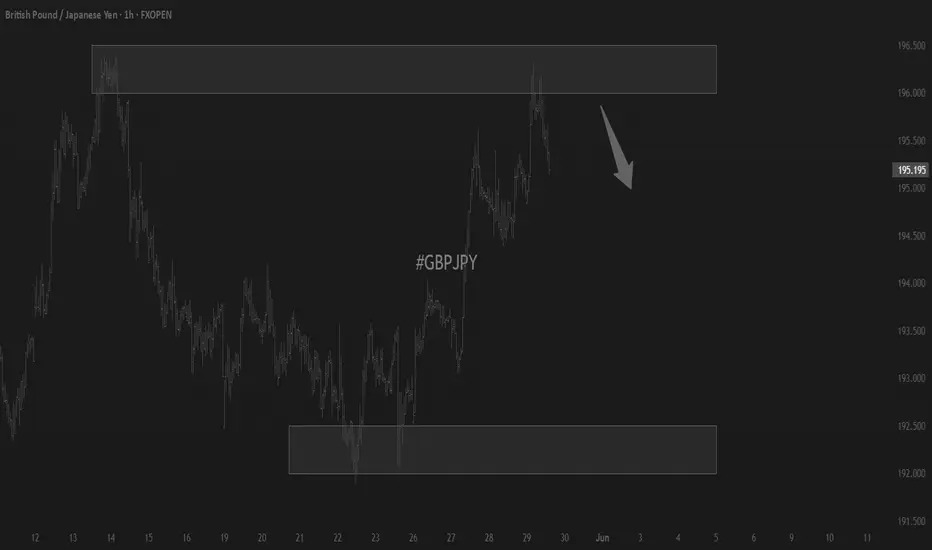
GBPJPY Rejected at Resistance - Bearish Move Ahead?GBPJPY Rejected at Resistance - Bearish Move Ahead?
On the 4-hour chart, GBPJPY tested a strong resistance zone near 196.40, and sellers quickly stepped in.
Over the last 12 hours, the price has moved consistently downward, confirming selling pressure in this area.
The formation of three consecutive red candles on the 4-hour timeframe adds value to the bearish outlook. GBPJPY could decline to 194.20, and possibly even further to 192.40.
⚠️PS: This trade carries high risk due to the uncertain stance of the Bank of Japan (BOJ) policies.
You may find more details in the chart!
Thank you and Good Luck!
❤️PS: Please support with a like or comment if you find this analysis useful for your trading day❤️
Disclosure: I am part of Trade Nation's Influencer program and receive a monthly fee for using their TradingView charts in my analysis.

Gbpjpy long D1 appears to be making an ascending triangle to get back up towards resistance. 1h is looking like a falling wedge. I’m in on this trade and my entry is horrible. I’m looking at a TP of 191.7.

GJ shortI’m short from this level at 195.45. Resistance moved sideways and finally intercepted the main trend line of resistance. Price has been rejecting this level. Final TP as of now is 184.9. With the 3 & 6 month candles closing that may change.

GBPJPY Wave Analysis – 29 May 2025
- GBPJPY reversed from the key resistance level 196.00
- Likely to fall to support level 193.00
GBPJPY currency pair recently reversed down from the key resistance level 196.00 (which has been reversing the price from March) intersecting with the upper daily Bollinger Band.
The downward reversal from this resistance level 196.00 created the daily Japanese candlesticks reversal pattern Shooting Star.
Given the strength of the resistance level 196.00 and the bearish divergence on the daily Stochastic, GBPJPY currency pair can be expected to fall to the next support level 193.00.

GBPJPY Mid TermGJ swept the most recent daily high and turned bearish. Now we just had a retracement back into the original sweep level and price continues with the bearish trends. Expecting more downside until the low 190s or even lower.

Update GBPJPY May 29thAs you can see, price has respected the exact levels I previously mapped out — just as expected.
This chart now shows my long-term outlook, but keep in mind:
I actively trade within this full range.
We are still in the buy zone zone, and I’m expecting a correction.
Unless the key level breaks, price is unlikely to reach the long-term buy zone just yet.
That said, I trade every wave — not just the big ones — adapting to what the market gives.

GBPJPY sell/short 1:5RReason for sell
* Liquidity taken 195.49-195.700
* Expanding flat formed
* Engulfing candle formed
* Complete 5 wave structure,
Entry : 195.497
Stop loss: 196.000
Take Profit: 191.000

GBPJPYLong position
- Hit demand zone for the 1hr mark
- exhausted wicks
- overall bullish trend
- buyers potentially stepping in to break through the upper supply zone
GBPJPY INTRADAY capped at 196.50The GBP/JPY currency pair continues to display a bearish outlook, in line with the prevailing downward trend. Recent price action suggests a corrective pullback, potentially setting up for another move lower if resistance holds.
Key Level: 196.50
This zone, previously a consolidation area, now acts as a significant resistance level.
Bearish Scenario (rejection at 196.50):
A failed test and rejection at 196.50 would likely resume the bearish momentum.
Downside targets include:
194.20 – Initial support
193.00 – Intermediate support
191.90 – Longer-term support level
Bullish Scenario (breakout above 196.50):
A confirmed breakout and daily close above 196.50 would invalidate the bearish setup.
In that case, potential upside resistance levels are:
197.50 – First resistance
198.30 – Further upside target
Conclusion
GBP/JPY remains under bearish pressure, with the 196.50 level acting as a key inflection point. As long as price remains below this level, the bias favors further downside toward the 194.20–191.90 region. However, a sustained break above 196.50 would shift sentiment bullish, targeting 197.50 and beyond. Traders should watch for price confirmation around 196.50 to assess the next move.
This communication is for informational purposes only and should not be viewed as any form of recommendation as to a particular course of action or as investment advice. It is not intended as an offer or solicitation for the purchase or sale of any financial instrument or as an official confirmation of any transaction. Opinions, estimates and assumptions expressed herein are made as of the date of this communication and are subject to change without notice. This communication has been prepared based upon information, including market prices, data and other information, believed to be reliable; however, Trade Nation does not warrant its completeness or accuracy. All market prices and market data contained in or attached to this communication are indicative and subject to change without notice.

Trading balanceTrading balance The price of the asset has rebounded from the balance zone. With the prospect of growth into the resistance zone.
GBP/JPY Elliott Wave Count Warns of Impending Sell-OffThe GBP/JPY pair has just completed a 5-wave downtrend, which ended around early April. Since then, the price has been moving higher in what appears to be a typical A-B-C corrective pattern — a common move that occurs after a major downtrend in Elliott Wave Theory.
We are currently in the final wave (C) of this correction, and within that, it appears that Wave 5 of C is now unfolding. This final wave appears to be nearing its end, and the price is approaching a strong resistance area between 196.813 and 197.513.
T1: 193.735
T2: 192.133
SL: 198.252
❌ Invalidation Level:
If the price closes above 198.252, this Elliott Wave count is likely wrong. That could mean the market is preparing for a bigger rally instead.

GBPJPY BUYHonestly speaking, it wasn't funny for all JPY pairs last week, everybody collect, Hopefully the recovery that we are now seeing on some jpy pairs these week will stands. I shared trade ideas on GBPJPY, currently we are seeing some promising moves from team bullish. lets join the flow.

CHECK GBPJPY SIGNAL READ CAPTAIN( gbpjpy) buy zone
( trade satup )
entry point (194.518) to (194.720) 📊
first tp (195.150)📊
2nd target (195.835) 📊
last target (195.560) 📊
stop loss (194.280)❌

CHECK GBPJPY SIGNAL READ CAPTAIN( gbpjpy) buy zone
( trade satup )
entry point (194.950) to (194.900) 📊
first tp (195.100)📊
2nd target (195.350) 📊
last target (195.550) 📊
stop loss (194.700)❌

gbpjpy sell signal. Don't forget about stop-loss.
Write in the comments all your questions and instruments analysis of which you want to see.
Friends, push the like button, write a comment, and share with your mates - that would be the best THANK YOU.
P.S. I personally will open entry if the price will show it according to my strategy.
Always make your analysis before a trade

GJ-Thu-29/05/25 TDA-Possible buy above 4hR 196.283Analysis done directly on the chart
Follow for more, possible live trades update!
Asian session gave a good push, if you feel
missing out (FOMO). Don't worry, opportunities
will always be there.
Not financial advice, DYOR.
Market Flow Strategy
Mister Y

GBP/JPY 4H Chart Analysis – Bullish Channel Setup📈 Trend:
Price is moving in an ascending channel
🔵 Support line below
🔴 Resistance line above
---
Key Zones & Levels:
📍 Demand Zone (Buy Area):
Between 191.753 – 194.016
Price might bounce here before continuing up
🔵 Likely pullback expected here
🎯 Target Point:
202.500
🚀 If price respects the demand zone, this is the upside target
🟢 Entry Point:
Around 193.964 – 194.016
Optimal buying zone before the projected rise
❌ Stop Loss:
Below 191.700
🛑 Placed to minimize losses if price breaks down
---
Indicators:
📉 EMA (70):
Currently at 192.816
✅ Acting as dynamic support
---
Trade Plan Summary:
🔄 Wait for a retracement into the Demand Zone
🛒 Enter long near 193.964
⛔ Stop loss at 191.700
🎯 Target at 202.500

SELL GBPJPYThe price was creating the highs
After Sb, it did not visit the demand zone.
Now the price is showing the rejection to the up side zone hence creating strong supply
We now looking a drop up to the demand zone.
Let us observe it, if it will be a trade, however trade wisely

BUY GBPJPYAfter a long bearish retracement, JPY pairs seem ripe to continue up. This week started with a strong bullish move across all JPY pairs. A bullish flag has printed here. Buy from here

GBP/JPY – Bullish Flag Breakout Setup | wk-6We're observing a bullish flag pattern forming on the GBP/JPY 1-hour chart — a classic continuation pattern that often signals the resumption of the uptrend after a brief consolidation.
With price coiling tightly and momentum building, we are placing a Buy Stop trade setup just above the flag’s resistance to catch the breakout confirmation.
Trade Setup Details:
Pair: GBP/JPY
Timeframe: 1H
Pattern: Bullish Flag
Trend: Bullish
Entry (Buy Stop): 195.687
Stop Loss (SL): 194.324
Take Profit 1 (TP1): 197.050 (1:1)
Take Profit 2 (TP2): 198.413 (1:2)
Lot Size: 0.12
Risk/Reward Breakdown:
Trade 1: Risk $100 / Reward $100 (1:1)
Trade 2: Risk $100 / Reward $200 (1:2)
Total Risk: $200
Total Potential Reward: $300
✅ Trade Rationale:
✅ Bullish Flag: Classic continuation pattern in a strong uptrend
✅ Breakout Entry: Buy Stop placed above resistance for confirmation
✅ Strong Risk Management: Two trades with calculated R:R ratios
✅ Momentum Aligned: Market conditions favor further upside
🔗 Hashtags:
#GBPJPY #BullishFlag #ForexBreakout #TechnicalAnalysis #ForexTrading #BuyStop #ChartPatterns #BullishContinuation #SmartTrading #RiskReward #TradingSetup #PriceAction #TradingView
