JPYGBP trade ideas

GBPJPYWeekly must take out the Key Level of 180, before major moves in the weekly timeframe.
We have also been in a consolidation since August.
We have no clear direction in the lower timeframes

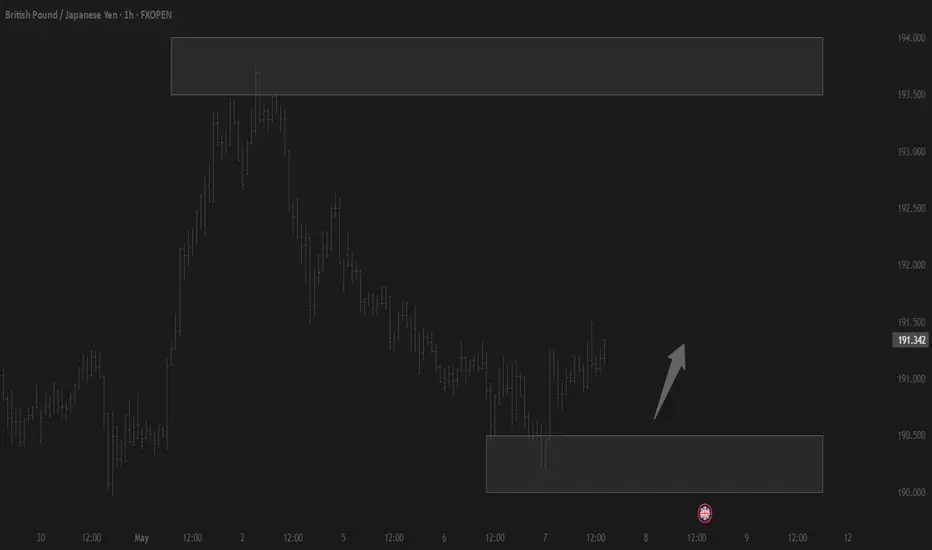
GBP/JPY For Bullishyou can go long now
or
wait for pull-back near by entry point and then go long
general trend is up trend
JPY under Pressure
have fun :)

GBPJPYThe GBPJPY analysis I shared with you a few hours ago has reached its first profit target.
I closed my trades at this level, but those who prefer can hold their positions and aim for the next TP levels.

GBPJPYThere’s a buy opportunity on GBPJPY.
This trade setup has three different target levels: 191.467 / 191.759 / 192.181.
You can choose any of these levels as your Take Profit based on your own trading style.
I personally entered the trade at two different price points: 191.020 and 191.139.
Note that the TP and SL levels for these two entries differ.
You can also consider taking this trade and customize your TP/SL levels using the numbers provided.
🔍 Criteria:
✔️ Timeframe: 15M
✔️ Risk-to-Reward Ratio: 1:2 / 1:3.81 / 1:7
✔️ Trade Direction: Buy
✔️ Entry Price: 191.139
✔️ Take Profit: 191.467
✔️ Stop Loss: 190.976
🔔 Disclaimer: This is not financial advice. It's a trade I’m taking based on my own system, shared purely for educational purposes.
📌 If you're also interested in systematic and data-driven trading strategies:
💡 Don’t forget to follow the page and subscribe to stay updated on future analyses.

GJ 7th May 2025 US SessionHonestly not a big fan of the structure but longs possible if we can hold the 1hr candle as it closes and then have a retest on 15 min as US session opens up.

GBPJPY SHORT TECH OVER FUNDGBPJPY short 1 hours timeframe. Sell as much as you can as we beat the fundamental traders around the world.

Trading balanceTrading balance The price of the asset has rebounded from the balance zone. With the prospect of growth into the resistance zone.
USDJPY and GBPJPY Analysis todayHello traders, this is a complete multiple timeframe analysis of this pair. We see could find significant trading opportunities as per analysis upon price action confirmation we may take this trade. Smash the like button if you find value in this analysis and drop a comment if you have any questions or let me know which pair to cover in my next analysis.

gbpjpy short for a living welcome
here is my gbpjpy short idea
last asia session market wasnt able to stay in sellers control.
now after london open played out and ny is about to start market seems to come again in sellers controll.
im thankful to be part of this and see how this idea plays out.
enjoy.

gbpjpy shortwelcome
here is my gbpjpy short idea
its based on bearish timeframe 4h 1h and 15min
awaiting here the retest of the break to sell out from price 190.75
yellow lines represent 30min candle close at 9.30 oclock (30 min after london open)
market seems to be in bear control
fun to see how this idea will play out, im very thankful to be a part of it, lets goooo.

Selling GBPJPYLooks amazing for sells do trade managemtnt i f you enter. and laoaalso risk mangaemtn..

GBPJPY BUY NOW!!!!!!!GBPJPY took out the buyside liquidity with a retest on a falling wedge also price took out the POC levels and now heading to VAH am in now on buys holding till VAH target is completed.

GJ 7th May 2025 LondonWe're been chopping in a 4hr range for a while.
Preference for shorts but we'll need to break out of the 4hr range for trades to kick in. Ideally break and retest on 1hr for the 4hr areas.

GJ-Wed-7/05/25 TDA-Quick pump and dump on safe haven (YEN)!Analysis done directly on the chart
Key insights that every trader should get good at:
1) Market structure
2) Market positioning
3) Market conditions
Not financial advice, DYOR.
Market Flow Strategy
Mister Y

Going Short On GBPJPYGBPJPY – Liquidity Setup and Short Opportunity
GBPJPY has a consistent behavior of creating liquidity before the London session ("pre-London"), only to retrace and sweep that liquidity during the actual London session before making its true directional move.
This pattern plays out frequently, and we take advantage of it on a daily basis. Typically, price forms inducement zones or liquidity traps just before the session opens — which then get taken out as part of the London open volatility.
Currently, GBPJPY has created such a setup, and based on this recurring behavior, I’m going short, anticipating a liquidity sweep before the pair resumes its broader directional move.
Key Factors:
Pre-London liquidity build-up observed
London session expected to sweep high/lows
Short setup in play based on this repeatable model
Traders familiar with session-based liquidity trading will recognize this as a high-probability setup.

GBPJPY-Trade Plan 07/05/2025Dear Traders,
i expect price will be start Crash from 191.877-192.070 Area to Target 188.000
Trend Still Down , Looking for Sell only
i expect price will be continue upward movement to 3400-3420 Area Today ,
If you enjoyed this forecast, please show your support with a like and comment. Your feedback is what drives me to keep creating valuable content."
Regards,
Alireza

GBPJPY SHORT FORECAST Q2 W19 D7 Y25GBPJPY SHORT FORECAST Q2 W19 D7 Y25
Professional Risk Managers👋
Welcome back to another FRGNT chart update📈
Diving into some Forex setups using predominantly higher time frame order blocks alongside confirmation breaks of structure.
Let’s see what price action is telling us today!
💡Here are some trade confluences📝
✅Weekly order block rejection
✅Daily order block rejection
✅Intraday 15' order blocks
✅Tokyo ranges to be filled
🔑 Remember, to participate in trading comes always with a degree of risk, therefore as professional risk managers it remains vital that we stick to our risk management plan as well as our trading strategies.
📈The rest, we leave to the balance of probabilities.
💡Fail to plan. Plan to fail.
🏆It has always been that simple.
❤️Good luck with your trading journey, I shall see you at the very top.
🎯Trade consistent, FRGNT X

GBPJPY H4 I Bearish Reversal Off 50% FiboBased on the H4 chart, the price is rising our sell entry level at 192.04, a pullback resistance that aligns with the 50% Fibo retracement.
Our take profit is set at 189.73, a pullback support.
The stop loss is set at 194.02, a pullback resistance.
High Risk Investment Warning
Trading Forex/CFDs on margin carries a high level of risk and may not be suitable for all investors. Leverage can work against you.
Stratos Markets Limited (tradu.com):
CFDs are complex instruments and come with a high risk of losing money rapidly due to leverage. 63% of retail investor accounts lose money when trading CFDs with this provider. You should consider whether you understand how CFDs work and whether you can afford to take the high risk of losing your money.
Stratos Europe Ltd (tradu.com):
CFDs are complex instruments and come with a high risk of losing money rapidly due to leverage. 63% of retail investor accounts lose money when trading CFDs with this provider. You should consider whether you understand how CFDs work and whether you can afford to take the high risk of losing your money.
Stratos Global LLC (tradu.com):
Losses can exceed deposits.
Please be advised that the information presented on TradingView is provided to Tradu (‘Company’, ‘we’) by a third-party provider (‘TFA Global Pte Ltd’). Please be reminded that you are solely responsible for the trading decisions on your account. There is a very high degree of risk involved in trading. Any information and/or content is intended entirely for research, educational and informational purposes only and does not constitute investment or consultation advice or investment strategy. The information is not tailored to the investment needs of any specific person and therefore does not involve a consideration of any of the investment objectives, financial situation or needs of any viewer that may receive it. Kindly also note that past performance is not a reliable indicator of future results. Actual results may differ materially from those anticipated in forward-looking or past performance statements. We assume no liability as to the accuracy or completeness of any of the information and/or content provided herein and the Company cannot be held responsible for any omission, mistake nor for any loss or damage including without limitation to any loss of profit which may arise from reliance on any information supplied by TFA Global Pte Ltd.
The speaker(s) is neither an employee, agent nor representative of Tradu and is therefore acting independently. The opinions given are their own, constitute general market commentary, and do not constitute the opinion or advice of Tradu or any form of personal or investment advice. Tradu neither endorses nor guarantees offerings of third-party speakers, nor is Tradu responsible for the content, veracity or opinions of third-party speakers, presenters or participants.

GBPJPY: Structure Is Still BullishAs explained in the video, my bias is still bullish. HHs and LHs are still being formed. So I am looking to buy GJ as long at 189.97 holds as support. Nice breakout and retest of the falling wedge, which has a bullish FVG and bearish breaker block confluence. I am waiting to see how London looks. Remember we have FOMC tomorrow.

Long buddy!!!191.800 is my target area within the next 24hrs
I have had my macD divergence met
My price action met
The pullback area met
And my 2nd macd divergence on the 1hr entry trigger
What are your thoughts?
Trade safely my friend's

GJ Ideasmall idea for this trade, I hate typing when i'm not looking at the charts so this might be easier lol

“GJ | Bullish Playbook in Motion — Waiting for the Draw“30M broke to the upside — same bullish intent showing as UJ. Now it’s all about the setup. Waiting for that IDM/liquidity sweep to the downside before taking action. 5M CHoCH will confirm the move. Let price do the hard work — I’m just the trigger.”
Bless Trading!
