JPYGBP trade ideas

GBPJPY Monday candle closed as bullish engulf..Buyers in controlMonday daily candle closed as bullish engulf hinting that this pair is starting to going up.
Where to enter buy?
Zoom in into smaller timeframe 4hr, 1hr, 15min and wait for the buy price action.
Personally, i would like to see the price to react at "Resistant become Support" zone that i marked in the chart.
No price action in lower TF, no trade.
Good luck.
calculate your own risk & reward.

Possibility of uptrend The price is expected to move in the specified direction and after the completion of the corrective pattern, the start of an uptrend is likely. A break of the support zone will cause the continuation of the downtrend.

GBPJPY BULLISH OR BEARISH DETAILED ANALYSISGBPJPY has successfully broken out of a long-term descending trendline on the 3D timeframe, which had capped price action for months. The breakout is now confirmed with multiple candle closes above the trendline and a retest holding firm around 190.500. This shift in structure signals a major bullish reversal, and I’m now targeting the 199.600 level as the next potential upside objective.
From a fundamental perspective, the British pound is strengthening amid persistent inflationary pressures in the UK, which are keeping the Bank of England firmly in the hawkish camp. With CPI still elevated and wage growth remaining sticky, the BoE has little room to cut rates aggressively anytime soon. In contrast, the Bank of Japan continues to hold a dovish tone with ultra-accommodative monetary policy, offering a wide interest rate differential that favors GBP longs, especially in carry trade setups.
Technically, this setup offers a clean risk-reward profile. The breakout above the descending structure combined with a strong support zone around 190.500 gives this move a solid foundation. We’re seeing momentum build with higher highs and higher lows forming across multiple timeframes. As long as GBPJPY holds above the 190.000 zone, the bullish bias remains valid and the path toward 199.600 looks open and sustainable.
Traders should keep a close eye on short-term pullbacks as potential re-entry zones. With a macro tailwind behind GBP strength and continued JPY weakness, this pair is primed for further upside. I’m riding this bullish wave with a medium-term outlook and adjusting my position based on intraday market behavior.

GBPJPY SELL OPPORTUNITYThis one is one of those far fetched setups that you look at and just hopes it plays out. From the H4 layout the price broke the trend line and retested. From the retest on the H1 chart, price formed a triple top and then broke it, it could be what the smart traders think is a liquidity sweep. So there are no hopes here just lessons.


Trading balanceTrading balance The price of the asset has rebounded from the balance zone. With the prospect of growth into the resistance zone.

Update GBPJPY May 26th, Buy Scalp and Sell SwingRefer to the previous analysis — see how price reacted perfectly from TP1.
I expect price to retest the sell zone, but a break of the blue box is necessary for that scenario to unfold. I also have a take profit level within that area.
Once price enters the zone, I’ll wait for confirmation to sell — or consider placing a sell limit order.
The main target for this short setup is @190.07.

GBPJPYHello everyone,
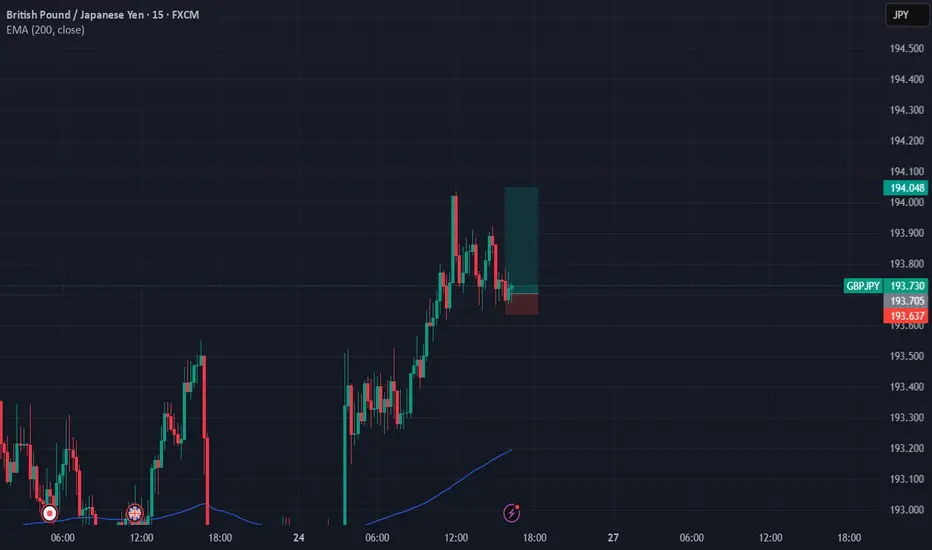
Today’s first trade signal comes from GBPJPY. I’ve set three different target levels for this trade. Feel free to close the position at any of these levels depending on your strategy.
🔍 Trade Details:
✔️ Timeframe: 15-Minute
✔️ Risk-to-Reward Ratio: 1:1 / 1:1.50 / 1:2
✔️ Trade Direction: Sell
✔️ Entry Price: 193.838
✔️ Take Profit: 194.018
✔️ Stop Loss: 193.658
🔔 Disclaimer: This is not financial advice. I’m simply sharing a trade I’ve taken based on my personal trading system, strictly for educational and illustrative purposes.
📌 Interested in a systematic, data-driven trading approach?
💡 Follow the page and turn on notifications to stay updated on future trade setups and advanced market insights.

GBPJPY movement this week. Waiting on either a liquidity grab to the downside or a re-tracement into OTE.
Liquidity grab into 192 area should lead to a drive up towards the OTE at 195.
Drive up towards the OTE should lead to a drive down back towards the liquidity below the equal lows.


GBPJPY BUY IDEATrend - Uptrend
Daily structure - Price action/support maintained and BOS not seen
There's currently an impulsive move, but looking at the price reaching my target, I'm looking for a retracement or break of the incoming resistance and retest for another entry.


GJ-Mon-26/05/25 TDA-Big range, possible scalping buy! Analysis done directly on the chart
Follow for more, possible live trades update!
There are periods when price will push smoothly,
others when price give little pushes and not so
clean. Understanding and reacting to how good
the volume is and price readiness is important to
create a consistent edge in your system.
Not financial advice, DYOR.
Market Flow Strategy
Mister Y

BUY GJ idea Will the market continue to break down or break up and retest the zones plotted for this week


GBPJPY Breaks Higher: Bullish Momentum in PlayGBPJPY Breaks Higher: Bullish Momentum in Play
GBPJPY has broken out of a bullish triangle, signaling potential for further gains.
Yesterday, GBPJPY surged 170 pips in 10 hours, showing strong momentum.
The pair could continue rising towards 193.50 and 194.00 as accumulation seems to have ended.
The breakout is reinforced by strong UK retail sales, which came in at +1.2% vs. +0.2% expected, boosting GBP strength.
You may find more details in the chart!
Thank you and Good Luck!
❤️PS: Please support with a like or comment if you find this analysis useful for your trading day❤️

GBPJPY - Bullish Breakout Likely
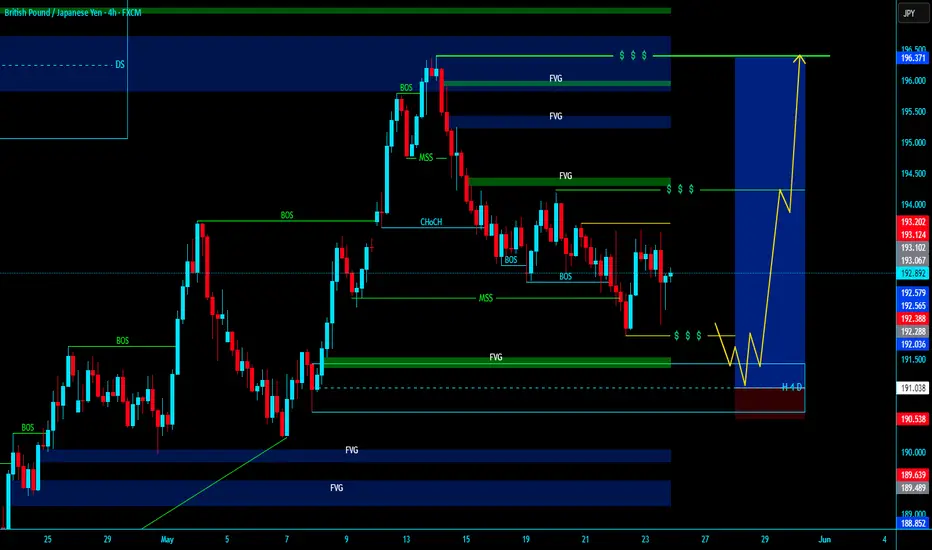
The GBP/JPY 4-hour chart shows a strong bullish trend that propelled the pair from 190.50 support in early May to peaks near 196.50, followed by a healthy consolidation phase around the 192.00-194.00 range. This sideways price action has allowed momentum to reset while maintaining the underlying upward structure, with the pair successfully holding above key support at 192.00. The current positioning near the upper boundary of the consolidation range, combined with signs of renewed buying interest, suggests the correction is nearing completion. The technical setup favors a bullish breakout, with the higher probability scenario pointing toward a resumption of the uptrend targeting the previous high around 196.50 and potentially extending toward the 197.00 resistance zone.
Disclosure: I am part of Trade Nation's Influencer program and receive a monthly fee for using their TradingView charts in my analysis.

GBPJPY daily and 4hr Analaysis GBP/JPY is expected to turn bearish from the 196.096 - 197.372 - 200.781 zone, with a projected drop towards the 186.572 - 179.071 area, where it may find support and potentially reverse into a bullish move. However, there's also a possibility of a continued bearish breakout that could extend the decline further towards the 174.45 level.

GBPJPY CONTINUE TO BULLISH Technically:
GBPJPY broke descending wage.
GBPJPY retest trendline as support
GBPJPY after printing higher high retest 0.70 fib
GBPJPY supporting a bullish trendline

GBPJPY: Weekly overviewThe fake breakout of 12th of May is a sign of more bearish days. However, as traders we should be ready to adapt with new conditions.
We are ready to long from the zone around 189.720.
The indicated levels are determined based on the most reaction points and the assumption of approximately equal distance between the zones.
Some of these points can also be confirmed by the mathematical intervals of Murray.
You can enter with/without confirmation. IF you want to take confirmation you can use LTF analysis, Spike move confirmation, Trend Strength confrimation and ETC.
SL could be placed below the zone or regarding the LTF swings.
TP is the next zone or the nearest moving S&R, which are median and borders of the drawn channels.
*******************************************************************
Role of different zones:
GREEN: Just long trades allowed on them.
RED: Just Short trades allowed on them.
BLUE: both long and short trades allowed on them.
WHITE: No trades allowed on them! just use them as TP points
