Trade Plan: GBP/JPY — 4H AnalysisTrade Plan: GBP/JPY — 4H Analysis
Market Context
Pair: GBP/JPY
Timeframe: 4H
Date: 6th August 2025
Key Observation:
Price attacked weekly sell-side liquidity (PML).
CISD (Closed Inside Swing Demand) formed, showing bullish reaction.
Higher timeframe weekly buyside liquidity (PMH) is intact and a potential long-term target.
Bias: Bullish
Key Levels
PML (Weekly Sell-Side Liquidity): Price tapped into it and reversed.
PMH (Weekly Buyside Liquidity): Near 200.000, long-term target.
Fair Value Gaps (FVGs): Two bearish FVGs (red boxes) are marked as potential reaction zones.
Entry Criteria
Entry Zone: After confirmation of bullish dealing range above CISD.
Trigger: Price breaking above minor resistance (current consolidation zone near 196.143).
Confirmation: Lower timeframe bullish FVG inside context area.
Target
Short-Term Target: 1st FVG (near 197.300–197.700).
Mid-Term Target: 2nd FVG (near 198.200–198.700).
Long-Term Target: PMH near 200.000.
Stop Loss
Below recent swing low formed during liquidity sweep (below 195.000).
Notes
Patience Required: As title suggests, wait for bullish confirmation candle to close before entry.
Risk Management: Target minimum 2R reward before scaling out.
Invalidation: Price closing below CISD and not showing bullish FVG in lower timeframe.
JPYGBP trade ideas

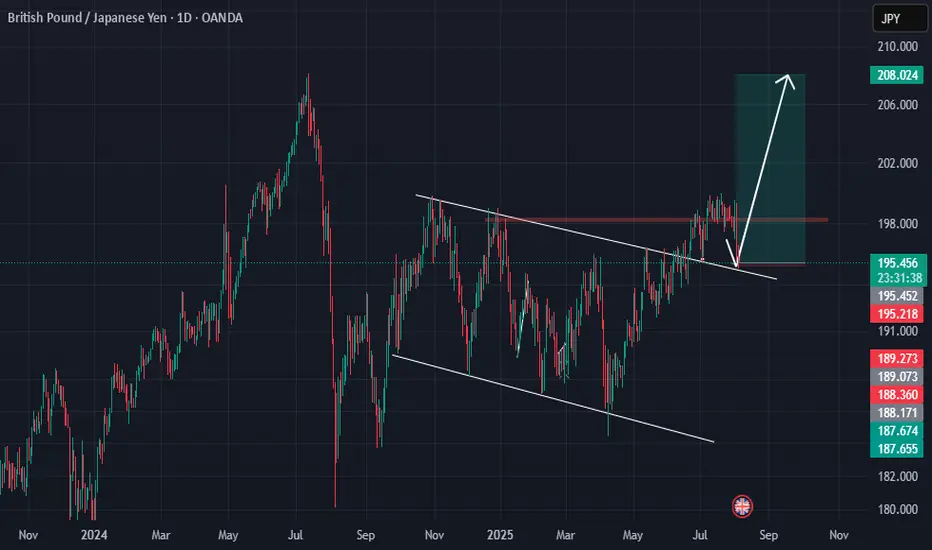
Bullishbuyer are entering the market at a key level as you can see price formed a bullish flag broke out now retesting looking to target the monthly high
GBPJPY Is Very Bearish! Sell!
Please, check our technical outlook for GBPJPY.
Time Frame: 45m
Current Trend: Bearish
Sentiment: Overbought (based on 7-period RSI)
Forecast: Bearish
The market is approaching a significant resistance area 198.994.
Due to the fact that we see a positive bearish reaction from the underlined area, I strongly believe that sellers will manage to push the price all the way down to 198.786 level.
P.S
Overbought describes a period of time where there has been a significant and consistent upward move in price over a period of time without much pullback.
Disclosure: I am part of Trade Nation's Influencer program and receive a monthly fee for using their TradingView charts in my analysis.
Like and subscribe and comment my ideas if you enjoy them!

GBPJPY ShortGBPJPY is now net short on the regression break.
I am considering all JPY pairs as it appears a market correction may build.


Trade Idea – GBPJPYBased on the daily market structure and Elliott Wave count, there’s potential for another bullish push to complete Wave 5.
However, on the H4 timeframe, price may still create one more lower low (LL) before confirming the upward move.
🔔 Wait for confirmation — either a break of structure or a bullish engulfing candle on the H1 timeframe before entering any buy positions.
#GBPJPY #ForexAnalysis #ElliottWave #Wave5Setup #UKTraders #USTraders #SwingTrading #PriceAction #ForexStrategy #H1Confirmation

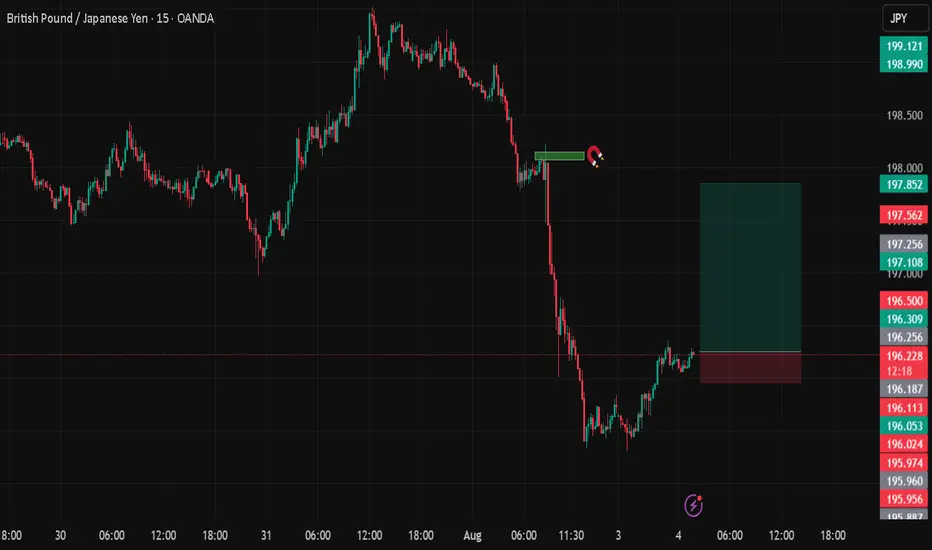
GBPJPYDate:
August 3,2025
Session:
Tokyo Session
Pair:
GBPJPY
Bias:
Long
Fridays New York open left a liquidity pool. I see todays Asia or London session sweeping that area.
Entry:196.254
Stop Loss:195.957
Target:197.847
RR:5.32

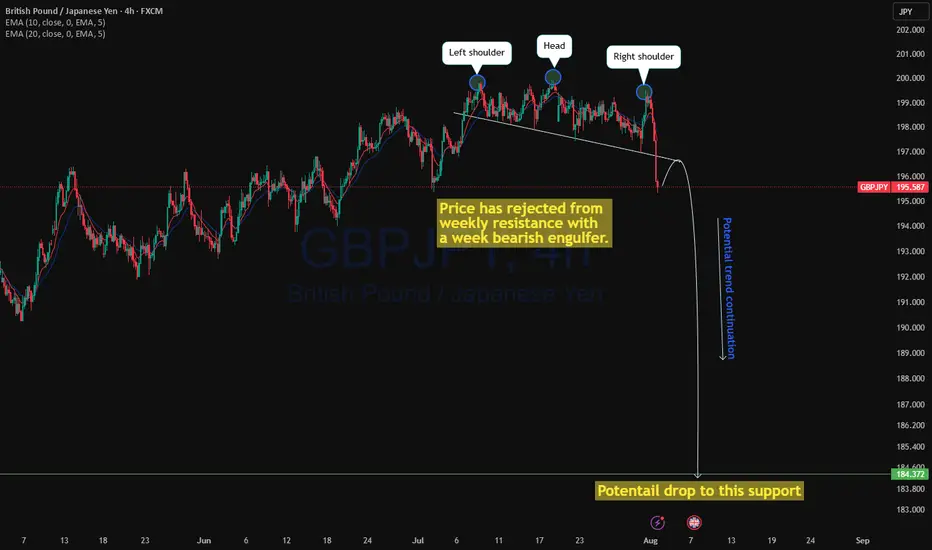
GBPJPY ready to drop?GBPJPY has printed a weekly bearish engulfer with a cross over of a weekly doji and price rejected from a weekly and monthly resistance line. As price is rejecting from a very important monthly and weekly resistance level, it is highly likely price may continue to drop to weekly support level.
As 4H timeframe showing a strong head and shoulder with rejection below, we may see continuation with strong trend.
Upon price action confirmation, a sell trade is high probable.
GBPJPY – Bearish Continuation Setup AheadPair: GBPJPY
Timeframe: 4H
Bias: Bearish
🔍 Technical Overview:
GBPJPY has broken down with high momentum and is now hovering at a 4H support zone (195.30). A clean break and close below this level opens the door for a deeper move toward the next support areas:
Entry Trigger: Break below 195.30
🎯 Target 1: 194.05
🎯 Target 2: 192.50
🛑 Stop Loss: Above 195.95 (previous resistance-turned-supply zone)
📉 RSI: 27.63 (Oversold but momentum-driven selloff suggests more downside)
🧠 Macro + Fundamental Confluence:
🏦 Central Bank Policy:
BOE (Bank of England) cut rates by 25bps (to 4.25%) in a hawkish tone, with internal disagreement (7–2 vote), signaling uncertainty and potential for further divergence.
Despite the “hawkish cut,” the market interpreted it cautiously, especially with falling UK economic momentum and weak retail data.
💴 Bank of Japan:
BoJ is slowly tightening policy — signaling an eventual exit from ultra-loose conditions.
Real interest rates remain negative, but the direction is now incrementally hawkish, strengthening the JPY across the board.
💡 Market Sentiment:
VIX at 20.42 = Risk-Off Environment → capital flows into safe-haven JPY, out of GBP.
With Nasdaq bullish, but volatility ticking up, JPY benefits from its safe-haven role.
📊 CFTC Positioning:
GBP: Longs decreasing, shorts rising, NNCs decreasing → Bearish bias
JPY: Longs flat, but massive drop in NNCs → institutional positioning is turning defensive
🧾 Economic Weakness:
UK Services PMI showing signs of stagnation
CPI and Retail Sales remain weak, suggesting limited scope for further GBP upside
Japan's latest Household Spending and Economy Watchers Survey show stabilizing conditions, supporting yen strength
📌 Final Take:
Fundamentals support the breakdown as monetary divergence and global sentiment drive capital into the JPY. Watch for confirmation via H4 close below 195.30 before entering the trade.
🧭 Trade idea aligns with macro, technicals, seasonality, and institutional flows.

GBPJPY is Holding above the SupportHello Traders
In This Chart GBPJPY HOURLY Forex Forecast By FOREX PLANET
today GBPJPY analysis 👆
🟢This Chart includes_ (GBPJPY market update)
🟢What is The Next Opportunity on GBPJPY Market
🟢how to Enter to the Valid Entry With Assurance Profit
This CHART is For Trader's that Want to Improve Their Technical Analysis Skills and Their Trading By Understanding How To Analyze The Market Using Multiple Timeframes and Understanding The Bigger Picture on the Charts

GBP JPY Another sell opportunityIn my previous analysis, I mentioned that GBP/JPY would turn bearish — and it dropped beautifully, around 280 pips.
Now, a new sell opportunity is setting up, and we can look to enter another short position.

GBPJPY Fundamentally Bearish🧠 Macro-Fundamental Breakdown
🇬🇧 GBP (British Pound)
🔻 GDP Shrinking: UK growth has stalled with below-trend GDP prints 3 quarters in a row.
📉 PMI Weakness: Manufacturing and Services PMIs both under 50 = economic contraction
🧊 Retail Sales Down: UK consumer confidence and demand are cooling
💼 Labor Trouble: Unemployment ticking higher + BoE hinting at peaking rates
🪙 BoE Dovish Pivot?: Market now pricing possible cuts into early 2025.
🇯🇵 JPY (Japanese Yen)
🟢 Inflation is ticking higher
🔄 BoJ is cautiously shifting from ultra-loose policy
🛡️ Yen often strengthens in risk-off environments (which aligns with current market volatility)
🇯🇵 Tokyo CPI surprises have reinforced JPY support

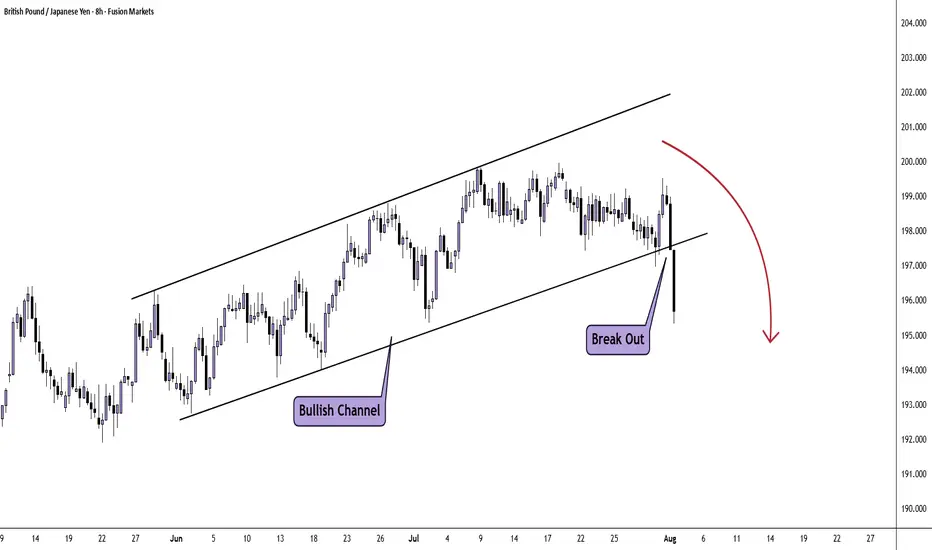
GBP/JPY H8 AnalysisPrice has been bullish since April this year with the most recent price action forming a parallel channel.
On Friday we saw a solid break lower and close below the channel. This could possibly lead to further downside.
Look for a trade that meets your strategy rules.
GBPJPY MADE EASY >> SELL Sell after break of trendline but cautious of pullbacks. With recent YEN strength, downside prevails.

GBPJPY Buydaily cycle, lit cycle. Inducement for london has happened and price should continue upward.

GBPJPY BUYBUY @195.580
SL @195.486
TP @196.050
If it moves above and create a BOS, then close the trade....
And always risk 1%

GBPJPY is in the Down Trend From Resistance LevelHello Traders
In This Chart GBPJPY HOURLY Forex Forecast By FOREX PLANET
today GBPJPY analysis 👆
🟢This Chart includes_ (GBPJPY market update)
🟢What is The Next Opportunity on GBPJPY Market
🟢how to Enter to the Valid Entry With Assurance Profit
This CHART is For Trader's that Want to Improve Their Technical Analysis Skills and Their Trading By Understanding How To Analyze The Market Using Multiple Timeframes and Understanding The Bigger Picture on the Charts

SELL BIAS ON GBPJPYWith price potentially making a shift from buyside to sell side. There will be lots of sell sentiments this week.

Today’s Opportunity: Stay Sharp on GBPJPY!Hey friends,
Here's my latest analysis on GBPJPY.
📌 Buy Entry Zone: 197.590 - 197.336
🎯 Target Level: 198.642
📅 Today, major economic data will be released from the U.S.
Make sure to factor this into your fundamental analysis.
📊 It’s not just about the charts—fundamentals matter too.
Technical + Fundamental = Powerful outcomes ✅
💬 Every like and bit of support keeps me going.
Thanks so much to everyone backing this journey! 🙌

GBPJPY pullback for another bullish moveDaily candle closed with strong bullish.
A healthy pullback observed during Asian session.
I'm waiting at marking area for buy entry.
Calculate your own risk & reward.
Good Luck

sell GBPJPYprice rejected the supply with pressure, i think the supply is increasing and buyers have lost momentum.
