GJ looking sexy - My word i have been waiting! Ok so we have a beautiful set up here with strong GBP news so lets see if we can break those highs this week
JPYGBP trade ideas

GBPJPY- Sell below 192.85 (for min 50 pips target)The GBP/JPY pair is trading below 55 and above 200 EMA (Short-term) and 365 EMA (long term on the 4-hour chart, confirming a bearish trend. Immediate resistance is at 194,a breach above this level targets of 194.70/195/196.50. Any breach below 192.85 confirms the intraday bearish trend. A dip to 192.35/191.70.
Market Indicators (1- hour)
CCI (50)- Bearish
Directional movement index - Bearish
It Is good to sell below 192.85 with SL around 193.30 for a TP of 191.70.

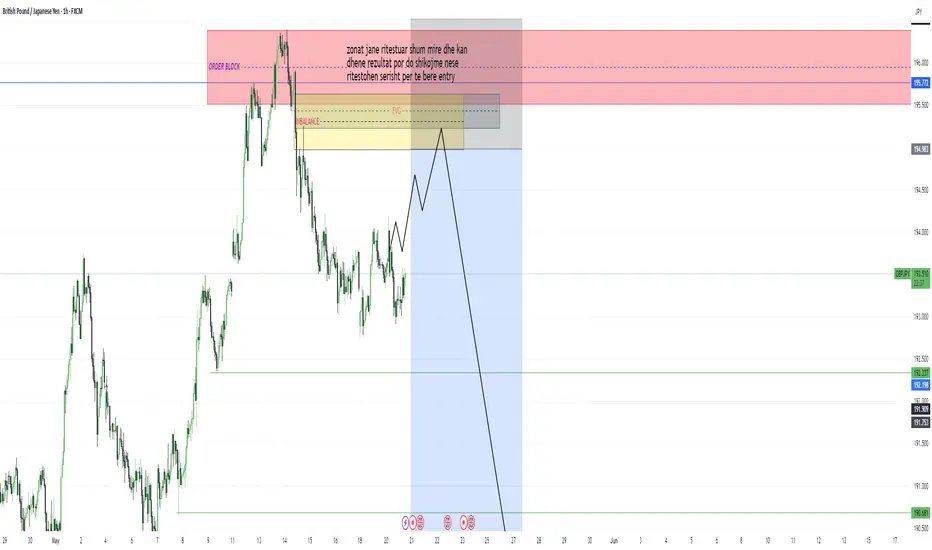
GBPJPY Trap & Reversal | Smart Money Loading from OB Zone!We’re analyzing a high-probability bullish reversal setup forming on GBPJPY 1H, built on clean SMC logic. Here’s how this trade is setting up:
🔄 Market Structure:
Prior bearish move into a reversal area
Equal highs (liquidity built up)
Clean sweep below short-term lows ➝ Liquidity grab ✅
Price now reacting from a defined Order Block zone
🧱 Order Block Zone:
Purple OB zone marked at 192.753–192.118
This zone is resting between 61.8% and 70.50% fib levels – high confluence 🔥
💸 Liquidity Levels in Play:
Sell-side liquidity already swept
Buy-side liquidity sitting above the recent highs @ 196.413 (target zone)
🚀 Entry Plan:
Entry Point: Reacting from OB near 192.753
Stop Loss: Below the strong low (192.118)
TP Zone: 196.413 = Buy side liquidity ➝ Weak High marked for potential sweep
🧮 RRR (Risk-to-Reward):
Massive potential ➝ Approx 1:8+ RRR
This is the kind of setup institutions dream of. 🚀
📈 Key Confluences:
Equal highs = liquidity magnet
OB sitting at golden zone
Strong low protecting entry
Institutional pattern: Sweep ➝ OB reaction ➝ expansion
📉 Watch for Pullback/Entry Reconfirmation:
Price may tap deeper into the OB before expanding
Wait for bullish momentum confirmation (CHoCH on 15M or 30M TF = better entry sniper style)
📢 Pro Tip (Trader Mindset):
This setup screams “liquidity engineering”. Retail traders shorted the lower high; Smart Money is about to flip the script. Be the shark, not the fish 🦈

possibility of correctionIf a trend change occurs in the current support zone, the start of an upward trend to the specified resistance levels is possible.
Otherwise, the continuation of the downward trend to the specified support levels is possible.

GJ-Wed-21/05/25 TDA-Still consolidation GJ!Analysis done directly on the chart
Follow for more, possible live trades update!
I have two pairs to monitor. (GU and GJ)
It helps me focus on scalping better
If one is consolidating, I can opt for
the other one to trade cleaner price action
And you how many pairs do you trade?
Comment down below!
Not financial advice, DYOR.
Market Flow Strategy
Mister Y

GBP/JPY – Bullish structure forming. Waiting for confirmationGBP/JPY – 15 min chart
After a prolonged corrective move, price action is beginning to show signs of structural recovery. We’re now seeing a shift in momentum as higher lows start to form, suggesting potential for a bullish continuation.
The market is currently stabilizing above a local support zone, following a strong bullish impulse. Should price pull back slightly — especially around the 193.500 area — and hold, it may provide a springboard for a move toward the next key resistance near 195.500.
This area stands out not only as a previous structural level but also as a likely liquidity pocket. A clean break above could open the path toward the 196.750 region, aligning with higher timeframe levels (weekly/monthly).

NEXT MOVE FOR GBPJPY"Is GBPJPY gearing up for a potential downtrend? Price action appears increasingly hesitant to push higher, suggesting buyer exhaustion at current levels. If this reluctance persists and key support zones begin to break, we could be looking at the early signs of a shift toward bearish momentum. A confirmed lower high followed by a break of structure could set the tone for a potential downward leg."

GBPJPYGBP/JPY Interest Rate Differential and Bond Yield Overview (May 2025)
Interest Rate Differential
Bank of England (BoE):
Current policy rate around 4.25%, with markets pricing in potential gradual rate cuts later in 2025 but with caution from BoE officials about premature easing.
Inflation remains somewhat sticky, and the BoE may keep rates higher for longer, limiting GBP downside.
Bank of Japan (BoJ):
Policy rate at 0.50%, the highest in 17 years, with a gradual tightening path expected.
BoJ remains cautious but signals further hikes as inflation and wage growth support normalization.
Japan’s economy contracted by 0.2% QoQ and 0.7% YoY in Q1 2025, but BoJ’s hawkish tilt supports JPY strength.
Differential:
The interest rate gap favors GBP by roughly 3.75–4.00%, but narrowing as BoJ tightens policy.
This differential has historically supported GBP/JPY strength, but recent BoJ hawkishness has limited GBP gains.
Bond Yield Dynamics
UK 10-Year Gilt Yield:
Around 4.44% in April 2025, volatile due to fiscal uncertainties and global bond market swings.
Yield movements influenced by BoE’s slow easing and UK’s fiscal outlook.
Japanese Government Bond (JGB) 10-Year Yield:
Approximately 1.32% as of April 2025, up from previous lows but still low relative to UK yields.
BoJ’s cautious policy normalization and reduced bond purchases have pushed yields higher.
Yield Spread:
The spread between UK Gilts and JGBs remains wide (~3.1%), supporting GBP/JPY’s carry trade appeal but with some compression due to BoJ tightening.
Market and Technical Outlook
GBP/JPY weakened to around 193.40 recently amid Japan’s Q1 GDP contraction but rebounded near 193.50 as BoE officials warned against aggressive rate cuts.
BoJ’s hawkish signals and Japan’s economic contraction have strengthened JPY, creating headwinds for GBP/JPY.
Market expectations of BoE’s slower rate cuts and BoJ’s gradual hikes create a complex dynamic, limiting GBP/JPY upside.
Divergent monetary policies continue to drive volatility, with the pair sensitive to shifts in BoE and BoJ guidance.
Summary Table
Factor GBP Impact JPY Impact GBP/JPY Bias
BoE Rate (4.25%, cautious) Supports GBP, limits losses – Mildly bullish
BoJ Rate (0.50%, tightening) – Strengthens JPY Bearish pressure on GBP/JPY
UK 10-Year Gilt Yield (~4.44%) Supports GBP carry – Bullish
JGB 10-Year Yield (~1.32%) – Supports JPY yield advantage Bearish pressure
Japan Q1 GDP contraction Weakens GBP/JPY Strengthens JPY Bearish
Conclusion
GBP/JPY is influenced by a still favorable but narrowing interest rate differential, with BoE’s cautious stance on rate cuts supporting GBP, while BoJ’s gradual tightening and Japan’s economic contraction bolster the yen. The bond yield spread remains supportive of GBP/JPY but is compressing. Near term, the pair faces resistance around 193.50, with downside risks if JPY safe-haven demand intensifies or BoE signals faster easing. Traders should watch BoE and BoJ policy updates closely for directional cues.

GBPJPY BULLISHI believe we are getting prepare for a push back after a fast pull back from last week. the idea is to take short position going up or add other position while going on minimizing the risk from the previous position.

GBPJPY Bullish Trend - Bull Flag Pending a BreakoutPrice is currently respecting an H4 demand zone. A breakout and retest of the bull flag will be a strong buy confirmation.

GBPJPY fake out has given momentum to drop?GBPJPY has just got rejected with 4h bullish candle with more than 1.5ATR to the key level giving probability to drop to next area of support. As the price has done this fake move, we may see possible drop to daily support and may continue to drop to possible 80 pip.
As the price has got rejected from a monthly high, we may see further downside
A sell trade is high probable!

GBP / JPY SHORTWAITING FOR A BOS ON LOWER TIME FRAME BEFORE ENTERING
📉 GBP/JPY 1H Short Trade Summary
Bias: Bearish
Entry Type: Supply rejection after internal structure shift (CHoCH & BOS)
🧠 Trade Narrative:
Price broke down from a previous bullish structure, forming a clear CHoCH followed by a BOS, confirming a bearish shift. A premium pullback into a 1H supply zone aligned with a Fair Value Gap (FVG), offering an ideal entry point.
🔹 Entry:
Short taken from the 1H supply/FVG zone rejection (gray and blue zone).
🔹 Confluences:
Internal BOS + CHoCH
Entry within premium zone of range
Rejection from supply + 1H FVG
Bearish market structure
Liquidity sweep before entry
🎯 Targets:
TP1: Mid-range (0.5) and FVG fill — first partial
TP2: Full range discount (0) for full take profit
🛑 Stop Loss:
Above the supply zone, protecting against a structural invalidation

GBPJPY Break and retest of the previous upward structure, it's an opportunity to scale in if you followed last week's trade idea or enter if not on the trade already

Lingrid | GBPJPY possible Channel BREAK Bearish MoveThe price perfectly fulfilled my last idea . FX:GBPJPY is consolidating after a strong rally toward the March high. Price is now testing support near 193.8, where the ascending trendline and prior breakout zone converge. A failure to hold this level may open the door for a drop toward 191.000. However, bulls remain in control while price stays above trend support.
📈 Key Levels
Buy zone: 193.0 – 193.8
Buy trigger: bounce from trendline with bullish momentum
Target: 196.3
Sell trigger: break below 193.0
💡 Risks
Weak UK data may trigger bearish sentiment.
Yen strength due to safe-haven flows could pressure GBPJPY.
Break of trendline may lead to deeper correction below 191.
Traders, if you liked this idea or if you have your own opinion about it, write in the comments. I will be glad 👩💻

A SHORT SHORT B4 LONG LONG GBPJPY SHORT FORECAST Q2 W21 D20 Y25 A SHORT SHORT B4 LONG LONG LONG
GBPJPY SHORT FORECAST Q2 W21 D20 Y25
Professional Risk Managers👋
Welcome back to another FRGNT chart update📈
Diving into some Forex setups using predominantly higher time frame order blocks alongside confirmation breaks of structure.
Let’s see what price action is telling us today!
💡Here are some trade confluences📝
✅Weekly order block rejection
✅Daily order block rejection
✅Intraday 15' order blocks
✅Tokyo ranges to be filled
🔑 Remember, to participate in trading comes always with a degree of risk, therefore as professional risk managers it remains vital that we stick to our risk management plan as well as our trading strategies.
📈The rest, we leave to the balance of probabilities.
💡Fail to plan. Plan to fail.
🏆It has always been that simple.
❤️Good luck with your trading journey, I shall see you at the very top.
🎯Trade consistent, FRGNT X

GJ-Tue-20/05/25 TDA-Uncertainty ahead of GBP CPI!Analysis done directly on the chart
Follow for more, possible live trades update!
Knowledge per se won't make you money, it is
applying the knowledge and in this case in trading
doing live trades will help you to possibly make money.
Not financial advice, DYOR.
Market Flow Strategy
Mister Y

GJ| gearing up for the smackdown.Entry loading..... don't blink.
Price dancing near the zone.... just waiting on that tap so we can rip through 30M highs. Precision only.
Bless Trading!

GBP/JPY 1H Chart Analysis – Bullish Breakout PotentialPublished on May 20, 2025, this 1-hour GBP/JPY chart highlights a key technical setup. The price has been consolidating within a tight range after a sharp decline, forming a potential accumulation zone between 193.47 and 193.80 (yellow rectangle). Multiple tests of the "BOS" (Break of Structure) levels indicate strong support and resistance zones, with a recent "CHOCH" (Change of Character) signaling a shift in momentum.
The price is now approaching a critical resistance at 193.80. A breakout above this level could confirm a bullish trend, potentially targeting 195.00 and beyond (blue arrow). Traders should watch for a strong close above 193.80 with increased volume to validate the breakout. Conversely, a rejection at this level may lead to a retest of the lower support at 193.47.
Key Levels:
Support: 193.47
Resistance: 193.80
Potential Target: 195.00+
Stay cautious of false breakouts and monitor price action closely! #GBPJPY #Forex

GBPJPY Rising Wedge Bearish Reversal Pattern with Trade PlanGBPJPY Rising Wedge Bearish Reversal Pattern with Trade Plan

GBP/JPY Long to 195gbpjpy long to 195 area. keep on watch
💡 Key Considerations Before Going Long GBP/JPY
Factor Impact on GBP/JPY Long Trade
BoE hawkish stance Bullish for GBP (supports long)
BoJ dovish policy Bearish for JPY (supports long)
Strong UK data Bullish for GBP (supports long)
Risk-on sentiment Traders move out of JPY into riskier assets
Geopolitical events Could boost JPY if risk-off sentiment dominates

GBP/JPY) bullish trend analysis Read The ChaptianSMC trading point update
Technical analysis setup for the GBP/JPY pair on a 4-hour timeframe. Here's the breakdown of the trading idea:
---
Key Concepts Highlighted:
1. Support Trend Level (Yellow Zone):
The yellow zone marks a strong confluence area:
Horizontal support from previous price reactions.
Trendline support that has held multiple times.
Close to the 200 EMA (at 191.833), which acts as dynamic support.
2. Bullish Reversal Pattern:
The chart shows a rounded bottom/cup-like structure forming at support—often a sign of accumulation before a reversal.
Price is expected to bounce from this support zone and move higher within the ascending channel.
3. Target Point Projection:
The projected move is around 515.8 pips, targeting the 197.949 level.
This target aligns with the upper boundary of the ascending trend channel.
4. RSI (Relative Strength Index):
RSI is around 43–44, near oversold territory, suggesting potential bullish momentum if a bounce occurs.
Mr SMC Trading point
Conclusion:
This setup suggests a potential long (buy) opportunity:
Entry near the 193.0–193.5 zone (support/trendline confluence).
Stop loss likely below the 200 EMA (~191.5 area).
Target arounSMC trading point update
Technical analysis setup for the GBP/JPY pair on a 4-hour timeframe. Here's the breakdown of the trading idea:
---
Key Concepts Highlighted:
1. Support Trend Level (Yellow Zone):
The yellow zone marks a strong confluence area:
Horizontal support from previous price reactions.
Trendline support that has held multiple times.
Close to the 200 EMA (at 191.833), which acts as dynamic support.
2. Bullish Reversal Pattern:
The chart shows a rounded bottom/cup-like structure forming at support—often a sign of accumulation before a reversal.
Price is expected to bounce from this support zone and move higher within the ascending channel.
3. Target Point Projection:
The projected move is around 515.8 pips, targeting the 197.949 level.
This target aligns with the upper boundary of the ascending trend channel.
4. RSI (Relative Strength Index):
RSI is around 43–44, near oversold territory, suggesting potential bullish momentum if a bounce occurs.
Mr SMC Trading point
Conclusion:
This setup suggests a potential long (buy) opportunity:
Entry near the 193.0–193.5 zone (support/trendline confluence).
Stop loss likely below the 200 EMA (~191.5 area).
Target around 197.95, offering a good risk/reward ratio.
The idea is based on trend continuation, a bounce from confluence support, and RSI support for bullish reversal.
Pales support boost 🚀 analysis follow )

Gbp/Jpy Intra-day Analysis 19-May-2025Price action on GBP/JPY has shown upward momentum after reaching the 193 level and failing to break below it.
Possible scenarios include:
• A retest of the 193.6 area, where failure to close below this level could suggest continued bullish pressure. In such a case, attention may shift toward the 194.7 region as a potential level of interest. Sustained momentum could see the pair approach the 196 area, though a move back toward 193.6 remains possible if upward pressure fades
• Around 196, price behavior could become more reactive. This area may attract interest from market participants watching for signs of reversal, particularly if technical patterns suggest a slowdown in upward momentum. Should that occur, a move toward 194.8 may come into focus.
Disclaimer: easyMarkets Account on TradingView allows you to combine easyMarkets industry leading conditions, regulated trading and tight fixed spreads with TradingView's powerful social network for traders, advanced charting and analytics. Access no slippage on limit orders, tight fixed spreads, negative balance protection, no hidden fees or commission, and seamless integration.
Any opinions, news, research, analyses, prices, other information, or links to third-party sites contained on this website are provided on an "as-is" basis, are intended only to be informative, is not an advice nor a recommendation, nor research, or a record of our trading prices, or an offer of, or solicitation for a transaction in any financial instrument and thus should not be treated as such. The information provided does not involve any specific investment objectives, financial situation and needs of any specific person who may receive it. Please be aware, that past performance is not a reliable indicator of future performance and/or results. Past Performance or Forward-looking scenarios based upon the reasonable beliefs of the third-party provider are not a guarantee of future performance. Actual results may differ materially from those anticipated in forward-looking or past performance statements. easyMarkets makes no representation or warranty and assumes no liability as to the accuracy or completeness of the information provided, nor any loss arising from any investment based on a recommendation, forecast or any information supplied by any third-party.
