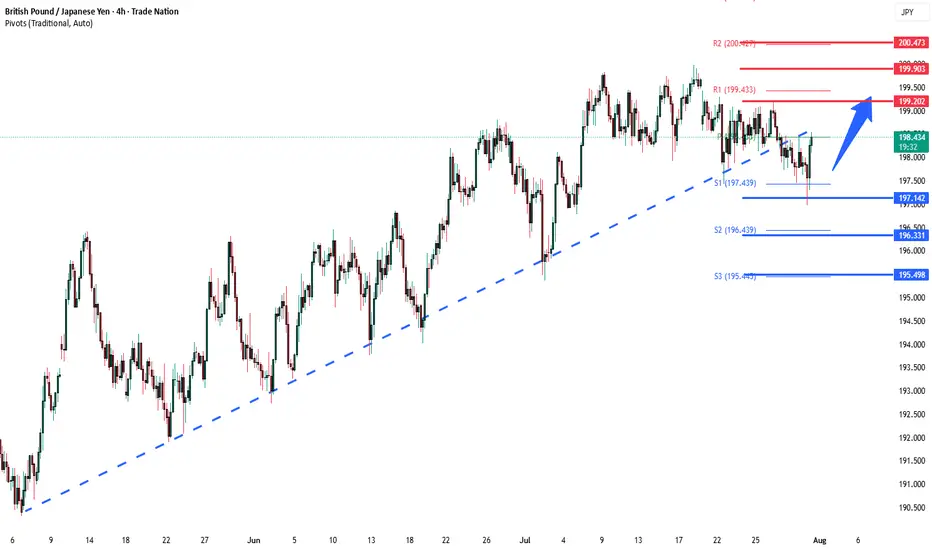
GBPJPY key support at 197.75Key Support: 196.75
This level marks the prior consolidation zone and serves as a critical pivot. A corrective pullback toward 196.75 followed by a bullish reversal would validate the uptrend, with upside targets at:
199.20 – Initial resistance and short-term target
199.70 – Minor resistance zone
200.40 – Longer-term breakout objective
However, a daily close below 196.75 would invalidate the bullish scenario, potentially triggering a deeper retracement toward:
195.80 – Near-term support
194.80 – Key downside level in a bearish reversal
Conclusion:
As long as 196.75 holds, the bias remains bullish, favoring continuation toward the 199–200 zone. A confirmed break below this support would shift momentum, opening the door for a broader corrective decline.
This communication is for informational purposes only and should not be viewed as any form of recommendation as to a particular course of action or as investment advice. It is not intended as an offer or solicitation for the purchase or sale of any financial instrument or as an official confirmation of any transaction. Opinions, estimates and assumptions expressed herein are made as of the date of this communication and are subject to change without notice. This communication has been prepared based upon information, including market prices, data and other information, believed to be reliable; however, Trade Nation does not warrant its completeness or accuracy. All market prices and market data contained in or attached to this communication are indicative and subject to change without notice.
JPYGBP trade ideas
GBPJPY starts corrective downtrend. Ready to SELL✏️ OANDA:GBPJPY has broken the trendline structure and broken the disputed zone. Price is heading towards the support zone ahead around 197.000. This is considered a breakout zone for DCA rather than BUYing at this zone. The downtrend of GBPJPY may extend to the bottom of last week.
📉 Key Levels
SELL now GBPJPY 198.000
SELL trigger: Break support zone 197.000
Target 195.500
Leave your comments on the idea. I am happy to read your views.

GBPJPY: Bearish Market StructureLook to sell after the correction...
(H4)
✅ Confirmed BOS below 197.20
✅ LHs
✅ Supply Zone: 196.10 – 196.60
(H1)
✅ Nice impulse down from 197.30 to 195.50
✅ Short-Term Supply Zone: 195.90 – 196.20 (H1 OB inside H4)
Looking for price to tap this zone and form a new LH
(M15)
✅ Price consolidating after the drop
✅ No bullish BOS
✅ New LH
Expecting liquidity sweep above 195.90, then bearish BOS below 195.70 to confirm entry
❌ Invalidation: Bullish BOS above 196.70 on M15.

GBPJPY LONG OPPORTUNITYPrice has returned to a higher time frame demand zone after a clear pullback (retracement) and is now showing signs of rejection, where it has now mitigated previous unfilled buy orders. We’re seeing early signs of bullish intent and anticipate a continuation to the upside as demand takes control.
🔍 Detailed Breakdown:
1. Demand Zone:
• Price recently retraced back into this zone, completing a full mitigation.
• A clear reaction followed, indicating institutional orders may have been filled.
2. Market Structure:
• Previous structure broke to the upside (BOS) confirming shift in intent.
• We anticipate a higher low formation followed by a new higher high, respecting bullish structure.
3. Liquidity Sweep:
• Sell-side liquidity resting below the recent low has been swept before the bullish move began.
• This aligns with institutional behavior: taking out early sellers before raising price.
4. Entry Logic:
• Waiting for a minor retracement or lower timeframe BOS for refined entry.

GBpJpY RETRACEMENT This is a possible retracement
Use a reasonable lot size
Risk only what you can afford
I wish you success

GBPJPY: Important Demand Zone 🇬🇧🇯🇵
GBPJPY is trading within an important demand zone that
is based on a rising trend line and a horizontal support.
We see a false violation of that and a bear trap, followed
by a bullish imbalance candle.
I think that the pair may go up and reach at least 198.08 level.
❤️Please, support my work with like, thank you!❤️
I am part of Trade Nation's Influencer program and receive a monthly fee for using their TradingView charts in my analysis.

GBPJPY; 600+ PIPS Possible Selling Opportunity GBPJPY has failed to breakthrough 200 price region, suggesting a strong sellers hold. Price behaviour and volume show the same thing. Our target is at 191 which will be a 600 to 700 pips move.
Good luck and trade safe

GBP-JPY Risky Long! Buy!
Hello,Traders!
GBP-JPY collapsed on Friday
And the pair's final move
Was absorbed by the horizontal
Support of 195.400 so as the
Pair is oversold we will be
Expecting a local rebound
And a correction on Monday
Buy!
Comment and subscribe to help us grow!
Check out other forecasts below too!
Disclosure: I am part of Trade Nation's Influencer program and receive a monthly fee for using their TradingView charts in my analysis.

GBPJPY Will Fall!
HI,Traders !
#GBPJPY has retested a
Horizontal resistance level
Of 198.903 so we are
Locally bearish biased
And from the resistance we
We will be expecting a
Local bearish correction !
Comment and subscribe to help us grow !

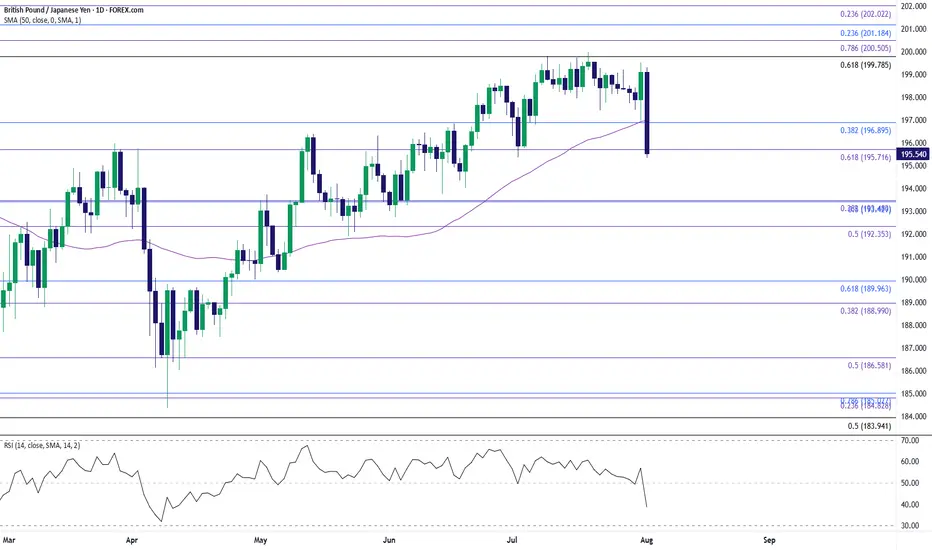
GBP/JPY Clears July LowGBP/JPY clears the July low (195.37) as it tumbles to a fresh weekly low (195.34), and a close below the 195.70 (61.8% Fibonacci extension) to 196.60 (23.6% Fibonacci extension) region may push the exchange rate toward the June low (192.73).
Failure to hold above the 192.40 (50% Fibonacci extension) to 193.50 (38.2% Fibonacci extension) zone may lead to a test of the May low (190.33), but the selloff in GBP/JPY may turn out to be temporary if it defends the rebound from the June low (192.73).
GBP/JPY may attempt to retrace the decline from the July high (199.98) should it hold/close above the 195.70 (61.8% Fibonacci extension) to 196.60 (23.6% Fibonacci extension) region, with a close above the 199.80 (61.8% Fibonacci retracement) to 200.50 (78.6% Fibonacci extension) region opening up 201.20 (23.6% Fibonacci retracement).
--- Written by David Song, Senior Strategist at FOREX.com
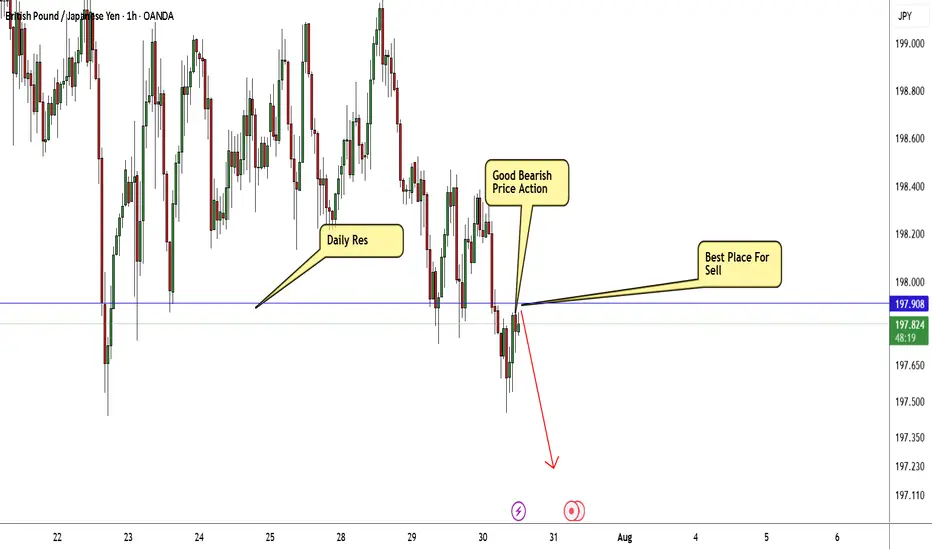
GBP/JPY Breakout Done , Short Setup Valid To Get 150 Pips !Here is my 1H Chart on GBP/JPY , We Have A Daily closure below my old support and new res and we have a very good bearish Price Action on 1And 2 Hours T.F , So i see it`s a good chance to sell this pair and targeting 100 to 150 pips . and if we have a daily closure again above my new res then this idea will not be valid anymore .
GBPJPY SellExternal structure is now bearish and the internal structure did a liquidity grab. Price should continue lower and go towards asia low to complete daily cycle.

GBPJPY holds momentum, waiting for the final pushThe GBPJPY pair is moving sideways between 197.400 and 199.000, while maintaining its position inside the ascending price channel. Each pullback is quickly absorbed near the lower support, indicating that buying pressure is quietly building.
💡 Bullish factors supporting the trend:
– UK Services PMI beats expectations, strengthening economic outlook.
– BOJ maintains negative interest rates, weakening the JPY.
– Risk-on sentiment drives capital back into the GBP.
🎯 Suggested strategy:
Buy near 197.400 or on a breakout above 199.000.
Target: 201.500 | Stop-loss: below 196.800.

GBPJPY: Pullback From Resistance 🇬🇧🇯🇵
I think that GBPJPY will pull back from a wide
intraday supply area.
As a confirmation, I see a bearish imbalance candle that
is formed after its test.
Goal - 198.51
❤️Please, support my work with like, thank you!❤️
I am part of Trade Nation's Influencer program and receive a monthly fee for using their TradingView charts in my analysis.

GBPJPY – Losing control zone, downtrend taking shapeGBPJPY is still trading within a long-term ascending price channel. However, what’s concerning is that recent price action has broken out of the previously established price box – which had acted as a stabilizing structure for the uptrend. Buyers failed to maintain momentum, repeatedly getting rejected at the top of the box.
Currently, GBPJPY is showing signs of breaking below the short-term support inside the price box, raising the risk of a deeper correction toward the lower boundary of the channel. A “lower high” structure is clearly forming, confirming that selling pressure is taking over.
From a news perspective, the Japanese yen is gaining strength as risk-off sentiment increases, while the pound is losing ground due to cautious tones from the Bank of England following a string of weak economic data. This shift is weakening GBP's appeal and could accelerate the bearish trend.
Strategy:
Wait to SELL if price pulls back to the former resistance zone within the price box and shows rejection signals. The downtrend will be confirmed if the recent low is broken. Stay out if there’s no clear confirmation.
What do you think will happen next with GBPJPY?


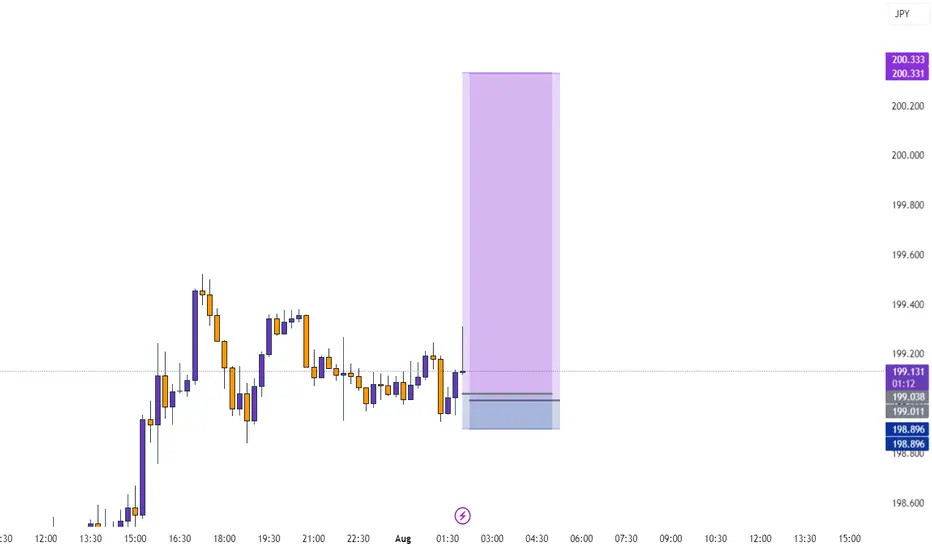
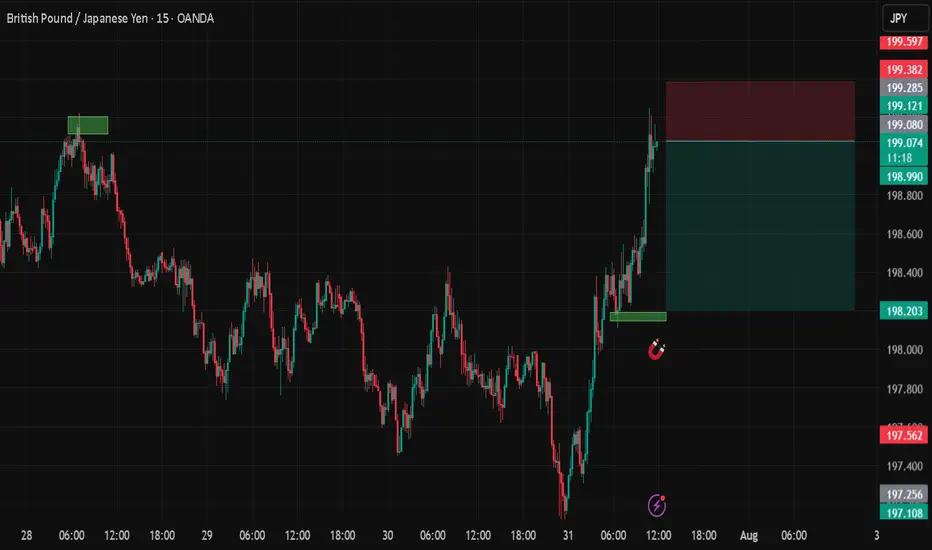
GBPJPYDate:
July 31,2025
Session:
New York Session
Pair:
GBPJPY
Bias:
Long
Liquidity from Monday's London session was swept in today's (Thursday) New York and London Session. Now I see price following the trend downward.
Entry: 199.080
Stop Loss: 199.387
Target: 198.207
RR: 2.90
The recent uptrend has been decisively broken, with price actionThe currency pair showed sustained bullish momentum over the past weeks, forming higher highs and higher lows. However, recent price action broke below the ascending trendline and failed to retest previous highs, indicating waning bullish strength. The break of support suggests the uptrend has been invalidated, with increasing risk of a bearish reversal or short-term correction.

GBP/JPY Bearish OutlookHi Traders.
LTF impulse and bearish continuation correction is forming
out of the ascending channel. Wait for the breakout from the
current correction to confirm this setup

GBPJPY ShortGBPJPY is short on the regression break.
I am not taking this trade, as it has terrible roll short and the other GBP and JPY crosses are not following.

GBPJPY What Next? SELL!
My dear friends,
Please, find my technical outlook for GBPJPY below:
The price is coiling around a solid key level - 199.08
Bias - Bearish
Technical Indicators: Pivot Points Low anticipates a potential price reversal.
Super trend shows a clear sell, giving a perfect indicators' convergence.
Goal - 198.77
Safe Stop Loss - 199.23
About Used Indicators:
The pivot point itself is simply the average of the high, low and closing prices from the previous trading day.
Disclosure: I am part of Trade Nation's Influencer program and receive a monthly fee for using their TradingView charts in my analysis.
———————————
WISH YOU ALL LUCK

GJ Analysis on H4 30.7.25-TL on h4
- candle broke the uptrend TL and making HL LL hence the setup change to Short setup.
- There are 2 areas of short entry with its sL and both has the same area of TP.
We will see if this setup play out as planned.
#selfjournal
#practicetobefulltimetrader
