JPYNOK trade ideas
NOKJPY Update (Educational) You will have to read the Previous post to understand this 1
Watching from the educational post lets see - s3.tradingview.com
1. The ABCDE Triangle pattern played out OR The flag bullish continuation
2. Breakout setup also played out with a SL run (Note we didnt calculate proper SL settings as read in prev chart anaylsis)
3. Double bottom pattern did not form (Deleted the 3rd Long setup order from this chart as the Double bottom ) hence we see a STOP RUN wick just below taken out the prev Lows also the Wick Low resting on the inverse Head and Shoulder's Left Shoulder Yellow Line.
TP is above the HIGH but always aiming for a high as the target.
Exotice Pairs tend to move slower but still pays.

NOKJPY EducationThis is just something I want to share how you can analysis 1 chart with different scenarios
DO have a look
From where price is at
1. The ABCED triangle pattern where we enter at E
2. The flag pattern is forming
3. Market Structure shows a bullish pattern (Numbers 1 & 2 Above Patterns)
4. We see and inverse Head and Shoulders where right shoulder is forming
5. Breakout traders can wait for price to break the upper channel line
6. Price can continue down to form a DOUBLE BOTTOM cancelling out our previous setups Numbers 1-5
Note 3 possible Buy/Long setups on the chart the first high can be TP target but once price goes higher into profit we secure the trade and let her run. Stops can also be trailed.
Always wait for confirmation before entering. If the ABCDE pattern fails thats what the SL is there for incase price wants to form the double bottom.
Note I have not work out a calculated PIP for SL this is just an example for analysis for different buy/long trade.


NOKJPY Sell SignalPattern: Channel Down on 1W and 1M.
Signal: Bearish on current price (1W) and if it makes contact with the 1W MA50 (1M).
Target: 11.200.


NOKJPY: Long term Buy Opportunity.The pair is trading on a long term 1M Channel Down (RSI = 37.681, MACD = -0.379, Highs/Lows = -0.5701) that has come close to the 11.460 1M Support where it rebounded last week. This can be an early signal for a trend reversal and buyers you have entered early can systematically aim at the gaps. First the 12.390 Lower High, which if broke should lead to the 1W Resistance (A) at 12.370 (not a coincidence that the 1W MA50 is currently there. Last gap to fill can be the 1W Resistance (B) at 13.230 where again it is not a coincidence that the 1W EMA200 is currently there. All these levels are Lower Highs on the 1M Channel Down.
** If you like our free content follow our profile (www.tradingview.com) to get more daily ideas. **
Comments and likes are greatly appreciated.


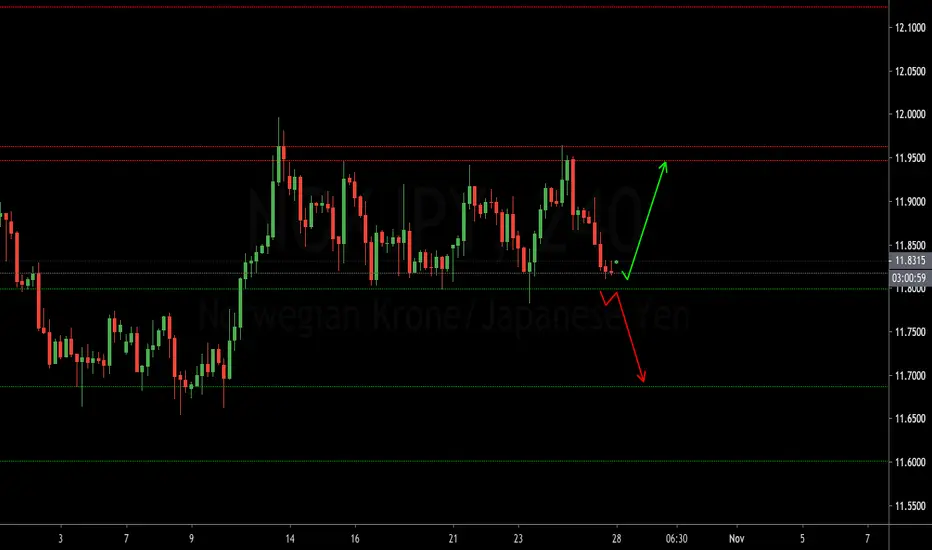
NOKJPY - KRONE / YEN - 4HR What to expect.NOK/JPY looks like it wants to reverse trend by giving us a nice 4hr range break signal. Closes above the last leg down gives me the impression it wants to move upwards soon. At this moment there are two closes above the golden line which is good, a few more would be better. But before we FOMO LONG, stop and think, "could this retest lows?". Yes. In fact that's what I expect it to do. More often than not it gives a nice test of lows before it swings up, but not ALWAYS. So don't try to immediately short this thing and profit on the retest, it doesn't always happen. I've seen tickers just blast off w/ no retest at all.
Anyways.
I'm getting long on the retest of lows with stop loss below previous lower low. Green lines above are profit targets. NOT TRADING ADVICE. TRADE SAFE.


NOK JPY SELL (NORWEGIAN KRONE - JAPANESE YEN)Hi there. Price is forming a continuation pattern to the downside. Watch strong price action at the current price for sell.

NOKJPY - What to expect. -NORWEGIAN KRONE - JAPANESE YEN - FOREXLooks like we got a trend reversal signal (closes above the last leg down) on the 4hr chart. One of my favorite time frames to trade. Looks like we are right in the middle of the pull back. Keep an eye on this higher low here, might be the one that takes us up. I'm personally longing this one from this range, easy stop loss near or below previous lower low as nothing is 100% in trading. NOT FINANCIAL ADVICE. TRADE SAFE.


NOKJPY Scalp SignalPattern: Rectangle on 1H.
Signal: Bullish on the Support, Bearish on the Resistance (scalping).
Target: Short TP 12.4600, Long TP 12.5800.

NOKJPY: Sell opportunity and reversal scenario.The pair is trading within a strong 1D Channel Down (RSI = 34.726, MACD = -0.120, Highs/Lows = -0.0831) for the past month. Currently the Lower High zone holds (red rectangle) and should push the price towards a new Lower Low at 12.350. If 12.630 however breaks it will give a medium term bullish reversal signal and we will target the 12.800 1D Resistance.
** If you like our free content follow our profile (www.tradingview.com) to get more daily ideas. **
Comments and likes are greatly appreciated.

NOKJPY look nice for downHello, Traders. We seen a wedge formation on the NOKJPY chart, and price is moving as expected. We are already in the trade at top, and look for a second trade after a correction for more down side.
Happy trading, guys.
If u like the analysis and want future chart updates, please do help share the charts and like my page. There is more to come ;) , lets make money. Thank you.
IF you are interested in letting us manage your account for consistent profits, just head to fbsmy.com
Thank you.

NOK JPY BUY (NORWEGIAN KRONE - JAPANESE YEN)Hi there. Price is forming a continuation pattern to the upside. Watch strong price action at the current price for buy.


NOK JPY SELL (NORWEGIAN KRONE - JAPANESE YEN)Hi there. Price is at the top of the pattern (b wave) for one more down move (c wave). Watch strong price action at the current price for sell.

NOKJPY: Long opportunity on repetitive patterns.NOKJPY has been on a 4H Channel Up which according to its neutral RSI = 51.365 and Highs/Lows = 0.0000 has reached its Higher Low. This is a signal to go long. This Channel Up is identical to the previous sequence that made a 13.010 High. On 1D (MACD = 0.026, Highs/Lows = 0.0133, B/BP = 0.0028) the trend remains bullish as long as the 12.600 support holds. Our TP = 13.000.
** If you like our free content follow our profile (www.tradingview.com) to get more daily ideas. **
Comments and likes are greatly appreciated.
