NZDJPY: Short Trading Opportunity
NZDJPY
- Classic bearish pattern
- Our team expects retracement
SUGGESTED TRADE:
Swing Trade
Sell NZDJPY
Entry - 86.342
Stop - 86.782
Take - 85.565
Our Risk - 1%
Start protection of your profits from lower levels
Disclosure: I am part of Trade Nation's Influencer program and receive a monthly fee for using their TradingView charts in my analysis.
❤️ Please, support our work with like & comment! ❤️
JPYNZD trade ideas

NZDJPY Under Pressure as China’s PMI FallsNZDJPY Under Pressure as China’s PMI Falls
China’s Caixin Manufacturing PMI unexpectedly dropped to 48.3 in May, down from 50.4 in April, signaling weaker factory activity.
This negative data has weighed on the New Zealand Dollar, pushing NZDJPY to intraday lows near 85.75.
The decline in NZDJPY aligns with fundamental data, increasing the chances of further downside.
Key targets include: 🎯 84.70 🎯 83.50 🎯 82.50
Potential Reversal Zone
However, 84.70 is a strong support level and could act as a turning point for a possible reversal.
You may find more details in the chart!
Thank you and Good Luck!
❤️PS: Please support with a like or comment if you find this analysis useful for your trading day❤️
Disclosure: I am part of Trade Nation's Influencer program and receive a monthly fee for using their TradingView charts in my analysis.

NZDJPY Sell- price going now, just found out the setup, should post early
- Go for short sell then manage your trade
- potentially go lower
- Refine entry with smaller SL for better RR, if your strategy allow
A Message To Traders:
I’ll be sharing high-quality trade setups for a period time. No bullshit, no fluff, no complicated nonsense — just real, actionable forecast the algorithm is executing. If you’re struggling with trading and desperate for better results, follow my posts closely.
Check out my previously posted setups and forecasts — you’ll be amazed by the high accuracy of the results.
"I Found the Code. I Trust the Algo. Believe Me, That’s It."

NZDJPY to find sellers at previous resistance?NZDJPY - 24h expiry
Trading has been mixed and volatile. Price action looks to be forming a top. We look for a temporary move higher. Preferred trade is to sell into rallies. Bespoke resistance is located at 86.50.
We look to Sell at 86.50 (stop at 86.75)
Our profit targets will be 85.50 and 85.25
Resistance: 86.30 / 86.70 / 87.00
Support: 85.50 / 85.20 / 84.80
Risk Disclaimer
The trade ideas beyond this page are for informational purposes only and do not constitute investment advice or a solicitation to trade. This information is provided by Signal Centre, a third-party unaffiliated with OANDA, and is intended for general circulation only. OANDA does not guarantee the accuracy of this information and assumes no responsibilities for the information provided by the third party. The information does not take into account the specific investment objectives, financial situation, or particular needs of any particular person. You should take into account your specific investment objectives, financial situation, and particular needs before making a commitment to trade, including seeking advice from an independent financial adviser regarding the suitability of the investment, under a separate engagement, as you deem fit.
You accept that you assume all risks in independently viewing the contents and selecting a chosen strategy.
Where the research is distributed in Singapore to a person who is not an Accredited Investor, Expert Investor or an Institutional Investor, Oanda Asia Pacific Pte Ltd (“OAP“) accepts legal responsibility for the contents of the report to such persons only to the extent required by law. Singapore customers should contact OAP at 6579 8289 for matters arising from, or in connection with, the information/research distributed.

Long OpportunityAfter breaking above a descending trendline, NZDJPY has established an upward momentum supported by the ascending trendline. This pullback near the support level offers a favorable risk-reward setup for a long position. The price is currently testing the support, suggesting a potential continuation to the upside.
Entry: Around 86.14
Stop Loss (SL): 85.20 (below recent support and trendline)
Take Profit (TP): 89.15 (near previous resistance level)
This setup provides a solid upside potential with a controlled risk zone. Monitor price action for confirmation before entry.

NZDJPY TRADE SETUPWait for retest the entry level and bullish momentum candle then take a trade for Buy othewise skip this setup

NZDJPY A Fall Expected! SELL!
My dear friends,
Please, find my technical outlook for NZDJPY below:
The price is coiling around a solid key level - 86.642
Bias - Bearish
Technical Indicators: Pivot Points Low anticipates a potential price reversal.
Super trend shows a clear sell, giving a perfect indicators' convergence.
Goal - 85.925
Safe Stop Loss - 87.013
About Used Indicators:
The pivot point itself is simply the average of the high, low and closing prices from the previous trading day.
Disclosure: I am part of Trade Nation's Influencer program and receive a monthly fee for using their TradingView charts in my analysis.
———————————
WISH YOU ALL LUCK

NZDJPY: Bullish Wave is Coming 🇳🇿🇯🇵
I have a strong feeling that NZDJPY will resume growth soon.
A neckline breakout of an inverted head & shoulders pattern
provides a strong swing confirmation.
The pair may reach at least 87.0 level soon.
❤️Please, support my work with like, thank you!❤️
I am part of Trade Nation's Influencer program and receive a monthly fee for using their TradingView charts in my analysis.

NZDJPY Analysis Potential Temporal Sell for Continous Buy
I just conducted a very powerful analysis on NZDJPY. Please watch the video to learn more.
Also remember to drop your comment below this video, thank you all.

Short Initiated - NZDJPYLet's see. Slightly late to the party as I didn't leave a resting order which is my fault of course. However, I may be trying to swing this trade now, down to the Weekly SSL level which I believe is where price will want to magnetise to.

Bullish rise?NZD/JPY has reacted off the pivot and could potentially rise to the 1st resistance.
Pivot: 86.01
1st Support: 85.40
1st Resistance: 87.07
Risk Warning:
Trading Forex and CFDs carries a high level of risk to your capital and you should only trade with money you can afford to lose. Trading Forex and CFDs may not be suitable for all investors, so please ensure that you fully understand the risks involved and seek independent advice if necessary.
Disclaimer:
The above opinions given constitute general market commentary, and do not constitute the opinion or advice of IC Markets or any form of personal or investment advice.
Any opinions, news, research, analyses, prices, other information, or links to third-party sites contained on this website are provided on an "as-is" basis, are intended only to be informative, is not an advice nor a recommendation, nor research, or a record of our trading prices, or an offer of, or solicitation for a transaction in any financial instrument and thus should not be treated as such. The information provided does not involve any specific investment objectives, financial situation and needs of any specific person who may receive it. Please be aware, that past performance is not a reliable indicator of future performance and/or results. Past Performance or Forward-looking scenarios based upon the reasonable beliefs of the third-party provider are not a guarantee of future performance. Actual results may differ materially from those anticipated in forward-looking or past performance statements. IC Markets makes no representation or warranty and assumes no liability as to the accuracy or completeness of the information provided, nor any loss arising from any investment based on a recommendation, forecast or any information supplied by any third-party.

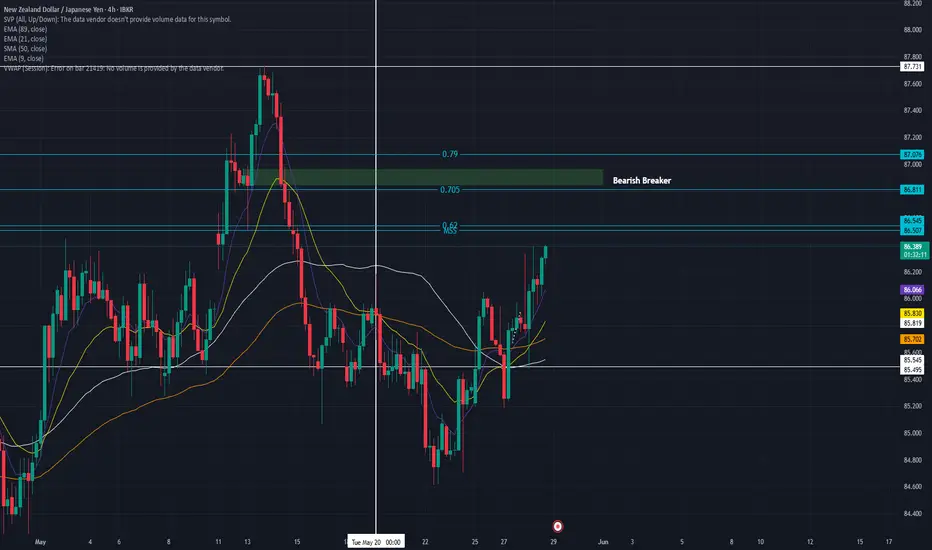
NZD/JPYThe NZD/JPY had a weak weekly close, the week before last, after sweeping weekly buy side liquidity thus forming a weekly Doji The Doji conveyed a more bearish impulse by printing a new weekly lower low and closing below the previous week's settlement. After this run of BSL, on H4, price action experienced strong displacement lower, breaking structure and producing a market structure shift. I have been waiting for the swing low to form so that I can place entries at the 0.62, 0.705 and the 0.79 retracement levels. The 0.62 being just above the MSS, the 0.705 being just below the Bearish Breaker and the 0.79 level being within a bearish fair value gap whilst targeting the previous swing low or SSL level.
NZDJPY might need a strong catalyst to push higherAfter the RBNZ’s widely expected single cut on 28 May, NZDJPY made some gains amid unusually low volatility. Trade talks are in focus for both the Kiwi dollar and the yen with Japan in particular holding negotiations with the USA about which senior members of the BoJ have commented. Last week’s auction of 20-year Japanese bonds saw the weakest demand in more than a decade, prompting rumours that the Japanese ministry of finance might reduce the availability of such very long-term bonds. Meanwhile in monetary policy the differential is likely to remain at least 2.25% until the end of the year.
Compared to NZDUSD, here there might be more potential for gains. The price did briefly break above ¥87 this month although the reaction from there was quite strong. The slow stochastic is also still close to oversold, having recently completed a crossover on the border of the trigger zone. ¥84 is a possible short-term support.
A sustained movement above the 200 SMA and ¥87 would probably need a strong fundamental driver of some sort. That might come from some kind of development in various trade negotiations since usually the Kiwi dollar is more trade-sensitive than the yen. Trade data from New Zealand late on 2 June GMT probably won’t drive a large movement unless the results are very surprising, but Japanese GDP late on 8 June GMT could have a significant effect.
This is my personal opinion, not the opinion of Exness. This is not a recommendation to trade.

Bearish reversal?NZD/JPY is rising towards the pivot and could reverse to the 1st support.
Pivot: 86.38
1st Support: 84.37
1st Resistance: 87.07
Risk Warning:
Trading Forex and CFDs carries a high level of risk to your capital and you should only trade with money you can afford to lose. Trading Forex and CFDs may not be suitable for all investors, so please ensure that you fully understand the risks involved and seek independent advice if necessary.
Disclaimer:
The above opinions given constitute general market commentary, and do not constitute the opinion or advice of IC Markets or any form of personal or investment advice.
Any opinions, news, research, analyses, prices, other information, or links to third-party sites contained on this website are provided on an "as-is" basis, are intended only to be informative, is not an advice nor a recommendation, nor research, or a record of our trading prices, or an offer of, or solicitation for a transaction in any financial instrument and thus should not be treated as such. The information provided does not involve any specific investment objectives, financial situation and needs of any specific person who may receive it. Please be aware, that past performance is not a reliable indicator of future performance and/or results. Past Performance or Forward-looking scenarios based upon the reasonable beliefs of the third-party provider are not a guarantee of future performance. Actual results may differ materially from those anticipated in forward-looking or past performance statements. IC Markets makes no representation or warranty and assumes no liability as to the accuracy or completeness of the information provided, nor any loss arising from any investment based on a recommendation, forecast or any information supplied by any third-party.

Potential bearish drop?NZD/JPY is reacting off the resistance level which is a pullback resistance that aligns with the 50% Fibonacci retracement and could drop from this level to our take profit.
Entry: 86.13
Why we like it:
There is a pullback resistance level that lines up with the 50% Fibonacci retracement.
Stop loss: 87.09
Why we like it:
There is a pullback resistance level that lines up with the 78.6% Fibonacci retracement.
Take profit: 84.73
Why we like it:
There is a pullback support level.
Enjoying your TradingView experience? Review us!
Please be advised that the information presented on TradingView is provided to Vantage (‘Vantage Global Limited’, ‘we’) by a third-party provider (‘Everest Fortune Group’). Please be reminded that you are solely responsible for the trading decisions on your account. There is a very high degree of risk involved in trading. Any information and/or content is intended entirely for research, educational and informational purposes only and does not constitute investment or consultation advice or investment strategy. The information is not tailored to the investment needs of any specific person and therefore does not involve a consideration of any of the investment objectives, financial situation or needs of any viewer that may receive it. Kindly also note that past performance is not a reliable indicator of future results. Actual results may differ materially from those anticipated in forward-looking or past performance statements. We assume no liability as to the accuracy or completeness of any of the information and/or content provided herein and the Company cannot be held responsible for any omission, mistake nor for any loss or damage including without limitation to any loss of profit which may arise from reliance on any information supplied by Everest Fortune Group.

Trendline BreakThe Price has broken out of a bullish trendline followed by a pullback, and if the price makes a lower low, it is confirmation of a bearish move
WE ONLY TRADE PULLBACKS

NZD/JPY BEARISH BIAS RIGHT NOW| SHORT
NZD/JPY SIGNAL
Trade Direction: short
Entry Level: 85.992
Target Level: 83.908
Stop Loss: 87.366
RISK PROFILE
Risk level: medium
Suggested risk: 1%
Timeframe: 1D
Disclosure: I am part of Trade Nation's Influencer program and receive a monthly fee for using their TradingView charts in my analysis.
✅LIKE AND COMMENT MY IDEAS✅

NZDJPY BULLISH OR BEARISH DETAILED ANALYSISNZDJPY has just completed a clean breakout from its descending channel, and we are now setting up for a potential bullish continuation. The breakout above the channel resistance confirms a reversal of the prior downtrend, signaling fresh bullish momentum in play. Price is currently hovering around 85.90, and I’m targeting a move toward 91.90 in the coming weeks as market structure shifts in favor of buyers.
Fundamentally, the New Zealand dollar is gaining strength following the RBNZ's recent hawkish stance. Despite global rate cut expectations, the RBNZ has held firm, emphasizing inflation remains elevated and may require prolonged tight policy. This divergence from other central banks, particularly the BoJ, gives NZD an upper hand. On the flip side, the Japanese yen continues to show weakness due to the BoJ's ultra-loose monetary stance, and there's still no concrete signal of a shift toward tightening. Yield differentials remain wide, fueling carry trades in favor of NZD.
Technically, the breakout is supported by strong bullish candles and increasing volume. The breakout level around 85.60 is now acting as fresh support, and as long as we hold above that zone, the bullish bias remains valid. The structure suggests momentum is building toward 88.50 as the next minor resistance, and a break above that could accelerate the rally to our full target at 91.90.
From a risk-reward perspective, this setup remains favorable. I'm closely monitoring bullish continuation patterns on lower timeframes to scale in. NZDJPY appears primed for a potential upside surge, supported by both fundamentals and technicals, and I’m looking to ride this trend as long as the current momentum holds.

Market buy ideaWill the market continue to break down or break up and retest the zones plotted for this week

NZD/JPY "Kiwi vs Yen" Forex Bank Heist (Day Trade Plan)🌟Hi! Hola! Ola! Bonjour! Hallo! Marhaba!🌟
Dear Money Makers & Robbers, 🤑 💰💸✈️
Based on 🔥Thief Trading style technical and fundamental analysis🔥, here is our master plan to heist the NZD/JPY "Kiwi vs Yen" Forex Bank Heist. Please adhere to the strategy I've outlined in the chart, which emphasizes long entry. Our aim is to escape near the high-risk Yellow MA Zone. Risky level, overbought market, consolidation, trend reversal, trap at the level where traders and bearish robbers are stronger. 🏆💸"Take profit and treat yourself, traders. You deserve it!💪🏆🎉
Entry 📈 : "The heist is on! Wait for the Crossing previous high (86.000) then make your move - Bullish profits await!"
however I advise to Place Buy stop orders above the Moving average (or) Place buy limit orders within a 15 or 30 minute timeframe most recent or swing, low or high level for Pullback entries.
📌I strongly advise you to set an "alert (Alarm)" on your chart so you can see when the breakout entry occurs.
Stop Loss 🛑: "🔊 Yo, listen up! 🗣️ If you're lookin' to get in on a buy stop order, don't even think about settin' that stop loss till after the breakout 🚀. You feel me? Now, if you're smart, you'll place that stop loss where I told you to 📍, but if you're a rebel, you can put it wherever you like 🤪 - just don't say I didn't warn you ⚠️. You're playin' with fire 🔥, and it's your risk, not mine 👊."
📍 Thief SL placed at the nearest/swing low level Using the 30mins timeframe (84.800) Day trade basis.
📍 SL is based on your risk of the trade, lot size and how many multiple orders you have to take.
🏴☠️Target 🎯: 88.000
🧲Scalpers, take note 👀 : only scalp on the Long side. If you have a lot of money, you can go straight away; if not, you can join swing traders and carry out the robbery plan. Use trailing SL to safeguard your money 💰.
💰💵💸NZD/JPY "Kiwi vs Yen" Forex Bank Heist (Day Trade Plan) is currently experiencing a bullishness,., driven by several key factors. .☝☝☝
📰🗞️Get & Read the Fundamental, Macro Economics, COT Report, Quantitative Analysis, Sentimental Outlook, Intermarket Analysis, Future trend targets with overall score... go ahead to check 👉👉👉🔗🔗🔗
⚠️Trading Alert : News Releases and Position Management 📰🗞️🚫🚏
As a reminder, news releases can have a significant impact on market prices and volatility. To minimize potential losses and protect your running positions,
we recommend the following:
Avoid taking new trades during news releases
Use trailing stop-loss orders to protect your running positions and lock in profits
💖Supporting our robbery plan 💥Hit the Boost Button💥 will enable us to effortlessly make and steal money 💰💵. Boost the strength of our robbery team. Every day in this market make money with ease by using the Thief Trading Style.🏆💪🤝❤️🎉🚀
I'll see you soon with another heist plan, so stay tuned 🤑🐱👤🤗🤩

NZDJPY 1H LONGFound falling wedge with bullish divergence
Entry on break on last LH, Projection about 1:1

NZDJPY Day trade/swing trade shortStrong weekly bullish rejection candle last week, the daily time frame has also turned bearish so some nice higher TF confluences. The 4h TF also being bearish and currently retesting the neckline of the head and shoulders pattern (blue curved lines). For me I’m not looking to enter anything today as the markets close for the weekend tomorrow but will be one to watch next week. Hope everyone has a good weekend! 🤙

NZDJPY → Pre-breakdown consolidation. Readiness for a declineFX:NZDJPY is under pressure from a global downtrend. Locally, a flat (range) and pre-breakdown consolidation relative to support are forming on the chart...
After a false breakdown of support on May 16, the price failed to reverse and grow. Instead, the currency pair entered a consolidation phase, during which it continues to test support. Each subsequent retest of 85.25-85.30 only increases the chances of a breakout with the aim of continuing the decline. Another important nuance is the elimination (short squeeze) of local resistance at 85.95.
Pressure on the price is also being exerted by the falling dollar index, which is strengthening the Japanese yen, which is generally reflected in the price of NZDJPY...
Support levels: 85.300, 85.25, 84.195
Resistance levels: 85.7, 85.95
The continuation of the current consolidation and the compression of the price towards support only increases the chances of a breakdown of the 85.30 support level. A break and consolidation of the price below 85.25 could trigger a further decline.
Best regards, R. Linda!
