USDJPY : Where the price can reach? Long Term Scene.USDJPY Could soar to:
Target 1: 152.110
Target 2: 155 - 160.326
Target 4: 164.617
Target 5: 197.462
Trade at your own risk. Market can behave differently due to various factors.
JPYUSD trade ideas

USDJPY HEADING UPThe daily time frame is showing potential bullish movement, seemingly forming structure after daily consolidation. Price bounced off of support and formed a higher low, a third retest of the bullish trend line will further validate this.

Ichimoku N-WaveI had taken this trade from just before the NT and added after NT. This looks like an N-Wave for those familiar with Wave Theory. I have calculated D as 08.08.25. Thus is a projection only based on Time and Wave Theory. Risk manage aggressively approaching NFP tomorrow.

Beginner MistakeI was expecting a push to the downside but i got stopped out big time. I am publishing this trade to look back at it when i am profitable.
USDJPY Buy analysis/ideaThis trade is based on the daily and 3-hour timeframes and executed using reversal trading and trend formation. This is an update for the previous analysis that I posted earlier on this pair . complete explanation in the video!

USDJPYMaintaining Long Bias On UJ. Targetted price prediction are the orange and blue arrow for both TP1 and TP2
Trade safe and manage you risk wisely

USD/JPY - Bearish Idea on H1USD / JPY sell idea on H1.
Price broke out of the ascending channel after a divergence was formed.
Price also starting making Lower Lows & Lower Highs.
We will wait for the price to retrace back to the 0.5 - 0.618 Fib retracement to take the entry.
Stop loss above the last high formed

USDJPY-BUYPrice breaking the resistant area with a Momentum Candle. overall it's an uptrend. daily and weekly price is over EMA200.

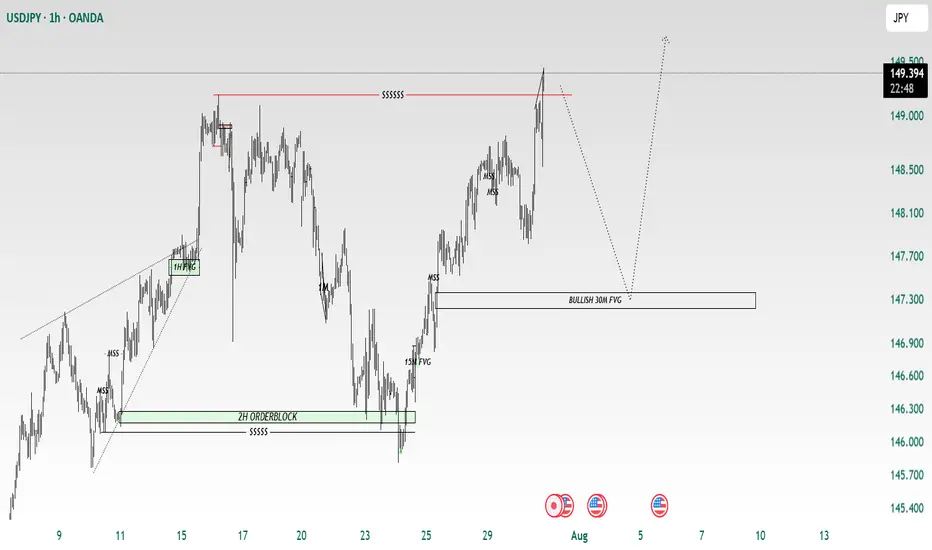
USD/JPYUSDJPY Has taken liquidity. with the fed holding rates and the BOJ interest rate coming out this morning i can see a pull back into the hourly fvg before climbing higher

Analysis on the Elite 10 Pairs and Area of InterestYou can follow us for more Analysis(Images and Videos) with Precise definition of the Financial Market.ENJOY!!!

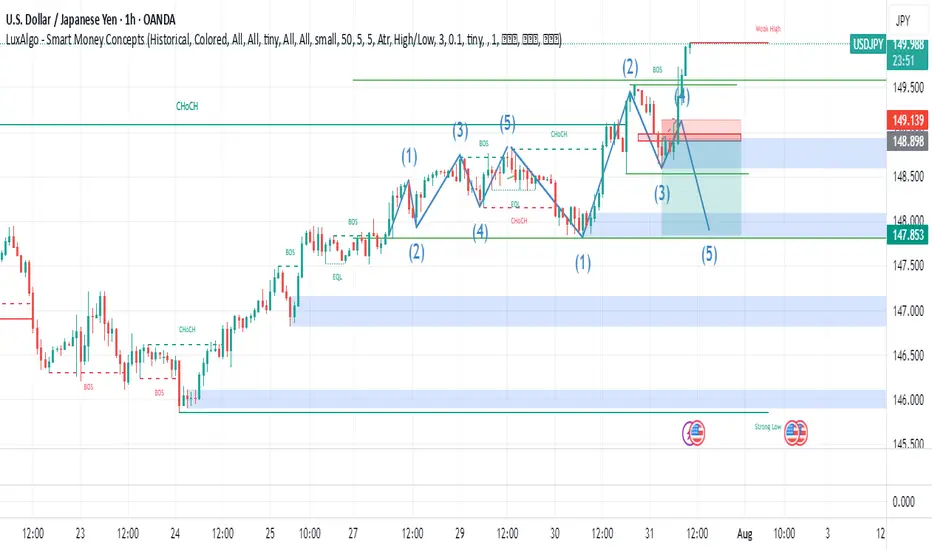
July 30 2025 USDJPY Buy Limit ActivatedGood day, folks!
Another trade today! This is a continuation trade before the USD fundamental news. I've got some useful schematics on my chart for trading continuation momentum patterns with positive confluence in your fundamentals. You can see a swing structure BOS with validity of an internal structure: another BOS. I waited for the price to tap again into that valid order block, which also had validity of internal structure - BOS. The risk-reward (RR) is 1:4. Check the chart for detailed annotations.
I hope you find value in this trade today. Until next time!
#proptrader
#wyckoff
#supplyanddemand
#riskmanagement

USDJPY LongDecided to do a long entry on UJ. Below is the prediction. Entry was during Asian session. Expecting TP of UJ at around 149ish or 151.250 max

USDJPY UPSIDE The dollar index (DXY00) on Tuesday rose by +0.22% and posted a 5-week high. The dollar has carryover support from Monday following the EU-US trade deal that is seen as favoring the US. Also, expectations for the Fed to keep interest rates unchanged at the end of Wednesday's 2-day FOMC meeting are supportive of the dollar. The dollar extended its gains after the US Jun advance goods trade deficit unexpectedly shrank, a supportive factor for Q2 GDP, and after July consumer confidence rose more than expected.

USDJPY Confirmed that the currency pair has been dominatedConfirmed that the currency pair has been dominated by the short side in the short term through high-frequency aggregated reasoning on the time-sharing K-line pattern, capital turnover bias, and short-cycle public opinion winds, especially suggests that under the current market conditions, investors need to be wary of what appears to be a mild rebound but is actually a long-drawn-out trap.
The trading spectrum chart tracked by the system shows that short high-frequency accounts have continued to maintain a steady increase in positions in recent trading cycles, while long transactions have shrunk significantly, with an obvious structural imbalance. Words like "conservative", "position reduction" and "trend risk" have proliferated in the public opinion platform, and the dominant market sentiment has shifted to defense.
What's more, multiple signals have formed a "negative resonance", including: macro pressure, net outflow of capital, weakening of technical rebound, and investors' mentality turning cold.

USDJPY PRICE AT RESISTANCE!Price is stuck at a resistance level of 148.198 ahead of US fed interest rate today. I from the higher timeframes (monthly and weekly) the market is still bullish. If we do get a break above the resistance level. More bullish price action will be envisaged.

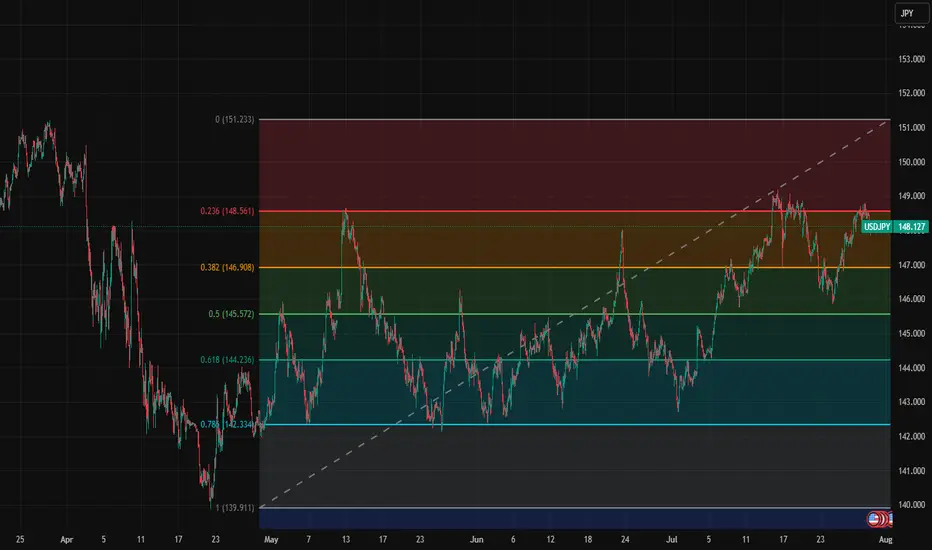
USDJPY short term key levelsThese are short term key levels on 1h chart for intra day and swing trading.
139.91
142.33
144.23
145.57
146.91
148.56
151.233
BIASOne thing i will tell you for free is that, you should stop worrying about entries, and always focus on the market direction, of the current leg of price that you find yourself paired with the HTF perspective, that way even if your entry is wrong, you can always find another entry and join in the given direction.

USD/JPY Chart Analysis (Educational Breakdown)📊USD/JPY Chart Analysis (Educational Breakdown)
🗓 Date: July 28, 2025
⏰ Timeframe: 2H (2-Hour Candles)
🧠 Concepts: Liquidity | Fair Value Gap | Order Block | Structure | Support/Resistance
⸻
1. Market Structure Overview
• The pair has been bullish, making higher highs and higher lows.
• Recently, price tapped into a resistance zone (~148.40–149.00) and sharply rejected, suggesting a potential short-term reversal.
• The price may now aim to sweep liquidity below support before a possible rebound.
⸻
2. Key Levels
🟥 Resistance Zone (148.50–149.00)
• Marked by a previous supply zone where sellers stepped in aggressively.
• Current Bearish Order Block sits just below this resistance, confirming institutional interest in selling this level.
🟫 Bearish Order Block
• Last bullish candle before sharp drop acts as a bearish order block (around 148.30–148.50).
• This is a high-probability sell-side reaction area — ideal for liquidity grabs and reversals.
🟦 Fair Value Gap (FVG)
• Between mid-17th–18th July, an imbalance was left after strong bullish momentum.
• Price returned to this zone, partially filled the gap, and then dropped again — confirming its importance.
🟥 Support Zone (145.80–146.30)
• Long-standing demand area where buyers previously stepped in.
• This area aligns closely with sell-side liquidity (SSL).
⸻
3. Liquidity Zones
🔵 Buy-Side Liquidity (BSL) – Above resistance (149.00+)
• Stop-loss clusters above previous swing highs.
• Liquidity for institutional sell positions.
🟣 Sell-Side Liquidity (SSL) – Below 146.00
• Positioned right under support.
• Ideal liquidity target for smart money to trigger stop hunts and fill positions before reversing.

#USDJPYDate: 29-07-2025
#USDJPY Current Price: 148.53
Pivot Point: 148.049 Support: 146.177 Resistance: 149.932
Upside Targets:
Target 1: 151.264
Target 2: 152.597
Target 3: 154.303
Target 4: 156.008
Downside Targets:
Target 1: 144.839
Target 2: 143.501
Target 3: 141.796
Target 4: 140.090
#TradingView #Stocks #Equities #StockMarket #Investing #Trading #Forex
#TechnicalAnalysis #StockCharts #Currency

USDJPY 60/15 Pullback LongOverall bull trend. Waiting for pullback. If it pass the market shift and stay below, no go. Else will wait for long singal to go long.

USDJPY Rising wedge on FX:USDJPY pair
Key level to watch is 150 where multiple failed breakout attempts were recorded.
Confirmed breakout will push price to 152-156

USDJPY long position 29/07/2025English : According to our analysis, we anticipate a bearish scenario.
Morocan Darija : kanchofo d'apres l'analyse dyalna antsanaw hboot
ATENTION : I only share my ideas, not signals
if TP1 hit i will move SL to BE
