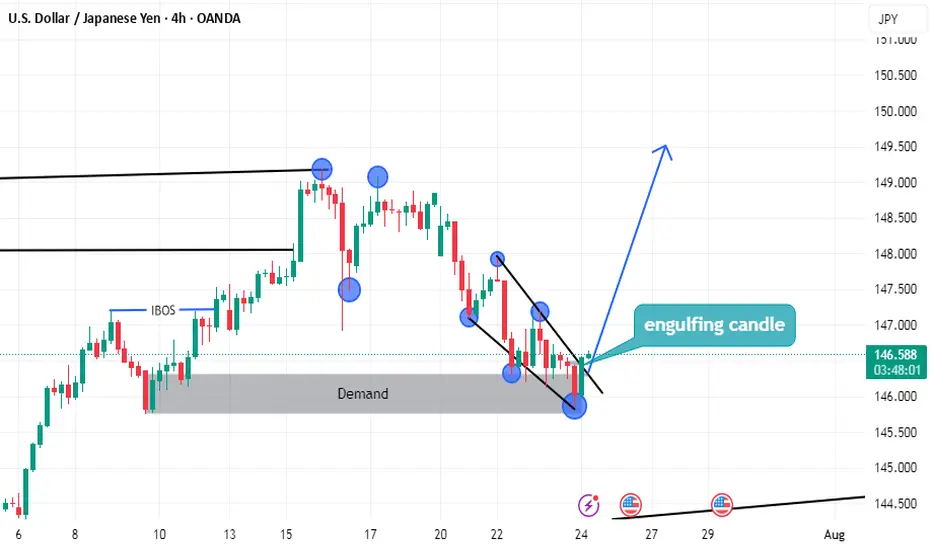
USDJPY LONG setupsimply
we have demand
and the price can't lower low
end we have break of structure on low time frame
and we have more but i don't have enough time to tell you
Look the photo well
JPYUSD trade ideas
#USDJPY: Swing Buy Almost +2000 Pips! Dear Traders,
The USDJPY currency pair appears to be in an accumulation phase at the moment, as evidenced by the lack of significant price movement throughout the current week. Several factors contribute to this trend.
Firstly, several significant economic events are scheduled for this week, particularly tomorrow and Friday. These developments will have substantial implications for the future trajectory of the USDJPY pair. Consequently, there’s a possibility that the price may experience a decline before initiating a bullish trend. We’ve recently seen a strong bullish candle, which suggests a strong bullish move in the coming weeks. Additionally, the strong USD could continue rising, while the JPY is dropping.
Secondly, there are two primary areas where the price could reverse its course. The extent to which the USD reacts to the economic data will indicate potential reversal zones.
It’s crucial to conduct your own analysis before making any financial decisions. This chart should be used solely for educational purposes and does not guarantee any specific outcome.
Regarding the stop loss, as this is a swing trade, it’s advisable to employ a larger stop loss if the price reaches entry zones. The take profit level can be determined based on your entry type and analysis.
We wish you the best of luck in your trading endeavours and emphasise the importance of trading safely.
Please share this analysis with others through likes, comments, and social media platforms. If you have any questions or require further assistance, don’t hesitate to comment below. We’re here to provide support.
Team Setupsfx_
❤️🚀


USDJPY 30Min Engaged ( Bearish Reversal Entry Detected )Time Frame: 30-Minute Warfare
Entry Protocol: Only after volume-verified breakout
🩸Bearish Retest - 148.450
➗ Hanzo Protocol: Volume-Tiered Entry Authority
➕ Zone Activated: Dynamic market pressure detected.
The level isn’t just price — it’s a memory of where they moved size.
Volume is rising beneath the surface — not noise, but preparation.
🔥 Tactical Note:
We wait for the energy signature — when volume betrays intention.
The trap gets set. The weak follow. We execute.
Temporary SELL then BUYAs we said, BIG picture BUY.
Yesterday temporary sell since H1 range was still SELL.
Today H1 range is BULLISH.
We expect temporary SELL from 147.22/42 (After confirmation we will get Snip entry)
TP1: 146.45 (BUY ZONE)
Note: If It will go to BUY ZONE (146.45) first before SELL ZONE (I wont sell)

USDJPY Cooking Something – Here's Where I’ll BiteTHE BATTLE OF MY BLUE LINES 📉
The big picture of USDJPY is BUY possible up to 149.35.
I see H1 send me love note to BUY (range) but 15m reject it by forming SELL range.
Conflict? No! This means there is temporary reversal (BEARISH).
Two top BLUE LINES (147.75/85) are where I can SELL my love story. I will first wait H4 to Kiss either of the line. Since 15m SELL range already formed, I ’ll jump in like a love-struck fool (AGGRESSIVE).
TP: Middle BLUE LINE (147.21) = Dating spot for Buyers.
Middle BLUE LINES (147.21, 147.00)
If H4 price come and KISS (touches and leave wick) in either of these, I’m rushing to 15m to catch that BUY breakout.
If H4 price come and CUDDLE (close by body),I’ll cozy up to SELL (after confirmation) and ride it all the way down to 146.42, the Bottom BLUE LINE. 📉
In Bottom BLUE LINE (146.42) = Buyers Chilling Zone
If H4 price come and KISS (touches and leave wick), I’m rushing down to 15m to catch that BUY breakout — love at first touch!
If H4 price come and CUDDLE (close by body), my trading heartbreak season will start!
WISH ME LUCK.!!!


USDJPY shortSo far for the year of 2025, the USDJPY had a lower push off of the year open. Since March it has been in a 4 month consolidation, making a bear flag formation. Obviously the risk markets are bullish and a bullish Yen could mean risk off, however the Swiss Franc has been strong all year, and that has not affected the risk markets. So I am not looking for risk markets to be done, I am simply looking at this pair for trend continuation. And it is a beautiful trend thus far, with a perfect consolidation period. So I am looking for a short as long as price fails to get above Aprils high, as that is the range we are trading inside. Looking for a failure here at these prices, and looking for a year end target of 135. Bearish invalidation would be March's high. As that could mean a shallower correction phase, and it could be looking to retest year open at that point. As long as it is trading under April's highs, I think risk is to the downside.

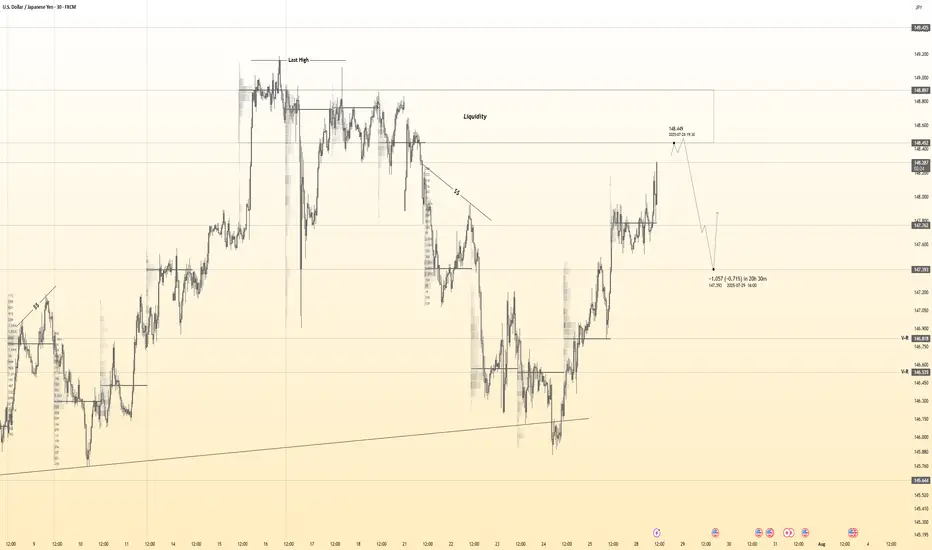
USD/JPY Forecast — GANN DAILY PIPP STRATEGYAccording to my GANN-based time analysis, this month is divided into 2 major intervals, and each third is further split into 1 secondary zone, then into 6 micro zones.
Each of these micro-zones is divided into 3 equal slices, and each slice into 2 smaller zones — like cutting a cake into precise pieces.
This granular structure helps anticipate key reversal points based purely on time.
Open chart and click "make it mine" to and travel through the timeframes to understand
🔓 witness the art.
🎯 Every candle tells a story.
⏱️ Every line marks a time-based turning point.
💥 This is not just analysis — it’s precision timing.
🖼️ Click the chart and explore the masterpiece.
Let the market reveal its rhythm.
---
🎯 Key Levels
Pivot Point of the Week: 148.014
If price stays below, I expect a decline toward 145.098
My main time anchor to start measuring from is the price level 139.266
---
🧠 Strategy Note:
We don’t predict where the price "might go."
We react only when the price meets a defined time interval — because in most cases, price reacts precisely at those time moments.
if the price reach 148.743 and a 15min candle break it or closed completely above it then we may watch usd/jpy near 150.201
---
🟡 Live Setup:
On the chart below, we already had several reactions around key time intervals (highlighted). I’m monitoring closely to ride any impulsive move post-time-crossing.
No indicators. No clutter. Just price + time + behavior.

USDJPY: Market of Sellers
It is essential that we apply multitimeframe technical analysis and there is no better example of why that is the case than the current USDJPY chart which, if analyzed properly, clearly points in the downward direction.
Disclosure: I am part of Trade Nation's Influencer program and receive a monthly fee for using their TradingView charts in my analysis.
❤️ Please, support our work with like & comment! ❤️

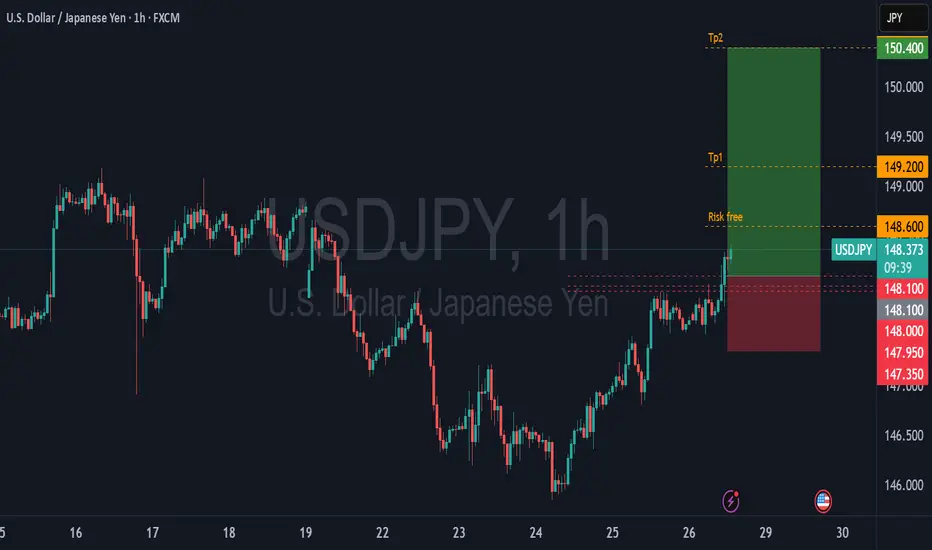
USDJPY TRADE IDEA💴 USD/JPY Smart Money Outlook – July 28, 2025
🔍 Technical Breakdown:
• Market Structure:
• A strong Break of Structure (BOS) is already printed, confirming bullish intent.
• Price has created a clean internal range, likely to engineer liquidity before continuation.
• Key Zones Identified:
• Demand zone marked around 146.90 – 147.20. This is where institutional orders are anticipated.
• Price is currently near short-term highs (~148.38), where liquidity is likely being built.
• Expected Scenario:
• Anticipate a retracement back into the demand zone (gray box) for a low-risk buy entry.
• Bullish continuation is projected toward the 148.60+ region, breaking above current highs.
• Smart Money Flow Logic:
• BOS confirms bullish bias → Pullback to demand → Entry after liquidity sweep → Continuation toward new highs.
🧠 Smart Money Narrative:
1. Internal liquidity buildup just above BOS zone.
2. Price is likely to retest demand before institutional buyers re-enter.
3. Ideal entry after a sweep, with confirmation on lower timeframe.
4. Targeting external liquidity above 148.60 zone.

High percentage buy positionWe are in the best position to enter a long position and will enter only with a minor correction.
There is good potential for price growth and we will ride this wave to reach higher targets.
GBPUSD - GBPJPY - USDJPY Trade Recaps 28.07.25Three positions taken last week. Some vital findings within my self-review process which showed a stop loss error with GBJPY causing me to miss a solid 4% trade, and a manual close on GBPUSD to bank a little extra profit.
Full explanation as to why I executed on these positions and the management plan with both.
Any questions you have just drop them below 👇


USDJPY Potential UpsidesHey Traders, in today's trading session we are monitoring USDJPY for a buying opportunity around 147.800 zone, USDJPY is trading in an uptrend and currently is in a correction phase in which it is approaching the trend at 147.800 support and resistance area.
Trade safe, Joe.

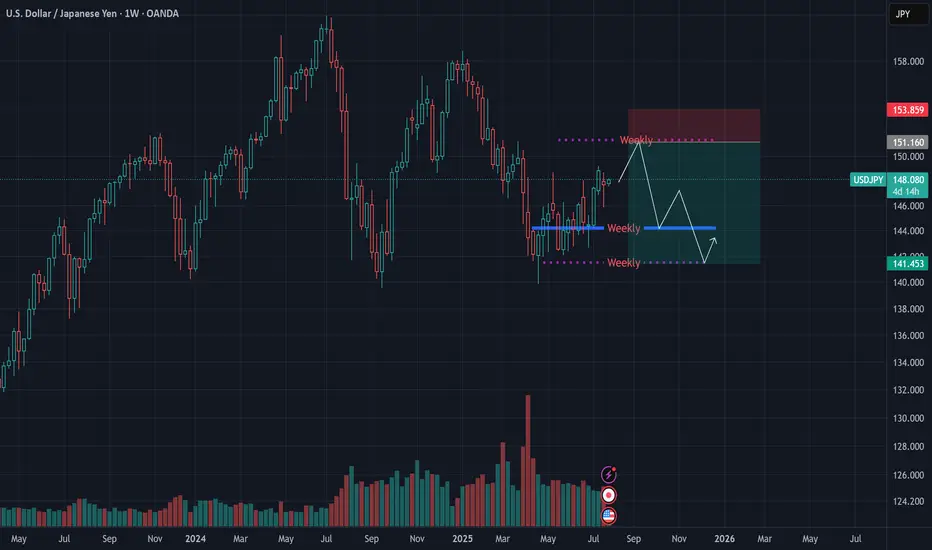
USDJPY Macro Analysis – July 27, 2025We’ve been tracking the yen for months and, since the beginning of the year, have signaled a potential appreciation in its value, largely based on the Bank of Japan’s policy stance.
📉 However, recent price action — particularly the return to prior levels — revealed a shift in Japan’s macroeconomic direction.
🇯🇵 Last week, we saw the first formal confirmations, with Japan making its largest-ever investment in the U.S.
This suggests a new approach to currency valuation, and we may now witness another phase of yen weakness.
🌀 That said, the market remains uncertain and indecisive, so it’s wise to hold off on major long-term entries until further confirmation.
🎯 A tactical entry around the 150 level could be reasonable in the meantime, as we wait for clearer signals.
USDJPY Forming Bullish MomemtumUSDJPY is currently exhibiting strong bullish momentum following a clean breakout from a bullish pennant formation on the 2H timeframe. The market formed higher lows and consolidated within a tight structure, creating compression that has now resolved upward. This breakout indicates continuation of the prior bullish impulse, and price is now targeting the key resistance zone between 148.80 and 149.30. This area previously acted as a strong supply zone, and a clean break above could open the path toward 150.00 psychological levels.
Fundamentally, the US dollar remains supported by expectations of a hawkish tone from the Federal Reserve. Despite mixed economic data recently, the US economy remains resilient, with GDP growth and labor market data showing strength. On the other hand, the Bank of Japan continues to maintain an ultra-loose monetary stance, offering little rate-hike guidance. This divergence in monetary policy keeps the dollar well-bid against the yen. Any further yield differential expansion will continue to support USDJPY to the upside.
From a technical perspective, the structure remains bullish as long as price holds above the 147.65–147.50 breakout support. Momentum is aligning well with the current price action, and volume confirmation on the breakout adds confidence to the bullish scenario. Traders should watch the reaction around the 149.00–149.30 zone carefully, as this is the last major barrier before we potentially see continuation toward multi-month highs.
Overall, the bullish continuation pattern suggests that USDJPY is preparing for another leg higher. With both technical and fundamental factors aligning, this pair remains a key watch for trend-following traders. Patience and precision remain critical here—watch for potential retests and build positions on confirmation.

USDJPY Sell Trade from the ResistanceUJ is at 1H Resistance we can sell correction move towards sell side.
Sentiments are for sell side so in bigger time it can break that zone but we can plan a instraday trade.

USDJPY30h Candle confirmed break out!
📢 USDJPY – 30H Breakout Confirmed
Technical Outlook:
Confirmed breakout on the 30H candle, signaling bullish.
Resistance break!
A Inverse Head & Shoulders pattern observed, though the right shoulder is slightly weaker than the left.
For safety, Stop Loss placed below the last Higher Low (HL) to respect market structure.
📍 Key Line:
“Imperfect structures can still produce perfect trades — when aligned with price action and fundamentals.”
🌐 USD Fundamentals Supporting the Bias:
Stronger-than-expected economic data (e.g., recent PMI and labor reports) continues to support USD strength.
Fed's hawkish stance and higher-for-longer rate policy remain favorable for the dollar against low-yielding currencies like JPY.

USDJPY– DAILY FORECAST Q3 | W31 | D28 | Y25📊 USDJPY– DAILY FORECAST
Q3 | W31 | D28 | Y25
Daily Forecast 🔍📅
Here’s a short diagnosis of the current chart setup 🧠📈
Higher time frame order blocks have been identified — these are our patient points of interest 🎯🧭.
It’s crucial to wait for a confirmed break of structure 🧱✅ before forming a directional bias.
This keeps us disciplined and aligned with what price action is truly telling us.
📈 Risk Management Protocols
🔑 Core principles:
Max 1% risk per trade
Only execute at pre-identified levels
Use alerts, not emotion
Stick to your RR plan — minimum 1:2
🧠 You’re not paid for how many trades you take, you’re paid for how well you manage risk.
🧠 Weekly FRGNT Insight
"Trade what the market gives, not what your ego wants."
Stay mechanical. Stay focused. Let the probabilities work.
FX:USDJPY

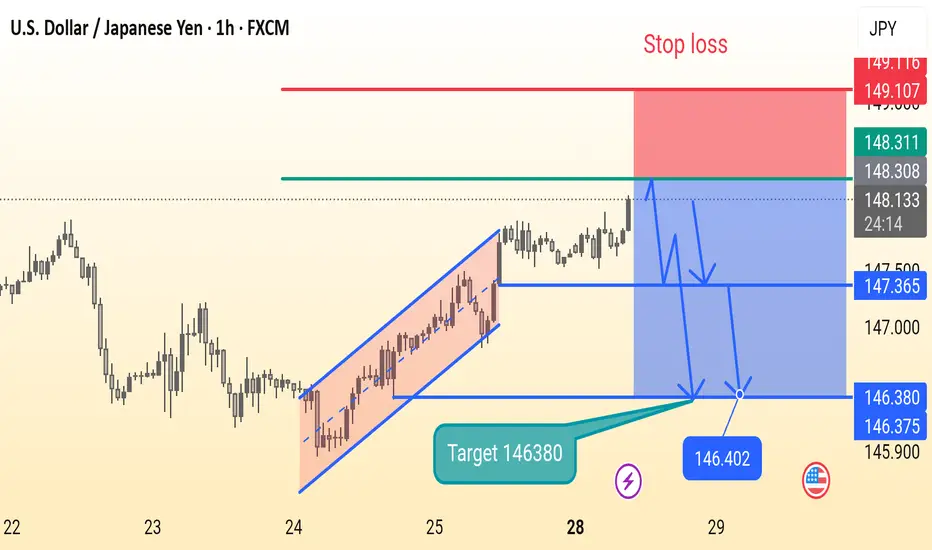
Usdjpy setupThis is a 1-hour USD/JPY chart showing a potential short (sell) trade setup. After a rising channel breakout, the price is consolidating. The chart suggests a bearish move with a target at 146.380 and a stop loss at 149.107. Key support levels are marked at 147.365 and 146.380.
USDJPY FORECASTA new week is already in motion guys everything is looking good in the market , Today I'm looking into the USDJPY which is looking good however we need some development into the market. Let's see how the market will be moving!

USD/JPY Technical Analysis - 4h Chart (Jul 24, 2025)
Key Observations:
Price Action (4h Close):
Open (O): 146.545
High (H): 146.660
Low (L): 146.448
Close (C): 146.473
Change: -0.036 (-0.028%) → Slight bearish momentum.
50% - Order Block:
Indicates a key retracement level where institutional traders may have placed orders.
Current price near 146.473 suggests potential consolidation or reversal if this level holds.
Profit Levels (Potential Targets):
Bullish Scenario (if USD strengthens):
147.170 → Minor resistance
147.956 → Stronger resistance
148.637 & 150.140 → Major upside targets
Bearish Scenario (if JPY strengthens):
146.450 → Immediate support
145.780 → Next key support
Context:
August Seasonal Trend: JPY often sees volatility in August due to fiscal flows and BoJ policy expectations.
Trading View Indicator: Likely referencing a custom strategy (e.g., breakout/mean reversion).
Trading Bias:
Neutral to Slightly Bearish (price closed below open, testing mid-range levels).
Watch 146.450 (support) and 147.170 (resistance) for breakout confirmation.
Key Levels:
Resistance Support
147.170 146.450
147.956 145.780
148.637
Actionable Idea:
A break below 146.450 could target 145.780.
A rebound above 147.170 opens path to 147.956.
