JPYUSD trade ideas
USDJPY SELLUSD/JPY rises further and approaches 148.00 as the US Dollar firms up
The US Dollar rallies for the second consecutive day against the Yen, and approaches 148.00. Strong US data support the Fed's "wait and see" stance and underpin demand for the US Dollar. In Japan, the uncertain political context is likely to deter the BoJ from hiking interest rates further.
Previous market optimism is turning into caution as the market shifts its focus to the monetary policy reports by the Bank of Japan and the US Federal Reserve due next week.
The Fed is widely expected to leave interest rates unchanged next week, more so after the strong US business activity and Jobless Claims figures released on Thursday. These data confirmed that the US economy remains resilient with a healthy labour market, which gives further leeway for the Fed to await further insight into the impact of tariffs before resuming rate cuts. The US Dollar has been trading higher following Thursday’s releases.
Also on Thursday, US President Trump paid an unusual visit to the Federal Reserve, only a few days ahead of their monetary policy meeting. Trump complained about the overcosts of the headquarters’ renovation and pressed for a less restrictive monetary policy, but his unusually soft comments after the visit eased investors’ concerns about the previous attacks on the central bank's independence.
In Japan, the somewhat softer Tokyo inflation figures seen on Friday and the trade deal would help the BoJ to continue hiking interest rates, but the bank is likely to stand pat next week and probably delay further monetary tightening until the political situation clarifies. This is likely to keep the Yen upside attempts subdued in the near-term.
SUPPORT 147.642
SUPPORT 147.311
SUPPORT 146.854
RESISTANCE 148.206
RESISTANCE 147.972

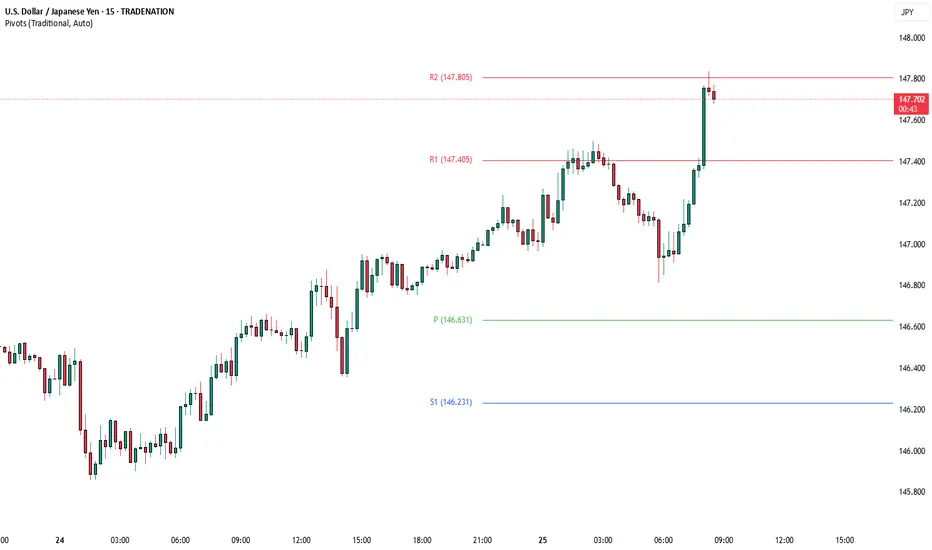
USDJPY Under Pressure! SELL!
My dear subscribers,
My technical analysis for USDJPY is below:
The price is coiling around a solid key level - 147.83
Bias - Bearish
Technical Indicators: Pivot Points High anticipates a potential price reversal.
Super trend shows a clear sell, giving a perfect indicators' convergence.
Goal - 147.34
My Stop Loss - 148.12
About Used Indicators:
By the very nature of the supertrend indicator, it offers firm support and resistance levels for traders to enter and exit trades. Additionally, it also provides signals for setting stop losses
Disclosure: I am part of Trade Nation's Influencer program and receive a monthly fee for using their TradingView charts in my analysis.
———————————
WISH YOU ALL LUCK

USDJPY: Confirmed CHoCH & Bullish OutlookI spotted a confirmed Change of Character on 📈USDJPY on 4-hour timeframe.
The market, currently in a global bullish trend, has effectively broken through a minor bearish trend and surpassed a key horizontal resistance level.
It is likely to continue rising, with the next resistance at 149.00.

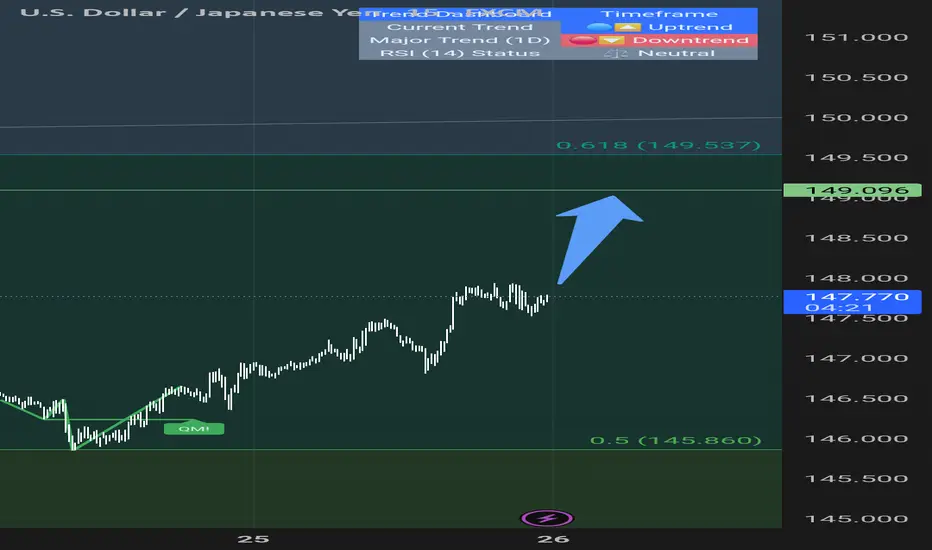
USDJPY BUY OPPORTUNITY Price provides us with a buy opportunity from the current market price as we see a continuous rise in buy momentum . We’re looking at seeing this momentum reach a high of 151.083 a buy opportunity is envisaged from the current price.

The Day AheadFriday, July 25 – Financial Market Summary (Trading Focus)
Key Data Releases:
US
June Durable Goods Orders: A leading indicator of manufacturing activity. Strong growth may boost USD and treasury yields; weak numbers could fuel rate-cut bets.
July Kansas City Fed Services Activity: Gauges regional service sector performance, often a directional cue for sentiment in broader Fed outlook.
UK
July GfK Consumer Confidence: Measures household sentiment. A decline may pressure GBP as it hints at cautious spending.
June Retail Sales: A key gauge of consumer demand. Surprises could move GBP sharply, especially amid BoE rate-cut speculation.
Japan
July Tokyo CPI: A leading inflation gauge ahead of the national print. Hotter data may raise doubts about BoJ’s ultra-loose stance.
June Services PPI: Measures business input costs; could signal future CPI pressure.
Eurozone
Germany July Ifo Survey: Monitors German business sentiment. Markets use this as a proxy for Eurozone economic health. Weakness can weigh on EUR and Bunds.
France/Italy Confidence Surveys: Consumer and manufacturing sentiment—important for pricing growth expectations across the bloc.
June M3 Money Supply: Closely watched by ECB for inflation outlook.
Central Bank:
ECB Survey of Professional Forecasters: Key for insight into market inflation expectations, growth, and rate paths—could shift EUR and European yields.
Earnings – Market Movers:
HCA Healthcare: Strong US economic bellwether; watch for comments on consumer healthcare trends.
Charter Communications: Cable/streaming sector in focus—guidance may affect tech/media sentiment.
Volkswagen: Global auto demand barometer—insight into EV strategy, China exposure.
NatWest: UK-focused bank—comments on credit conditions and loan demand will influence GBP and FTSE sentiment.
Eni: Energy major—production guidance, commodity price outlooks will move oil-sensitive equities and possibly EUR.
Trading Implications:
Focus on US durable goods for risk-on/risk-off bias.
Eurozone sentiment and ECB inflation forecasts could reset EUR expectations.
UK data dump will be crucial for GBP direction amid BoE policy divergence.
Earnings from global cyclicals (Volkswagen, Eni) and banks (NatWest) may sway sectoral rotation.
This communication is for informational purposes only and should not be viewed as any form of recommendation as to a particular course of action or as investment advice. It is not intended as an offer or solicitation for the purchase or sale of any financial instrument or as an official confirmation of any transaction. Opinions, estimates and assumptions expressed herein are made as of the date of this communication and are subject to change without notice. This communication has been prepared based upon information, including market prices, data and other information, believed to be reliable; however, Trade Nation does not warrant its completeness or accuracy. All market prices and market data contained in or attached to this communication are indicative and subject to change without notice.
USDJPY - Sell SetupI am expecting a sell setup for this pair at the 61.8 retracement of the previous swing.

USDJPY 30Min Engaged ( Bullish Entry Detected )————-
➕ Objective: Precision Volume Execution
Time Frame: 30-Minute Warfare
Entry Protocol: Only after volume-verified breakout
🩸 Bullish From now Price : 146.500
➗ Hanzo Protocol: Volume-Tiered Entry Authority
➕ Zone Activated: Dynamic market pressure detected.
The level isn’t just price — it’s a memory of where they moved size.
Volume is rising beneath the surface — not noise, but preparation.
🔥 Tactical Note:
We wait for the energy signature — when volume betrays intention.
The trap gets set. The weak follow. We execute.

USDJPY 30Min Engaged ( Buy & Sell Reversal Entry's Detected )————-
➕ Objective: Precision Volume Execution
Time Frame: 30-Minute Warfare
Entry Protocol: Only after volume-verified breakout
🩸 Bullish Reversal : 146.450
🩸 Bearish Reversal : 147.350
➗ Hanzo Protocol: Volume-Tiered Entry Authority
➕ Zone Activated: Dynamic market pressure detected.
The level isn’t just price — it’s a memory of where they moved size.
Volume is rising beneath the surface — not noise, but preparation.
🔥 Tactical Note:
We wait for the energy signature — when volume betrays intention.
The trap gets set. The weak follow. We execute.

BUY USDJPYThe price drop on UJ has been wild however price is at a good support zone, we see the ABCD pattern by way of a bullish Fibonacci invasion setup hoping it will give good liquidity. Buy wisely.

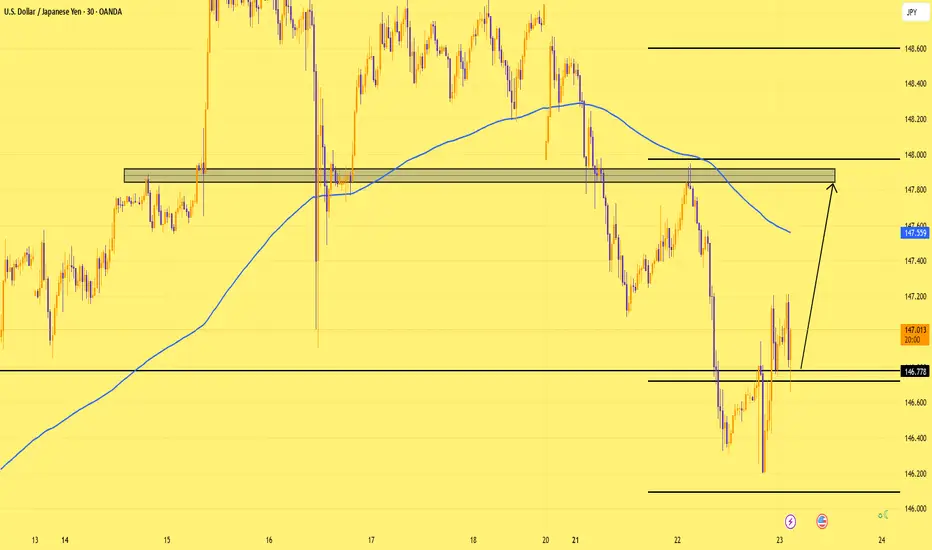
USDJPY: Back to the Shelf Before Lift-Off?Price might drop a little at the open, but I don’t expect it to go far.
Support is around 146.77—if it holds, we could see a move back up toward 147.80.
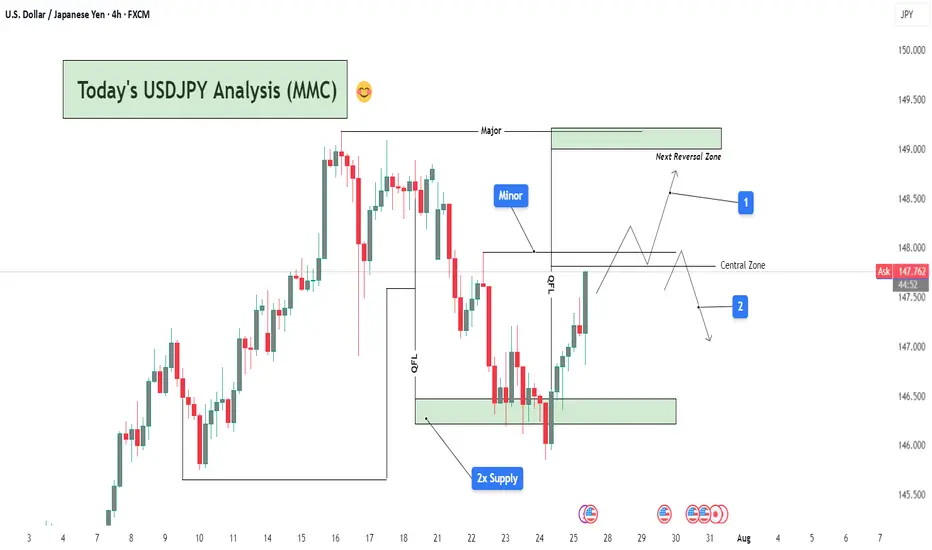
USDJPY Analysis : Smart Money Setup & MMC Concept + Target📌 Chart Overview:
This 4H USDJPY chart presents a multi-phase market structure analysis rooted in MMC (Major-Minor-Central) framework, Smart Money Concepts (SMC), and liquidity mapping. The price is currently trading around 147.39, and the chart outlines two possible scenarios labeled 1 (bullish continuation) and 2 (bearish rejection).
🔍 Key Zones & Technical Elements Explained:
🔹 1. 2x Supply Zone (Support Reaction)
Price rebounded sharply from the double-tested demand zone marked around 146.00–146.50.
This zone has historical significance and has acted as a base for previous bullish momentum.
The sharp V-shaped recovery suggests strong buying interest at institutional levels, hinting at a potential bullish continuation.
🔹 2. QFL (Quick Flip Liquidity) Zone
A notable zone where previous bullish structure broke down. It’s now being retested from below.
The QFL structure acts as a hidden supply zone or potential liquidity trap.
Watch for price rejection here, especially if it aligns with liquidity sweep patterns.
🔹 3. Minor & Major Structural Levels
Minor zone: A smaller consolidation and reaction zone—used to observe minor trend shifts or scaling entries.
Major zone: Sitting around 148.50–149.00, this is your Next Reversal Zone. It overlaps with a historical resistance area and could lead to a significant reaction.
📈 Projected Scenarios:
✅ Scenario 1: Bullish Continuation
Price breaks above the Central Zone and holds.
After breaching the minor resistance, it climbs towards the Major Reversal Zone (148.50–149.00).
There, we look for:
Either a reversal trade setup (liquidity grab + bearish confirmation).
Or continuation beyond 149.00, especially if supported by USD strength/fundamentals.
🚫 Scenario 2: Bearish Rejection
Price fails to hold above the Central Zone.
Rejection at QFL or Minor levels sends the pair back into the mid-147s and potentially down to retest the 2x Supply Zone again.
Breakdown from there could lead to a move towards 145.50–146.00, forming a potential double bottom or deeper retracement.
🧩 Technical Insights Summary:
Trend Context: Short-term bullish recovery from demand, but macro trend still uncertain.
Key Confluence:
2x Supply → Strong demand.
QFL + Central → Key breakout/rejection zones.
Major Zone → High-probability reversal area.
Bias: Neutral to Bullish, favoring Scenario 1 if price sustains above 147.50.
Watch for:
Candlestick rejections in Major Zone.
Break-and-retest behavior in Central Zone.
USD-related news near July 30–31 (highlighted below chart).

25.07.25 Morning ForecastPairs on Watch -
FX:USDJPY
CAPITALCOM:DE40
FX:GBPUSD
FX:AUDUSD
A short overview of the instruments I am looking at for today, multi-timeframe analysis down to what I will be looking at for an entry. Enjoy!


UJ Exexcution Flow| 5M OB Setup in MotionPair: USDJPY
Bias: Bullish
Timeframes: 30M / 5M
Top-down structure respected cleanly across the board — from HTF to LTF, price has been flowing exactly as forecasted. After confirming the bearish LH break and structure flip, we’re now in a bullish leg with intent clearly shown on the lower timeframes.
Currently waiting for price to mitigate the marked 5M order block for precise execution. Entry is valid and backed by structural logic — no guessing, just following what price has already confirmed.
Entry Zone: 5M OB (confirmed after LH break + LTF intent) Target: Clean 5M highs
Mindset Note: Analysis mode done. Execution mode engaged. I let price lead — I just follow structure.
Bearish Bias on USD/JPYBearish Bias on USD/JPY
Pair: USD/JPY
Bias: Bearish
Entry Type: Pending Sell Limit Order
Entry Zone: 147.54
Stop Loss: 148.10
Take Profit: 145.17
Technical Rationale:
Market Structure Shift (MSS):
The chart shows a clear break of structure (BoS) to the downside after a prolonged bullish move. The most recent lower low and lower high formation confirms a shift in market sentiment.
Supply Zone (Order Block):
Price is retracing back into a 2H supply zone (highlighted red), which is aligned with a bearish order block around 147.54–148.10. This zone represents institutional selling interest from a previous strong sell-off.
Liquidity Grab / Sweep:
Prior to the drop, there was an internal liquidity sweep above a local high, potentially indicating a buy-side liquidity grab. The retracement may now be engineered to tap into this supply zone to mitigate orders before a continuation downward.
Premium Pricing:
Using a FVG (Fair Value Gap) or Fibo level reference, this supply zone sits in the premium pricing area, ideal for institutional short positioning in SMC theory.
Confluence:
Bearish break of structure
Return to supply zone
Liquidity sweep before drop
Fair value gap alignment

Confirmed Breakout SetupThe 1-hour candle **closed cleanly and strongly** above the 147.050 resistance zone. No upper wick rejection, no weakness

[USDJPY] Trade ideaJust entered this long position on this forex pair for an upside move.
Trying to catch the continuation of the trend on reversal pattern.
Great Trade !

A PICTURE OF THE SURPOSE BULLISH MOVEMENT As analyzed in my previous poste , we had some quick fakes outs but the direction was confirmed to be bullish.
as we see we hope to ride it to the TF
THE TREND IS YOUR FRIEND

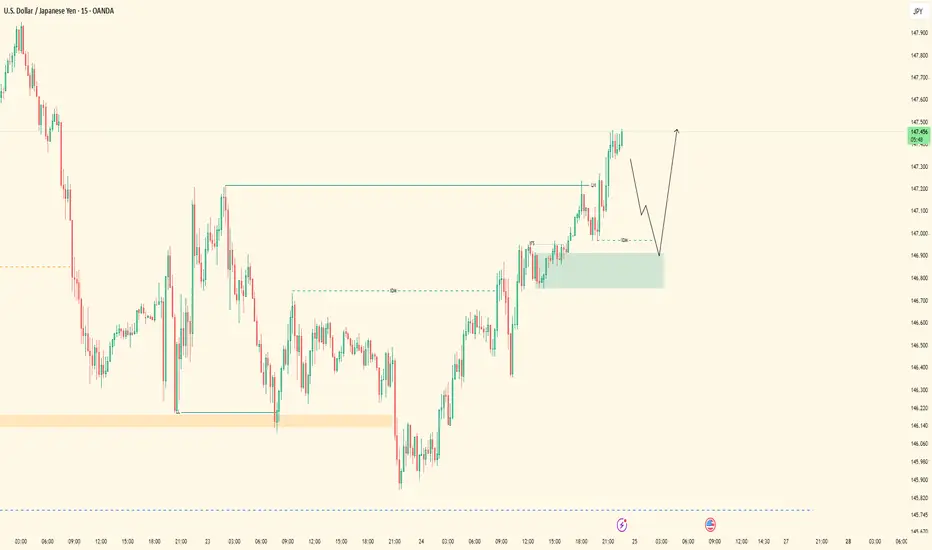
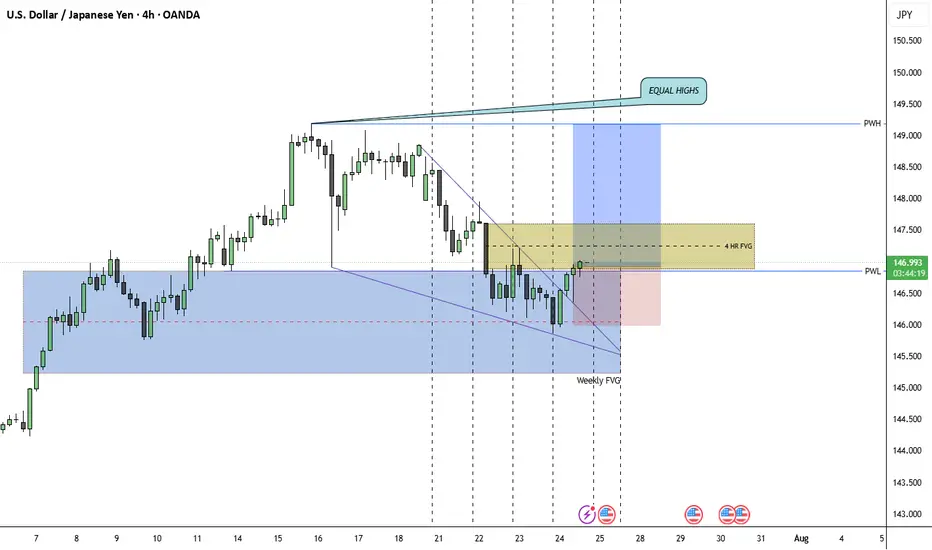
Bullish on usdjpyI am currently long USDJPY. It's Thursday, and there’s still plenty of buy-side liquidity left. The highs from Monday, Tuesday, and Wednesday remain unchallenged. We've also traded into a weekly PD array (weekly FVG), respecting the C.E. and moving away, which signals a local low for me. Additionally, we're breaking out of a falling wedge, with the breakout target being the top of the wedge. Lastly, DXY is beginning to show bullish market structure shifts on the 15m and 1h timeframes. I am targeting those relative equal highs. Invalidation lies at the most recent swing low.
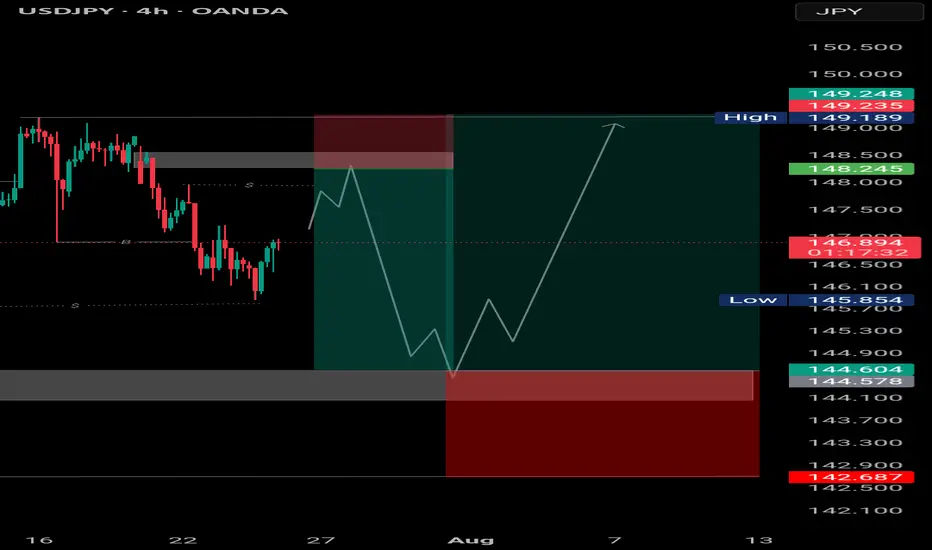
Sell to Buy UJ"USDJPY 4H Setup: Waiting for liquidity sweep below 145 before targeting 148.2+ 📈
Patience is key — let price come to you. Watching demand reaction closely before executing
SIMPLEST SELL SETUP YOU'VE EVER SEEN...POTENTIAL USDJPY SHORTSHey hey Tradingview community!!! Hope you are all doing amazing! Just wanted to do a very detailed and complex breakdown for potential swing short opportunities I see for USDJPY...let's dive in!!
OK so first....lol
I'm kidding. Very simple. Look at the chart. Mark those zones to look for shorts. Swing trading opportunity...Love you all!!
Cheers!
OH...if you need the RSI settings it is the 7 period deviation. Cheers pt. 2!
