USDJPYUSDJPY continues to show solid bullish momentum, with price respecting higher lows and breaking through resistance zones cleanly. The market structure remains strong, supported by steady buying pressure and positive sentiment around the U.S. dollar. As long as support levels hold, the path of least resistance remains to the upside, with potential for continued gains in the short to medium term.
JPYUSD trade ideas
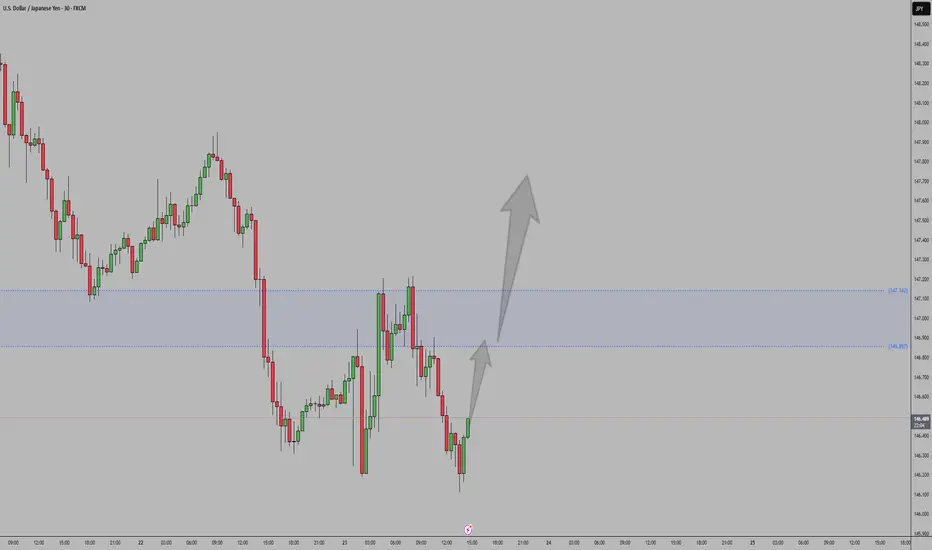
It is a buy position.Let’s wait calmly, let the market prove itself, and then ride the move with discipline.

USD/JPY) bearish Trend Read The captionSMC Trading point update
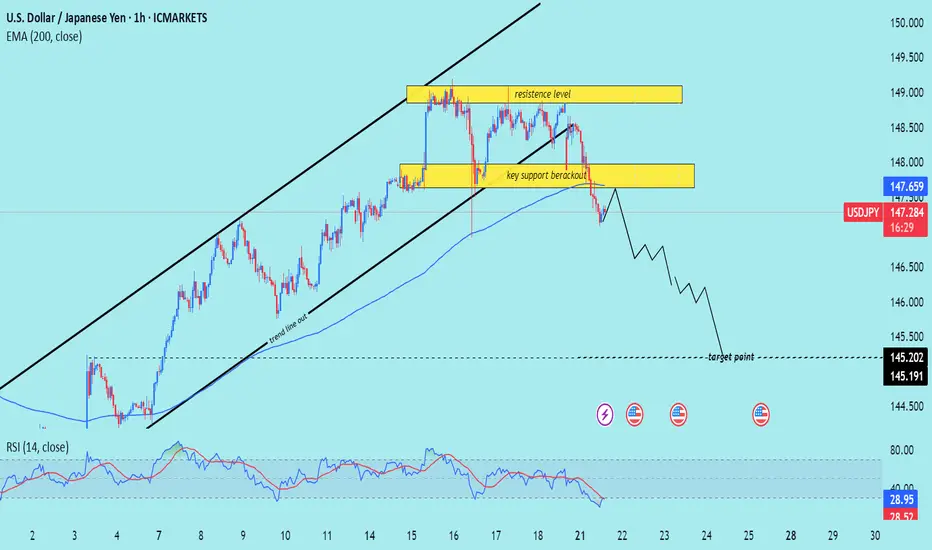
Technical analysis of USD/JPY on the 1-hour timeframe, signaling a potential drop toward the 145.200 – 145.191 target zone. Here's the detailed breakdown:
---
Technical Analysis – USD/JPY (1H)
1. Rising Channel Breakdown
Price has broken below an ascending channel, confirming a trend line breakout and signaling a trend shift from bullish to bearish.
The trend line cut and rejection from the upper resistance zone support the bearish reversal.
2. Key Support Breakout
A crucial horizontal support zone around 147.80–148.00 was broken.
The break-and-retest of this area (yellow box) acts as a confirmation of bearish momentum continuation.
3. Bearish Momentum Below EMA
Price is trading below the 200 EMA (147.659) — a strong signal of downward bias on this timeframe.
The EMA has flipped from dynamic support to resistance.
4. RSI Oversold but Bearish
RSI is at 29.41, in oversold territory, which may hint at a short-term bounce.
However, the broader structure suggests more downside potential before a deeper retracement.
5. Target Projection
Projected target zone is between 145.200–145.191, aligning with previous structure lows and likely liquidity zone.
Mr SMC Trading point
Summary
Bias: Bearish
Current Price: 147.307
Key Resistance: 147.80–148.60 zone
Structure: Rising channel break + key support breakout
200 EMA: Above price (bearish signal)
RSI: 29.41 – oversold but momentum remains bearish
Target: 145.200–145.191
Please support boost 🚀 this analysis)
USDJPY Possible BEARISH setup🚀 USDJPY UPDATE: Bearish Setup
Summary:
Analysing price action from yesterday, breakout from the Daily timeframe accumulation zone has materialized with strong conviction.
TRADE SETUP Metrics:
- Entry: ✅
- Stop loss - Above Resistance Zone
- Target 1: (R:R 1:2)🎯
- Target 2: (R:R 1:3)🎯
- Target 3: (R:R 1:4)🎯
Technical Anticipations:
- Price action to show a Bearish follow-through
- Resistance zone to hold
Position Management:
- partial profits secured at Target 1
- Stop loss adjusted to breakeven upon reaching Targets
- Full Exit at Target 3
LIKE or COMMENT if this idea sparks your interest, or share your thoughts below!
FOLLOW to keep up with fresh ideas.
Tidypips: "Keep It Clean, Trade Mean!"

USDJPY short position 23/07/2025English : According to our analysis, we anticipate a bearish scenario.
Morocan Darija : kanchofo d'apres l'analyse dyalna antsanaw hboot
ATENTION : I only share my ideas, not signals

USD/JPY FORCAST 23-7📉 On the daily timeframe, price action confirms a potential start of a new bearish cycle.
🔄 Previous Cycle Breakdown:
Phase 3 (Impulsive Downtrend):
📅 Jan 8 → Mar 6
⏱️ ~41 daily candles
Phase 6 (Correction):
📅 Mar 6 → Mar 30
⏱️ ~20 daily candles
Phase 9 (Distribution/Exhaustion):
📅 ~16 daily candles, ending Apr 21
This marked the completion of a full cycle, triggering a shift in behavior.
🔁 What happened next?
A Reaccumulation / Manipulation phase began immediately after the cycle ended — which is normal after full cycle completion.
This reaccumulation lasted around 62 daily candles, building up pressure and liquidity.
> 80% of market movement is corrective or consolidative.
Only 20% (or less) is pure trend.
If you’re only looking for trends, you’re missing the actual map.
⚠️ Current Outlook: on the 1hr timeframe
As we now enter the final time pivot of the month — specifically beginning July 22 at 16:00 —
the market is signaling the start of a new Phase 3 (bearish impulsive wave).
usd/jpy may reach 141.453 before 1st of August.
I think this is the time to sell usd , or buy any other currencies or metal against usd
What’s your view? Are you trading with time or against it?

update : usd/jpy forcast 23th Jul📉 On the daily timeframe, price action confirms a potential start of a new bearish cycle.
🔄 Previous Cycle Breakdown:
Phase 3 (Impulsive Downtrend):
📅 Jan 8 → Mar 6
⏱️ ~41 daily candles
Phase 6 (Correction):
📅 Mar 6 → Mar 30
⏱️ ~20 daily candles
Phase 9 (Distribution/Exhaustion):
📅 ~16 daily candles, ending Apr 21
This marked the completion of a full cycle, triggering a shift in behavior.
🔁 What happened next?
A Reaccumulation / Manipulation phase began immediately after the cycle ended — which is normal after full cycle completion.
This reaccumulation lasted around 62 daily candles, building up pressure and liquidity.
> 80% of market movement is corrective or consolidative.
Only 20% (or less) is pure trend.
If you’re only looking for trends, you’re missing the actual map.
⚠️ Current Outlook: on the 1hr timeframe
As we now enter the final time pivot of the month — specifically beginning July 22 at 16:00 —
the market is signaling the start of a new Phase 3 (bearish impulsive wave).
usd/jpy may reach 141.453 before 1st of August.
I think this is the time to sell usd , or buy any other currencies or metal against usd
What’s your view? Are you trading with time or against it?

USDJPY → Hunting for liquidity before the fallFX:USDJPY is changing its local trend and succumbing to global pressure. The market is seeing a change in price movement following the decline in the dollar index...
The trend has broken and the price movement has turned bearish. The fall in the dollar index is allowing the Japanese yen to strengthen, which is generally negative for the currency pair. The decline may continue after a slight correction.
Fundamentally, the dollar is correcting amid uncertainty due to the tariff war, as well as expectations of interest rate cuts.
Resistance levels: 147.20, 147.89
Support levels: 145.85, 145.23
As part of the correction, the price may test the liquidity zone of 147.7 or 0.7f. A false breakout and consolidation of the price in the selling zone may trigger a further decline in both the short and medium term.
Best regards, R. Linda!

Major resistance ahead?USD/JPY is rising towards the pivot and could reverse to the 1st support which aligns with the 50% Fibonacci retracement.
Pivot: 147.67
1st Support: 145.89
1st Resistance: 149.03
Risk Warning:
Trading Forex and CFDs carries a high level of risk to your capital and you should only trade with money you can afford to lose. Trading Forex and CFDs may not be suitable for all investors, so please ensure that you fully understand the risks involved and seek independent advice if necessary.
Disclaimer:
The above opinions given constitute general market commentary, and do not constitute the opinion or advice of IC Markets or any form of personal or investment advice.
Any opinions, news, research, analyses, prices, other information, or links to third-party sites contained on this website are provided on an "as-is" basis, are intended only to be informative, is not an advice nor a recommendation, nor research, or a record of our trading prices, or an offer of, or solicitation for a transaction in any financial instrument and thus should not be treated as such. The information provided does not involve any specific investment objectives, financial situation and needs of any specific person who may receive it. Please be aware, that past performance is not a reliable indicator of future performance and/or results. Past Performance or Forward-looking scenarios based upon the reasonable beliefs of the third-party provider are not a guarantee of future performance. Actual results may differ materially from those anticipated in forward-looking or past performance statements. IC Markets makes no representation or warranty and assumes no liability as to the accuracy or completeness of the information provided, nor any loss arising from any investment based on a recommendation, forecast or any information supplied by any third-party.

Pound Hits $1.35 on Weaker DollarThe pound climbed to $1.35, supported by a weaker dollar and cautious positioning ahead of the August 1 U.S. tariff deadline. Investors expect UK economic data to show improving momentum, while the Bank of England may scale back bond sales due to weak demand. Despite the optimism, markets still price in two BoE rate cuts in 2025.
Resistance stands at 1.3550, with support at 1.3380.

US-Japan Deal Supports YenThe yen held firm near 146.5 per dollar, its highest level in two weeks, after President Trump announced a trade agreement with Japan featuring 15% tariffs on exports. Japan, in turn, pledged $550 billion in U.S. investments and increased access for American goods. Prime Minister Ishiba’s lack of details and speculation about his possible resignation add further political uncertainty, especially after the coalition’s upper house defeat.
Resistance is at 147.75, with major support at 146.15.
USDJPY 2H Analysis : Trendline Break or Double the Supply?🧠 Market Context:
The market has recently undergone a liquidity grab followed by a temporary bullish reaction, indicating that large players (institutions or market makers) are manipulating price around sensitive zones before committing to a direction.
🧱 Key Technical Zones & Observations:
🟩 1. Liquidity Filled Zone (Smart Money Move)
Location: Around July 17.
Explanation: Price dropped impulsively into a pre-marked liquidity pocket. This filled buy-side liquidity resting below previous lows.
Implication: Smart money has now captured trapped breakout sellers. Expectation of reversal or bullish mitigation.
🟧 2. Central Zone (Supply/Distribution Area)
This zone was tested multiple times, signaling it as a supply-rich region.
Acted as a base for previous strong bearish move.
If the trendline is broken, price may retest this Central Zone, potentially acting as resistance again.
🟩 3. QFL Formation (Quantity Following Line)
Nature: Base breakout with a fast snap-back indicates institutional demand.
The structure signals a failed breakdown or liquidation trap.
Actionable Insight: Strong bounce potential here, ideal for sniper long entries if market structure shifts bullish.
🟦 4. Trendline (Critical Validation Tool)
The descending trendline from July 18 has acted as dynamic resistance.
Multiple rejections validate its significance.
Main Conditional Setup hinges on this trendline:
Break = Bullish structure shift
No break = Trend continuation (retest of demand or breakdown)
🔁 5. Previous Reversal Completed
Price action has printed a reversal model (possibly Wyckoff-style accumulation or spring).
Completion of the pattern aligns with upcoming directional decision.
✅ Conditional Trade Scenarios:
🔺 Condition 1: Bullish Breakout Above Trendline
Setup: Price breaks and closes above the trendline with volume and momentum.
Action: Buy on retest of broken trendline or confirmation candle.
Targets:
Short-term: 147.50
Major: 148.00 – strong resistance/supply zone
Validation: Structure shift + momentum + rejection of prior supply.
🔻 Condition 2: Rejection from Trendline (Trendline Holds)
Setup: Price respects the trendline and fails to break.
Action: Short on bearish engulfing/rejection.
Plan: "Double the supply zone" as per your label.
Targets: 146.20 → 146.00 zone
This respects the previous price memory and liquidity void.
🧠 Deeper MMC Insight:
The market is in indecision phase, balancing between continuation and reversal.
Institutional footprints (QFL + liquidity fills + trendline rejections) suggest preparation for a trap-spring-accumulate or distribution-breakdown move.
Watch for fakeouts around the trendline – MMC logic says market makers often induce both directions before committing.
🧭 Trade Management Tips:
If long: Protect below the QFL base.
If short: Watch for manipulation around the Central Zone.
Wait for confirmation: Don’t pre-enter before structure validates direction.

USD/JPY PROBABLY !Waiting for confirmation on candles and Real Volume 5min or 15min (power of Real Volume)-without real volume I am like a blind man in a dense forest :)
Tools:
- real volume (proper interpretation)
- Fibonacci expansion ABC (an additional, new goal every day)
- Fibonacci retracement (combined with the real volume, it shows me the real probable movement for the next hours and days)
- volume support and resistance levels (confirmation of the price recovery level)
- oversold/overbought index (focusing on 1H and 4H something is already overvalued or undervalued)
- candlestick patterns (my entry point for 5 minutes or 15 minutes candlestick formations confirmed by particularly increasing volume).

USD/JPY: Bearish Setup Looms Below VWAP ZoneUSD/JPY dipped as expected, currently testing the VWAP as support while Stochastic signals the Yen is overpriced in the short term.
Resistance is at 147.6, backed by the bearish VWAP. It is likely the pair will rise and test this level. Furthermore, a new bearish wave can potentially emerge if 147.6 holds. In this scenario, the next target could be the support at 145.8 followed by 144.2.

USDJPY - BEARISH MOVE !Hello Traders !
The USDJPY failed to create a new higher high!
The price broke the support line!
So, I expect a bearish move📉
__________________
TARGET: 146.300🎯


The Day Ahead Economic Data
US June Existing Home Sales (10:00 ET): Will gauge housing demand resilience amid high mortgage rates. A weaker print may support rate cut expectations.
Eurozone July Consumer Confidence (Flash): Important for sentiment around ECB rate policy. Any downside surprise could weigh on the euro.
Central Banks
BoJ’s Uchida Speaks: Watch for any shift in tone post-yield curve control tweak. A hawkish slant may support JPY and pressure Japanese equities.
Earnings – High-Impact Reports
Tech & Comms:
Alphabet (GOOGL), Tesla (TSLA), IBM, T-Mobile US (TMUS) – Key for Nasdaq sentiment and AI/cloud/EV momentum.
Industrial & Energy:
GE Vernova, Equinor, Freeport-McMoRan – Outlooks can move energy, copper, and renewables sectors.
Financials & Payments:
Fiserv, UniCredit – Insight into global payment volumes and eurozone banking resilience.
Consumer & Healthcare:
Chipotle, Hilton, Thermo Fisher, Boston Scientific – Consumption trends, travel recovery, and health sector resilience in focus.
Fixed Income
US 20-Year Bond Auction (13:00 ET): Watch for demand metrics (bid-to-cover, indirect bids). Weak take-up could push yields higher and pressure equities.
This communication is for informational purposes only and should not be viewed as any form of recommendation as to a particular course of action or as investment advice. It is not intended as an offer or solicitation for the purchase or sale of any financial instrument or as an official confirmation of any transaction. Opinions, estimates and assumptions expressed herein are made as of the date of this communication and are subject to change without notice. This communication has been prepared based upon information, including market prices, data and other information, believed to be reliable; however, Trade Nation does not warrant its completeness or accuracy. All market prices and market data contained in or attached to this communication are indicative and subject to change without notice.

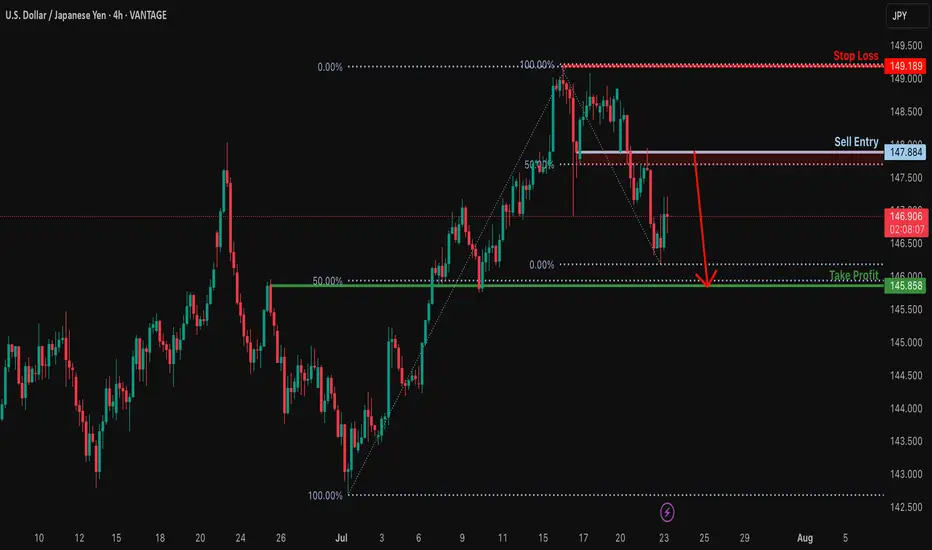
Bearish reversal off overlap resistance?USD/JPY is rising towards the resistance level which is an overlap resitance that is slightly above the 50% Fibonacci retracement and could reverse from this level to our take profit.
Entry: 147.88
Why we like it:
There is an overlap resistance that is slight.y above the 50% Fibonacci retracement.
Stop loss: 149.18
Why we like it:
There is a swing high resistance.
Take profit: 145.85
Why we like it:
There is an overlap support that lines up with the 50% Fibonacci retracement.
Enjoying your TradingView experience? Review us!
Please be advised that the information presented on TradingView is provided to Vantage (‘Vantage Global Limited’, ‘we’) by a third-party provider (‘Everest Fortune Group’). Please be reminded that you are solely responsible for the trading decisions on your account. There is a very high degree of risk involved in trading. Any information and/or content is intended entirely for research, educational and informational purposes only and does not constitute investment or consultation advice or investment strategy. The information is not tailored to the investment needs of any specific person and therefore does not involve a consideration of any of the investment objectives, financial situation or needs of any viewer that may receive it. Kindly also note that past performance is not a reliable indicator of future results. Actual results may differ materially from those anticipated in forward-looking or past performance statements. We assume no liability as to the accuracy or completeness of any of the information and/or content provided herein and the Company cannot be held responsible for any omission, mistake nor for any loss or damage including without limitation to any loss of profit which may arise from reliance on any information supplied by Everest Fortune Group.
USD/JPY – Bearish Rejection After Channel BreakUSD/JPY – Bearish Rejection After Channel Break
🔹 2H Chart Analysis by PULSETRADESFX
USD/JPY has broken down from a rising channel and is now rejecting a key supply zone around 147.000 – 147.250. The pair is showing early signs of bearish continuation after retesting this zone as resistance.
This setup favors short positions targeting deeper levels, especially with price failing to reclaim the broken structure.
📌 Trade Setup:
Entry: 146.808
Stop Loss: 147.350 (Above supply zone)
TP1: 146.000 (Recent low)
TP2: 145.250 (Demand support)
TP3: 144.300 (Major structural zone)
This is a clean break–retest–continuation scenario with risk-to-reward aligning well for short-term and swing traders.
✅ Bearish Confluences:
Rising channel break
Supply zone rejection
Lower high structure
Bearish engulfing reaction
TP levels mapped to recent price memory zones
📅 July 23, 2025
📊 CMC Markets Feed | USD/JPY (2H)
#USDJPY #ForexAnalysis #BearishBreakdown #TechnicalSetup #PriceAction #TradingView #PULSETRADESFX

Retracement then bearsish.Waitn for my setup, potential hns, retrace to the area of my interest. And down down.
hi everyone im away from the desk but we are still waiting for that short area of 147.590 on the short term trade. long term short trade still waiting for that daily FVG / BOS zone of the 4hr. will share chart set up once back. happy trading everyone
refer to video as its showing all the information im looking at on a day to day
9
0 comments
Leave a comment that is helpful or encouraging. Let's master the markets together
Post

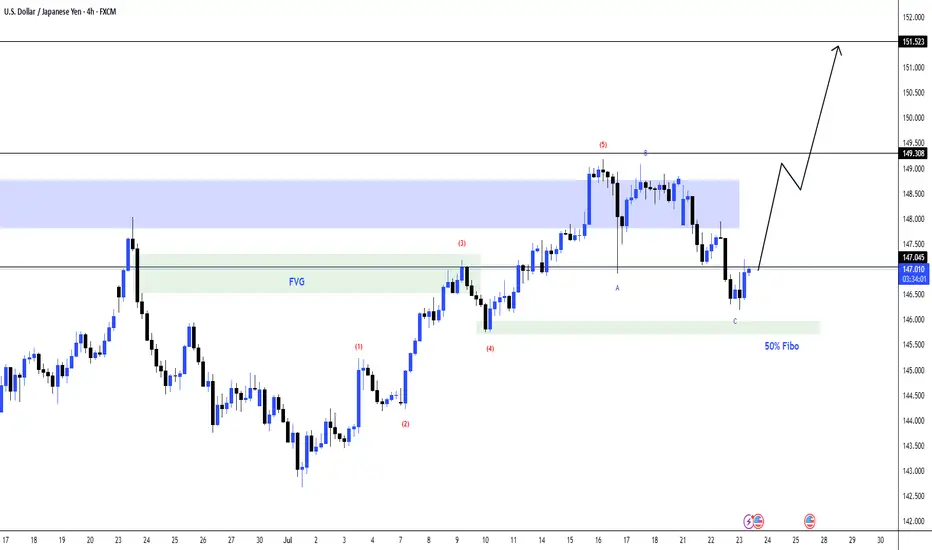
USDJPY 4H Chart Analysis – Bullish Setup in PlayThe USDJPY pair is currently showing signs of a bullish continuation after completing a corrective wave pattern (ABC) down into a strong confluence zone.
📌 Key Technical Insights:
✅ Wave Structure:
The market appears to have completed a 5-wave impulse up, followed by an ABC corrective pattern.
The final leg C has touched the 50% Fibonacci retracement level, aligning with a bullish reaction zone.
✅ Support & Confluence Zone:
Price retraced into the green demand zone marked around the 146.5 level.
This area also aligns with the Fair Value Gap (FVG) and the midpoint of the impulse leg, indicating strong demand interest.
✅ Fair Value Gap (FVG):
Price respected the FVG region twice – first as a breakout, now as a retest.
FVG acts as a dynamic support zone around 146.8–147.2.
✅ Key Resistance & Target Zones:
Immediate resistance lies at 149.30 (previous high and supply zone).
A breakout above this level can trigger a rally toward the 151.50 target, aligning with higher-timeframe resistance.
📈 Potential Bullish Pathway:
As shown on the projection path, price is expected to:
Hold above the 146.5–147.0 demand zone.
Retest 149.30 as resistance.
Continue to push higher toward 151.50, completing a larger bullish leg.
💬 Let me know your thoughts in the comments! Will USDJPY break 151 next?
#USDJPY #ForexAnalysis #ElliottWave #SmartMoney #PriceAction #FVG #TradingView #FX
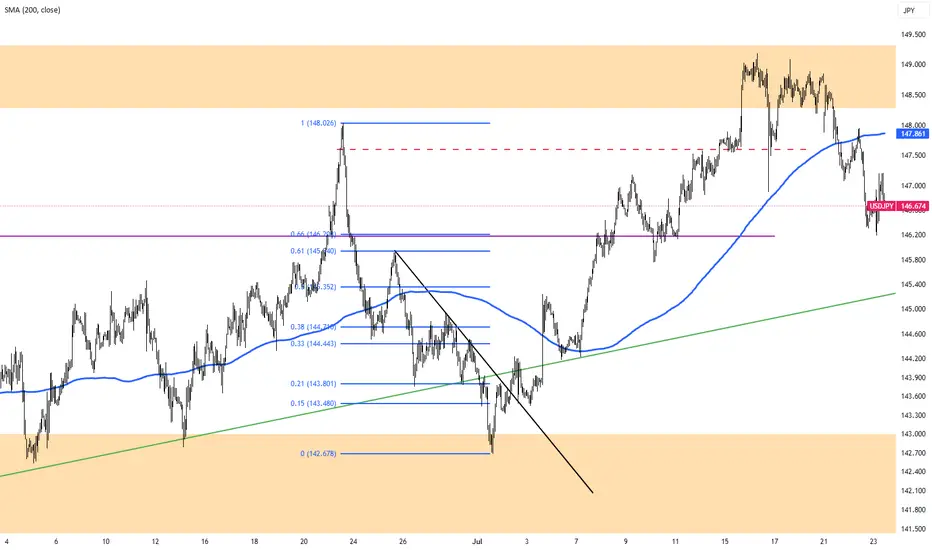
USDJPY - Bearish BiasThe USD/JPY market currently shows a clear downtrend, as indicated by the break of structure (x-bos) and lower lows formation. The price is expected to retrace upwards towards key smart money areas defined by Lower Time Frame (LTF) Supply Zones highlighted in purple.
Using Fibonacci retracement from the recent swing high to the swing low, key Fibonacci levels—especially around the 0.618 and 0.786 zones—align with these LTF Supply Zones, creating high-probability entry areas for short positions.
The trading plan anticipates a retracement into these supply zones, where bearish price action signals can confirm entries. The ultimate target is set near the previous strong low (around 145.821), aiming to ride the next leg down in alignment with the market structure.
Risk management should involve placing stop losses slightly above the upper boundary of the LTF Supply Zones to protect against false breakouts. Patience is emphasized by waiting for price to reach these confluence zones, combining Smart Money concepts and Fibonacci levels for optimal timing and risk-to-reward profile.

USDJPY is continuing its uptrend, let's BUY✏️ OANDA:USDJPY broke the price channel and continued its uptrend at 151,000. The previous h4 candle wick had a liquidity sweep to 147,000, showing that the buyers are dominating the market. The USDJPY trading strategy will mainly BUY to the old peak around 151,000. When the price breaks 147,000, a corrective downtrend will begin to form.
📉 Key Levels
Support: 148.200 - 147.200
Resistance: 150.100 - 151.100
Buy trigger: Breakout above 148,800
BUY 147,200 (buyer liquidity zone)
Target: 145,000
Leave your comments on the idea. I am happy to read your views.
