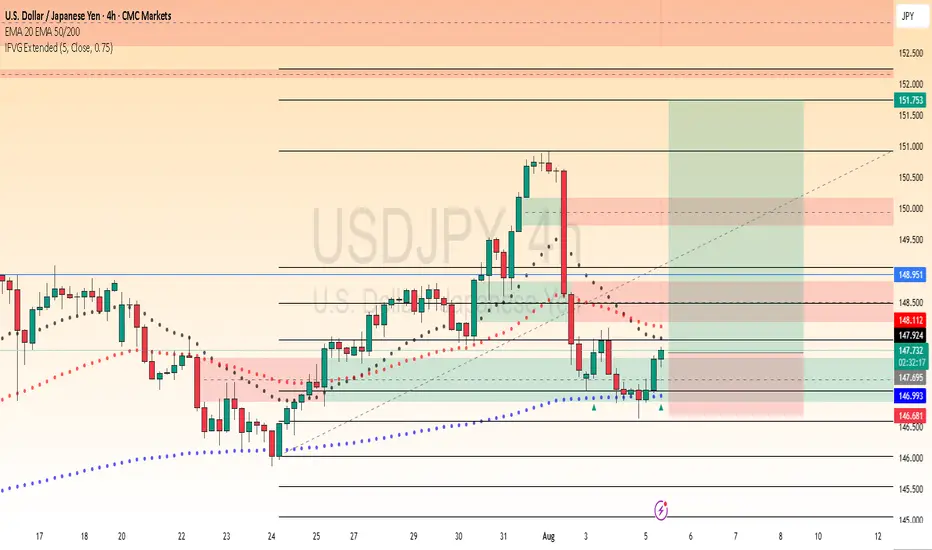
USDJPY Long Setup - Bullish Continuation ExpectedUSD/JPY is presenting a compelling long opportunity after a healthy pullback from recent highs. Multiple technical confluences suggest we're setting up for another leg higher.
Fibonacci Retracement: Price has bounced perfectly from the 0.886 Fibonacci level, showing strong institutional buying interest at this deep retracement level. This is a classic reversal zone that often marks the end of corrective moves.
IFVG (Institutional Fair Value Gap): We've seen a clean bounce from the IFVG below, indicating that institutional orders have been filled and buyers are stepping back in. This gap has acted as strong support.
200 EMA Confluence: The 200 EMA is coming up beautifully on the 4-hour timeframe, providing additional dynamic support. This moving average often acts as a magnet for price and confirms the bullish bias.
Daily Confirmation: We have a strong confirmation candle on the daily timeframe, showing buyers are in control and ready to push higher.
Market Structure Analysis
Price previously broke through strong resistance levels
The recent pullback appears to be a healthy retracement rather than a reversal
Market structure remains bullish with higher lows being formed
Trade Outlook
With these multiple confluences aligning, USD/JPY looks primed for a new leg higher. The combination of Fibonacci support, IFVG bounce, 200 EMA confluence, and daily confirmation creates a high-probability setup for bulls.
Expectation: New highs incoming as buyers regain control and push through previous resistance turned support.
Risk management is key - always use proper position sizing and stop losses.
This is not financial advice. Trade at your own risk.
JPYUSD trade ideas
USDJPY Breakout and Potential RetraceHey Traders, in today's trading session we are monitoring USDJPY for a selling opportunity around 148.300 zone, USDJPY was trading in an uptrend and successfully managed to break it out. Currently is in a correction phase in which it is approaching the retrace area at 148.300 support and resistance area.
Trade safe, Joe.

MORNING FORECASTING KEY LESSONSIn depth details on the things that you need to focus on when we are doing our morning forecasting as this is very important details to consider, do let me know in the comments sections below how do you find the video.

Bullish bounce off pullback support?USD/JPY is falling towards the pivot which has been identified as a pullback support and could bounce to the 1st resistance.
Pivot: 145.27
1st Support: 143.29
1st Resistance: 151.05
Risk Warning:
Trading Forex and CFDs carries a high level of risk to your capital and you should only trade with money you can afford to lose. Trading Forex and CFDs may not be suitable for all investors, so please ensure that you fully understand the risks involved and seek independent advice if necessary.
Disclaimer:
The above opinions given constitute general market commentary, and do not constitute the opinion or advice of IC Markets or any form of personal or investment advice.
Any opinions, news, research, analyses, prices, other information, or links to third-party sites contained on this website are provided on an "as-is" basis, are intended only to be informative, is not an advice nor a recommendation, nor research, or a record of our trading prices, or an offer of, or solicitation for a transaction in any financial instrument and thus should not be treated as such. The information provided does not involve any specific investment objectives, financial situation and needs of any specific person who may receive it. Please be aware, that past performance is not a reliable indicator of future performance and/or results. Past Performance or Forward-looking scenarios based upon the reasonable beliefs of the third-party provider are not a guarantee of future performance. Actual results may differ materially from those anticipated in forward-looking or past performance statements. IC Markets makes no representation or warranty and assumes no liability as to the accuracy or completeness of the information provided, nor any loss arising from any investment based on a recommendation, forecast or any information supplied by any third-party.

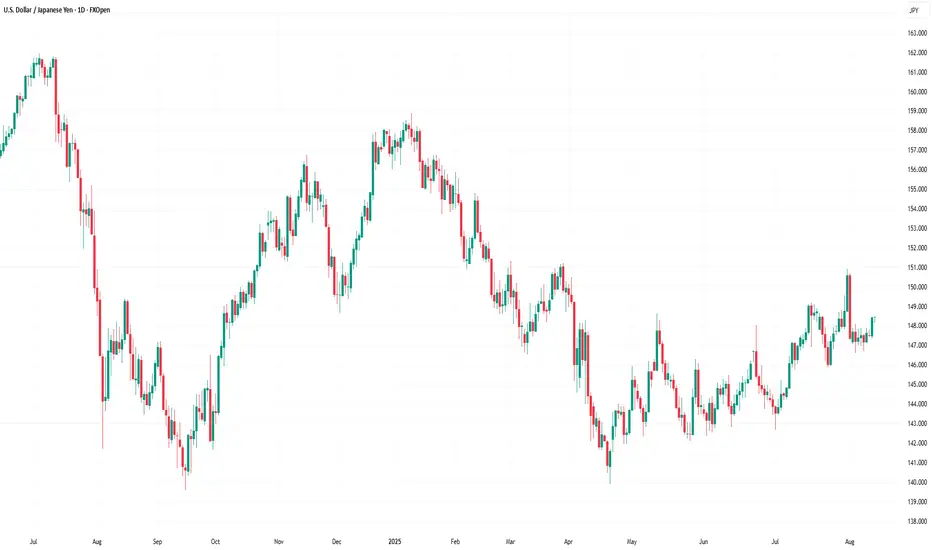
USDJPY (Daily + Weekly Analysis)hi everyone sorry for the delayed video this is the second video I made today as the system froze and lost the video so i did rush through this one. hope it helps and as always happy trading

USDJPY Technical & Order Flow AnalysisOur analysis is based on a multi-timeframe top-down approach and fundamental analysis.
Based on our assessment, the price is expected to return to the monthly level.
DISCLAIMER: This analysis may change at any time without notice and is solely intended to assist traders in making independent investment decisions. Please note that this is a prediction, and I have no obligation to act on it, nor should you.
Please support our analysis with a boost or comment!

Economic Factors That May Affect the Forex MarketEconomic Factors That Affect the Forex Market
The foreign exchange market is influenced by a wide range of economic factors which have a significant impact on currency exchange rates. Knowing about these factors is crucial for anyone looking to trade in the forex market, as they can help analyse price movements.
This article explores some key factors that may affect the forex market and lead to changes in the rates of currency pairs. You’ll learn about the influence of macroeconomic statistics, capital markets, economic data, and more. These factors collectively contribute to the volatility and dynamics of the forex market.
Economic Factors
These economic factors interact with each other in complex ways, and forex traders use a combination of analysis and research to make informed trading decisions. Understanding how these factors impact currency movements is essential for participants in the forex market.
Economic Health
Macroeconomic statistics fall into a category of factors affecting the currency market. The term refers to a set of main indicators that provide insights into the overall performance and health of an economy. These are GDP data, unemployment rates, trade and current account balances, interest rates, and inflation data. Countries with strong economic indicators are typically more attractive to foreign investors. This leads to an appreciation of their currencies. On the contrary, poor economic performance can lead to a decline in a country’s currency value.
Central Bank Policies
Central bank monetary policy decisions, including quantitative easing, forward guidance, and open market operations, can have a direct impact on a country's currency. Announcements and statements by central bank officials are closely monitored by forex traders.
Interest rates are among the most popular central bank tools. Central banks around the world set and regularly change them, and these rates have a direct impact on the value of a country’s currency. In most cases, higher interest rates attract foreign investment. The increased demand for the currency can cause its value to appreciate. In contrast, lower interest rates can lead to a decrease in the value of a currency as investors seek higher returns elsewhere.
The Influence of the Capital Markets
One of the factors affecting the foreign exchange market that we should remember is the influence of the capital markets. Commodity, stock, bond, and other markets also have a strong influence on exchange rates. To illustrate, when a country experiences a rise or sell-off in securities, this may indicate a change in its economic outlook. This typically affects investor sentiment and capital flows.
Traders try to stay updated to apply the most efficient strategy and avoid large losses. They can learn about these events through various sources, including news outlets, financial websites, and even trading platform blogs and news sections.
Imports and Exports
Other significant factors that affect forex trading are imports and exports. When a country’s exports exceed imports, a trade surplus occurs, which strengthens the economy and causes the value of the currency to rise. This happens because foreign consumers buy foreign currency to purchase exported goods. Conversely, when imports exceed exports, a trade deficit occurs, and the country is forced to sell its currency to buy imported goods. This may lead to a decline in the value of the domestic currency.
Government Debt
Government debt is not necessarily a bad thing; however, a government with high debt may find it more difficult to obtain foreign capital if it isn’t seen as reliable by investors. Conversely, a government with low debt and a history of not defaulting is likely to be considered more stable, which can positively impact its currency value. Traders can find information on government debt in financial news outlets, on economic research websites, and in other national sources.
Trade-Weighted Index
A Trade-Weighted Index (TWI) is a measure used in international economics and finance to assess the relative strength or value of a country's currency against a basket of other currencies. Unlike a simple exchange rate, which reflects the value of one currency in terms of another, a Trade-Weighted Index takes into account a country's trade relationships with multiple trading partners.
A Trade-Weighted Index provides a more comprehensive view of a country's currency value because it considers the impact of its trade relationships with multiple partners. It is particularly useful for countries heavily involved in international trade and can be used by policymakers, investors, and economists to gauge currency competitiveness and evaluate the potential impact of currency movements on a country's trade balance.
Final Thoughts
Experienced traders carefully consider factors influencing the forex market and explore their potential impact on exchange rates. It is critical to note that these economic factors do not operate in isolation, and their impact on the forex market can be complex. For example, while high interest rates may attract foreign investment in a certain country and cause its currency to appreciate, they can also lead to decreased consumer spending and economic slowdown, which may ultimately lead to a depreciation of the currency.
Often, traders rely on both economic indicators and technical analysis tools, considering previous price movements in the market. They can compare historical quotes of currency pairs and track what news or indicators were associated with the changes.
This article represents the opinion of the Companies operating under the FXOpen brand only. It is not to be construed as an offer, solicitation, or recommendation with respect to products and services provided by the Companies operating under the FXOpen brand, nor is it to be considered financial advice.
USDJPY Strong buy opportunity near the 1D MA50.Last time we looked into the USDJPY pair (June 13, see chart below) we gave a very timely buy signal, looking for a break-out, that easily hit our 148.675 Target:
Now we are looking for yet another buy opportunity as the price, having established a Channel Up, is being supported by the 1D MA50 (blue trend-line). As long as this Higher Low is preserved, we expect the new Bullish Leg to start.
We expect at least another +4.14% run, setting a 152.500 medium-term Target. Notice also how the 1D RSI is well supported on a Higher Lows trend-line.
-------------------------------------------------------------------------------
** Please LIKE 👍, FOLLOW ✅, SHARE 🙌 and COMMENT ✍ if you enjoy this idea! Also share your ideas and charts in the comments section below! This is best way to keep it relevant, support us, keep the content here free and allow the idea to reach as many people as possible. **
-------------------------------------------------------------------------------
Disclosure: I am part of Trade Nation's Influencer program and receive a monthly fee for using their TradingView charts in my analysis.
💸💸💸💸💸💸
👇 👇 👇 👇 👇 👇

USDJPY (Daily analysis) 06/08USDJPY (Daily analysis) 06/08 hi everyone hope you are having a good day. as always happy trading

USDJPY Bullish Momentum Continues ? Hello traders, what do you think about USDJPY?
As of now, USDJPY is showing a slight upward movement after the recent correction. The price is trading around 147.59, not changing much since the beginning of the session.
The Japanese yen remains under pressure due to Japan’s slow recovery and ongoing economic challenges, giving USD an edge to capitalize on recent gains.
From a technical standpoint, USDJPY is moving in an ascending wedge pattern. After testing the trendline support near 147, the pair could be headed toward the psychological target of 150, or even higher towards the upper trendline boundary in the coming days.
Keep an eye on the price action near key resistance levels as the market continues to evaluate global economic factors, especially the upcoming US jobs data and Fed policy outlook.
What’s your take on USDJPY? Do you expect this pair to rise further? Let me know in the comments below!

USD/JPY Bearish Reversal SetupUSD/JPY 1H Analysis:
Price is showing signs of a potential reversal after hitting resistance near 147.757. The chart suggests a bearish move with multiple rejection zones, targeting the support area around 146.621. Key levels to watch include 147.343 and 147.038 as intermediate supports.

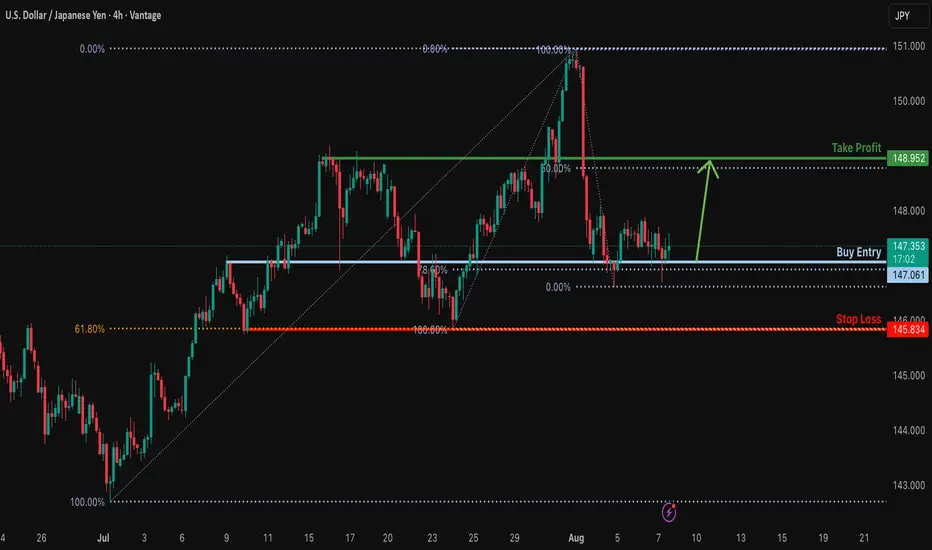
Bullish reversal?USD/JPY is reacting off the support level which is an overlap that aligns with the 78.6% Fibonacci retracement and could bounce from this level to our take profit.
Entry: 147.06
Why we like it:
There is an overlap support level that lines up with the 78.6% Fibonacci retracement.
Stop loss: 145.83
Why we like it:
There is a multi-swing low support.
Take profit: 148.95
Why we like it:
There is a pullback resistance level that is slightly above the 50% Fibonacci retracement.
Enjoying your TradingView experience? Review us!
Please be advised that the information presented on TradingView is provided to Vantage (‘Vantage Global Limited’, ‘we’) by a third-party provider (‘Everest Fortune Group’). Please be reminded that you are solely responsible for the trading decisions on your account. There is a very high degree of risk involved in trading. Any information and/or content is intended entirely for research, educational and informational purposes only and does not constitute investment or consultation advice or investment strategy. The information is not tailored to the investment needs of any specific person and therefore does not involve a consideration of any of the investment objectives, financial situation or needs of any viewer that may receive it. Kindly also note that past performance is not a reliable indicator of future results. Actual results may differ materially from those anticipated in forward-looking or past performance statements. We assume no liability as to the accuracy or completeness of any of the information and/or content provided herein and the Company cannot be held responsible for any omission, mistake nor for any loss or damage including without limitation to any loss of profit which may arise from reliance on any information supplied by Everest Fortune Group.
Another chance to buyI think there is enough volume in the market to push the price up.
The 1-hour candle has good momentum.

USDJPY 15M BULLS BACK TO TAKE THIS TO THE MOON HAHAAs you can see we start having HL in MULTIPLE TIME FRAME
I took Buy here and let see what will give us

USDJPY Breakout and Potential RetraceHey Traders, in today's trading session we are monitoring USDJPY for a selling opportunity around 148.900 zone, USDJPY was trading in an uptrend and successfully managed to break it out. Currently is in a correction phase in which it is approaching the retrace area at 148.900 support and Resistance area.
Trade safe, Joe.

USDJPY 1H BEARS STILL IN CONTROLUJ fail to TRADE ABOVE 147.90 and still trade below 50EMA (EMA50 CAN ACT AS CONTINUATION)
I have 2 TPS (AS SHOWN ON THE CHART)
Second tp if we get there can be very good buying area (WITH CANDLE CONFIRMATION OF COURSE)
Will update along the way
REMEMBER: IS NOT HOW MUCH YOU LOST WHEN YOU LOOSE A TRADE,BUT HOW MUCH YOU GAIN WHEN YOU WIN (RISK/REWARD ITS YOUR ONLY SAVIER IN THIS GAME)

USDJPY Showing Bullish Correction USDJPY is currently testing a key support level, with the US dollar showing recovery since the beginning of the session. This bullish momentum is giving the pair a chance to climb higher.
Technical Overview:
The price is approaching the local support zone near 147.50. Bullish momentum is building from this level. If the price holds above 147.50, it could trigger further upside movement Upside Targets will be 148.50 and also 150.20
You May find more details in the chart,
Trade wisely Best of Luck Buddies.
Ps; Support with like and comments for better analysis Thanks Traders.

USDJPY - SERA - Market StructureUSDJPY - SERA - Market Structure - use risk and trade managment for best result
USDJPY 4Hour TF - August 10th, 2025🟦 USDJPY 4H Analysis
📅 August 10, 2025
Top-Down Trend Bias:
• Monthly – Bullish
• Weekly – Bearish
• Daily – Bullish
• 4H – Bearish
USDJPY is consolidating inside the 147.500 zone. Higher timeframes remain mixed, with bullish monthly/daily trends but a bearish weekly and 4H structure, making this a key decision area.
🔍 Key Zone: 147.500
This zone is both a structural support and a potential breakout base. The reaction here will set the short term tone.
✅ Scenario A: Bullish Breakout (Blue Path)
1.If price breaks and holds above 147.50
2.Look for continuation into 151.500 resistance zone
3.Aligns with the monthly and daily bullish bias
⚠️ Scenario B: Bearish Breakdown (Orange Path)
1.If price closes below 147.500 zone
2.Watch for retest + rejection to confirm downside continuation
Target: 145.00 support zone
This setup aligns with the bearish weekly and 4H bias.
🧠 Final Notes
• HTF momentum is split, confirmation at the zone is critical
• Blue path favors trend continuation on higher timeframes
• Orange path keeps short term sellers in control

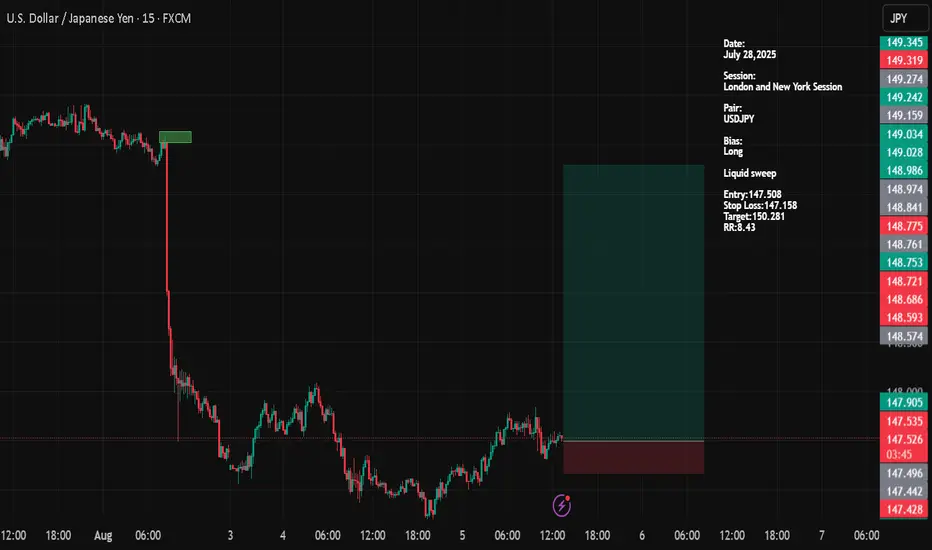
USDJPYDate:
August 05,2025
Session:
New York Session
Pair:
USDJPY
Bias:
Long
Liquid sweep
Entry:147.508
Stop Loss:147.158
Target:150.281
RR:8.43
USDJPY Will Fall! Sell!
Take a look at our analysis for USDJPY.
Time Frame: 12h
Current Trend: Bearish
Sentiment: Overbought (based on 7-period RSI)
Forecast: Bearish
The price is testing a key resistance 147.518.
Taking into consideration the current market trend & overbought RSI, chances will be high to see a bearish movement to the downside at least to 144.599 level.
P.S
The term oversold refers to a condition where an asset has traded lower in price and has the potential for a price bounce.
Overbought refers to market scenarios where the instrument is traded considerably higher than its fair value. Overvaluation is caused by market sentiments when there is positive news.
Disclosure: I am part of Trade Nation's Influencer program and receive a monthly fee for using their TradingView charts in my analysis.
Like and subscribe and comment my ideas if you enjoy them!

BoJ minutes indicate potential rate hike, yen slipsThe Japanese yen is lower on Friday. USD/JPY is trading at 147.66 in the North American session, up 0.38% on the day.
The Bank of Japan minutes from the July 31 meeting signaled that the BoJ remains committed to further rate hikes. This reiterates comments from BOJ President Ueda that he will raise rates, provided that growth and inflation are in line with the BoJs forecasts.
At the same time, members expressed concern about the uncetainty due to tariffs. Members acknowledged that the recent trade agreement between the US and Japan had reduced uncertainty and had made it more likely that inflation would be sustainable at the 2% target. Still, members noted that "high uncertainties remain regarding trade policies and their impact".
On Thursday, the government lowered its growth forecast for this fiscal year due to US tariffs and sticky inflation, which has hurt capital expenditure and consumer demand.
Speaking of consumer demand, Japan's household spending nosedived in in June with a decline of 5.2%. This was a sharp reversal from the May gain of 4.6% and well below the market estimate of -3.0%. Year-on-year, household spending eased to 1.3%, compared to 4.7% in May and shy of the market estimate of 2.6%.
The Federal Reserve is on track to lower rates in September, which would mark the first rate reduction since December 2024. Last week's soft July employment report saw nonfarm payrolls fall to 73 thousand. This was well short of the market estimate of 110 thousand and included sharp downward revisions to the May and June releases.
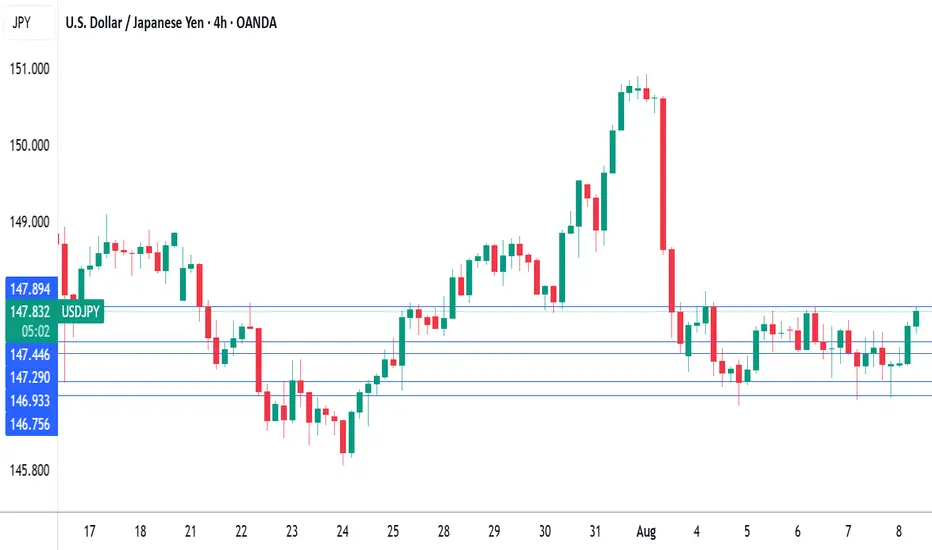
USD/JPY has pushed above resistance at 147.30 and is testing 147.45. Above, there is resistance at 147.89
1.4694 and 146.75 are the next support levels
USDJPY: Trend in 2H time framePlease pay special attention to the very accurate trend, colored levels, and red level as SL.
Be careful
BEST
MT
