JPYUSD trade ideas

USDJPY – Looking for Lower Highs + Drop SetupUSDJPY – Looking for Lower Highs + Drop Setup 🔻
Price is testing resistance near 144.95. Expecting potential rejection and formation of lower highs. Watching for continuation toward the 144.75 area.
If price fails to break current highs, this pattern may play out in waves toward the downside.
Already in.
⚠️ Not financial advice — trade at your own risk.
#USDJPY #Forex #MarketAnalysis #GlobalHorns

Sell USDJPYUSDJPY double bottom pattern is currently in progress. Price has been pushing up since the start of June, and now, a short retracement to 144,00 and price will continue higher.


Posibility of Short in USDJPYAccording to this wave count, we could be at the beginning of wave C, based on Elliott Wave theory.
If the price respects the resistance level, we can enter a short position toward the support.

USD/JPYTRADE 1 JUST A LOOK SEE WHERE IT GOES LOOKING FOR PRICE TO ACTIVATE AND go where ever the flow takes it

Pound slips on weak UK jobs data | FX ResearchOvernight, dollar-yen reached an 8-day high but retreated after Bank of Japan Governor Ueda noted that Japan's inflation is still below the 2% target and the low policy rate limits economic stimulus options.
Meanwhile, the pound weakened as UK employment dropped by 109,000 in May—the largest decline in 5 years—with wage growth slowing to 5.2%, signalling potential for Bank of England rate cuts.
The dollar strengthened overall, boosted by a strong U.S. NFIB small business optimism index surpassing expectations.
On the central bank front, ECB’s Holzmann dissented against a recent rate cut and suggested maintaining current rates through the summer to avoid reigniting inflation.
Attention now shifts to the Fed's upcoming FOMC decision and a speech by the ECB’s Vujic. U.S. stock futures remain steady as U.S.–China trade talks continue, though market sentiment remains cautious due to a lack of concrete progress.
Exclusive FX research from LMAX Group Market Strategist, Joel Kruger

Bullish continuation?USD/JPY has bounced off the support level which is a pullback support and could rise from this level to our take profit.
Entry: 144.41
Why we like it:
There is a pullback support level.
Stop loss: 143.98
Why we like it:
There is an overlap support level that lines up with the 50% Fibonacci retracement.
Take profit: 146.07
Why we like it:
There is a pullback resistance level.
Enjoying your TradingView experience? Review us!
Please be advised that the information presented on TradingView is provided to Vantage (‘Vantage Global Limited’, ‘we’) by a third-party provider (‘Everest Fortune Group’). Please be reminded that you are solely responsible for the trading decisions on your account. There is a very high degree of risk involved in trading. Any information and/or content is intended entirely for research, educational and informational purposes only and does not constitute investment or consultation advice or investment strategy. The information is not tailored to the investment needs of any specific person and therefore does not involve a consideration of any of the investment objectives, financial situation or needs of any viewer that may receive it. Kindly also note that past performance is not a reliable indicator of future results. Actual results may differ materially from those anticipated in forward-looking or past performance statements. We assume no liability as to the accuracy or completeness of any of the information and/or content provided herein and the Company cannot be held responsible for any omission, mistake nor for any loss or damage including without limitation to any loss of profit which may arise from reliance on any information supplied by Everest Fortune Group.

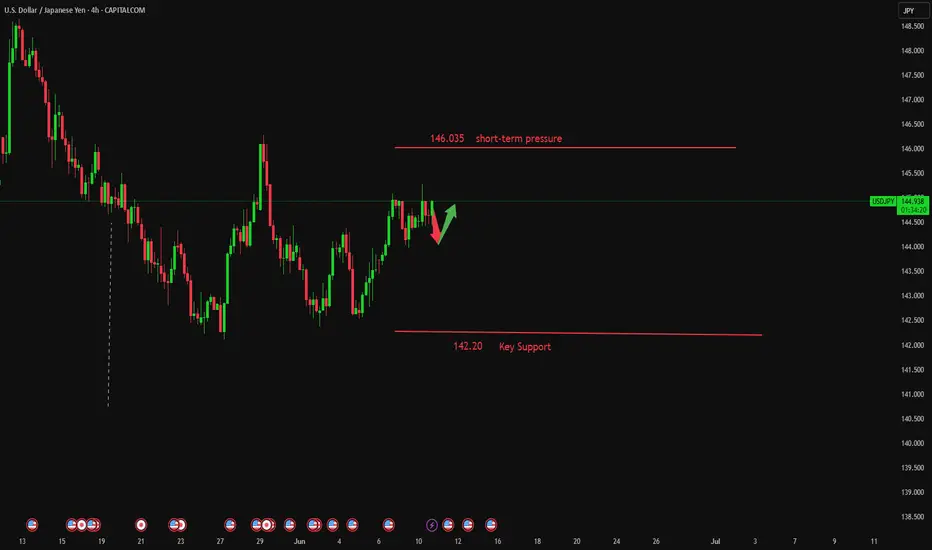
USD/JPY Battle Lines Drawn at Key Support- CPI on TapUSD/JPY plunged 4.4% into the close of May- The bears have been unable to break the 2021 original slope line, and the immediate focus is on a breakout of near-term range above support.
Initial weekly resistance is now eyed with the May high-week close (HWC) / 61.8% retracement of the May decline at 145.63-146.15- a breach / weekly close above this level would be needed to suggest a larger rebound is underway. Subsequent resistance objectives eyed at the December low / May high at 148.65 and the 52-week moving average (currently ~150.08). Ultimately a weekly close above the 61.8% retracement of the yearly range / 2022 & 2023 highs at 151.62/95 would be needed o threaten resumption of the broader multi-year uptrend in USD/JPY.
Weekly support rests with the yearly low-week close (LWC) at 143.68 with a close below the 2021 slope needed to fuel another run at key support (multi-year bullish invalidation) at the yearly lows near 139.58-140.49- a region defined by the December 2023 & 2024 lows and the 61.8% retracement of the 2023 advance. Look for a larger reaction there IF reached. Subsequent support objective seen at the 100% extension of the 2024 decline / July 2023 swing low around 136.51-137.24.
Bottom line: USD/JPY is trading just above multi-year uptrend support with a tight-range in view early in the month. From a trading standpoint, the immediate focus is on a breakout of the 143.68-146.15 range for guidance here with the yearly downtrend vulnerable while above the 2021 trendline. Look for the breakout in the days ahead.
-MB

USDJPY higher bullish for exepct
FX:USDJPY PA based analysis, price is bounce few times on bottom line of PA, last we have bullish push with short revers till zone 144.000, which taking here for sup zone from which expecting higher bullish continuation.
Technicalls are here same strong bullish for expect
SUP zone: 144.000
RES zone: 146.900

Investors Await Tariff Negotiation News with Bated BreathThe USD/JPY has lacked a clear direction for the second consecutive day, with a doji pattern on the daily chart highlighting investor indecision. As Sino-US representatives are currently negotiating a trade agreement, the market is temporarily reluctant to bet on a directional move. So long as prices remain within the Kumo cloud, a sideways trend is expected in the short term, as Monday's strong rebound from intraday lows and today's failed upside attempt both support this scenario. A clear break of either boundary of the daily Kumo cloud would unleash a more definitive directional signal. Although optimism over Sino-US trade talks is supporting the US dollar, the current momentum is insufficient to drive a stronger rally.
Humans need to breathe, and perfect trading is like breathing—maintaining flexibility without needing to trade every market swing. The secret to profitable trading lies in implementing simple rules: repeating simple tasks consistently and enforcing them strictly over the long term.


Storm Ahead? Key Level Breakout or Dangerous Reversal!USD/JPY: Storm Ahead? Key Level Breakout or Dangerous Reversal!
Overview:
The USD/JPY pair stands at a crucial crossroads, with technical signals indicating the potential for significant volatility in the near term. Will the Yen regain its footing, or will pressure from the USD continue to push the pair to new highs? This analysis delves into technical, fundamental, and macroeconomic factors to outline potential scenarios and identify key trading zones.
Detailed Technical Analysis:
Primary Trend: The USD/JPY chart clearly shows a short-term uptrend, supported by an ascending trendline (dashed line on the chart) and upward-sloping moving averages (MA). Trend analysis is considered the most important area of technical analysis, and is key to determining the general direction of a security. However, the price is approaching strong resistance zones, suggesting potential selling pressure. Technical analysis is a trading tool used to evaluate stocks and attempt to predict their future movements by analyzing statistical data obtained from trading activity.
Key Price Levels:
Crucial Resistance Zone (SELL Zone): Around 144.894 - 145.178. This is a significant Fibonacci Extension zone (1.13 and 1.236), where the price has reacted in the past and could attract strong selling pressure. If the price breaks and holds above this zone, the uptrend will be confirmed.
Crucial Support Zone (BUY Zone): Around 143.600 - 143.750. This support zone is formed by previous lows and the ascending trendline. If the price corrects to this zone and shows reversal signals, it could be a good buying opportunity. The next support zone is around 142.800. The goal of technical analysis is to determine the buy and sell points of a stock.
Technical Indicators: The MAs (blue, orange, red) maintain a relatively consistent distance and are sloping upwards, supporting the uptrend. However, the convergence of MAs near resistance zones could signal a weakening of upward momentum.
Price Patterns: Currently, the price is forming a pattern similar to a bull flag or an ascending triangle, suggesting a potential continuation of the uptrend if it breaks upwards. Conversely, if the price fails to overcome resistance and breaks the uptrend line, a bearish reversal pattern could form. Wave analysis is a technique based on the observation that markets move in specific patterns called waves.
Relevant Fundamental and Economic Factors:
Macroeconomic Analysis (Japan): The Bank of Japan (BOJ) continues to maintain ultra-loose monetary policy, with negative interest rates and yield curve control. This exerts continuous downward pressure on the Yen. Any signal of change from the BOJ regarding policy will have a significant impact on USD/JPY.
Macroeconomic Analysis (United States): The U.S. Federal Reserve (FED) is still in an aggressive monetary tightening cycle to combat inflation. Inflation reports (CPI, PPI), employment data (NFP), and statements from FED officials will be key drivers for the USD. If U.S. inflation remains high, the FED may continue to raise interest rates, pushing USD/JPY higher. Fundamental analysis focuses on evaluating economic, political, and social factors affecting the value of a currency pair.
Upcoming Economic Events: Closely monitor inflation reports from both the U.S. and Japan, GDP data, unemployment rates, and policy meetings of the BOJ and FED. These events will act as catalysts for sharp movements.
Conclusion and Trading Recommendations:
USD/JPY is in an uptrend but approaching crucial resistance zones.
BUY
Entry: When the price breaks and closes above 145.178, confirming the uptrend continuation. Or when the price corrects to the 143.600 - 143.750 zone and shows bullish reversal candles (e.g., bullish engulfing, hammer).
Take Profit: Higher Fibonacci levels (e.g., 1.382 at 145.491 or 1.5 at 145.918).
Stop Loss: Below the nearest support zone, e.g., below 143.500 if buying at support, or below 144.800 if buying after a resistance breakout.
SELL Scenario:
Entry: When the price approaches the 144.894 - 145.178 zone and strong bearish reversal signals appear (e.g., Gravestone Doji, bearish engulfing, double top pattern).
Take Profit: Lower support levels, e.g., 143.700, 142.800.
Stop Loss: Above the resistance zone, e.g., above 145.300.
Risk Disclaimer: Financial markets always involve high risks. Always manage your capital carefully and never trade with money you cannot afford to lose. This analysis is for informational purposes only and not investment advice.

USDJPY 15MIt seems you've uploaded a chart image. This is a TradingView chart showing the U.S. Dollar/Japanese Yen (USD/JPY) pair on a 15-minute timeframe. The chart includes a potential sell setup based on a descending trendline and shows a target price zone with a directional arrow indicating a potential price drop.
Would you like to discuss this chart in more detail, or do you have specific questions about it?

USDJPY Analysis Today: Technical and Order Flow !In this video I will be sharing my USDJPY analysis today, by providing my complete technical and order flow analysis, so you can watch it to possibly improve your forex trading skillset. The video is structured in 3 parts, first I will be performing my complete technical analysis, then I will be moving to the COT data analysis, so how the big payers in market are moving their orders, and to do this I will be using my customized proprietary software and then I will be putting together these two different types of analysis.

USDJPY - MR.GRINGO ThinkingsHello everybody.
Today, we have some discussion about this pair but only with using Technical ways.
The pair right now is very long, maybe 80 days' time period in trouble situation. I mean, the bears have the market of it...
As we see, this 80 day was so strong bearish range, but it's great try for bulls now!
We may have a hope, the price will go up with this next side of the acceding triangular figures.
We may open long position on the price 143.603 or Just make entry for long now.
If you will follow this trading idea, there we will have "the main" resistance levels.
They are...
1. 145.735
2. 146.892
3. 148.048 yes. so I recommend this price levels, because the market will check it maybe later... For sure if you think buy.
Have a profit maker day! :) ^)

USDJPY: Strong Intraday Bullish Price Action 🇺🇸🇯🇵
On the today's live stream, we discussed a very bullish setup
on USDJPY.
The price retested a recently broken horizontal resistance.
A resistance line of a falling wedge pattern was violated with
a strong bullish movement then.
We see its retest at the moment.
I think that the price will resume growth soon and reach 145.25 level.
❤️Please, support my work with like, thank you!❤️
I am part of Trade Nation's Influencer program and receive a monthly fee for using their TradingView charts in my analysis.

#USDJPY: +2000 PIPS Big Swing Move! Do not miss outThe cryptocurrency’s price is currently experiencing bearish pressure, and the current trading price is pivotal for determining its future trajectory. A smooth downtrend is anticipated, potentially propelling the price to 124 in the long term. The US dollar is likely to remain bearish, potentially reaching 95 in the US currency index. Three potential target sets are envisaged, and further updates will be provided based on price developments.
Best of luck and ensure safe trading practices.
Team Setupsfx_

USDJPY BREAKDOWNUSDJPY has a potential fail of H4 structure and probably building volume for an M style structure. Now I'm looking for H1 2 touch with 15M IE LONG. Unless it respect the 123 on h1 and give a short term sell/ go further down invalidating a potential pre M style long.

USDJPY BUY OPPORTUNITY Price is trending bullish on the H1 timeframe. We can clearly tell that price is moving and respecting the trendline. I anticipate bullish price action to develop away from the current price. Target profit level is at 146.000
Take advantage of this opportunity

Usd/Jpy intra-day Analysis 10-Jun-25Sharing the possible scenarios we could have on Usd/Jpy.
Keeping in mind that the Volume is still slow since start of the week, and investors are waiting for the next set of important economic data which is starting tomorrow with the US CPI (inflation number).
Disclaimer: easyMarkets Account on TradingView allows you to combine easyMarkets industry leading conditions, regulated trading and tight fixed spreads with TradingView's powerful social network for traders, advanced charting and analytics. Access no slippage on limit orders, tight fixed spreads, negative balance protection, no hidden fees or commission, and seamless integration.
Any opinions, news, research, analyses, prices, other information, or links to third-party sites contained on this website are provided on an "as-is" basis, are intended only to be informative, is not an advice nor a recommendation, nor research, or a record of our trading prices, or an offer of, or solicitation for a transaction in any financial instrument and thus should not be treated as such. The information provided does not involve any specific investment objectives, financial situation and needs of any specific person who may receive it. Please be aware, that past performance is not a reliable indicator of future performance and/or results. Past Performance or Forward-looking scenarios based upon the reasonable beliefs of the third-party provider are not a guarantee of future performance. Actual results may differ materially from those anticipated in forward-looking or past performance statements. easyMarkets makes no representation or warranty and assumes no liability as to the accuracy or completeness of the information provided, nor any loss arising from any investment based on a recommendation, forecast or any information supplied by any third-par ty.

USDJPY Is Going Up! Long!
Here is our detailed technical review for USDJPY.
Time Frame: 2h
Current Trend: Bullish
Sentiment: Oversold (based on 7-period RSI)
Forecast: Bullish
The market is approaching a significant support area 144.671.
The underlined horizontal cluster clearly indicates a highly probable bullish movement with target 145.501 level.
P.S
The term oversold refers to a condition where an asset has traded lower in price and has the potential for a price bounce.
Overbought refers to market scenarios where the instrument is traded considerably higher than its fair value. Overvaluation is caused by market sentiments when there is positive news.
Disclosure: I am part of Trade Nation's Influencer program and receive a monthly fee for using their TradingView charts in my analysis.
Like and subscribe and comment my ideas if you enjoy them!
