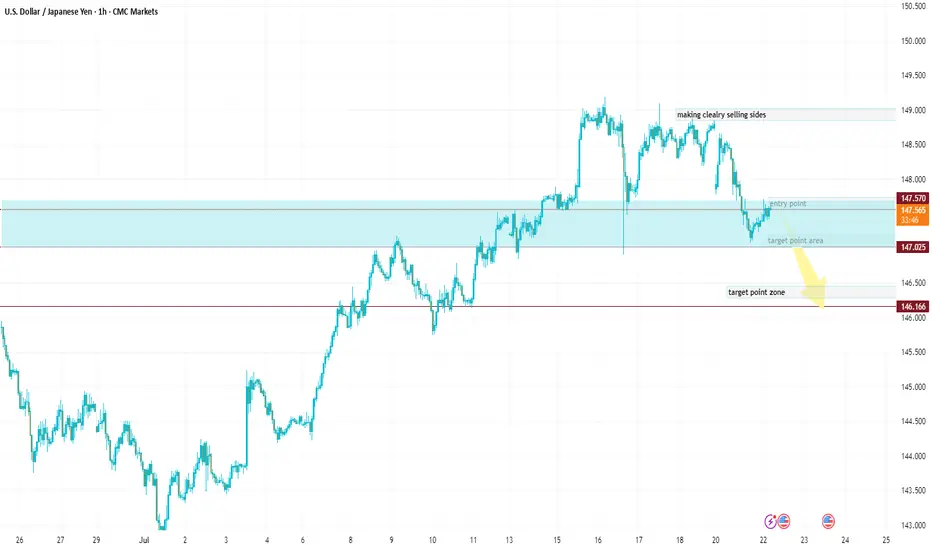
USDJPY Entry Zone: Current market is near your ideal entry zoneEntry Point (for Sell): Around 147.800 – 147.600
🔻 First Target (TP1): 147.050 – Labeled as "target point area"
🔻 Second Target (TP2): 146.300 – Labeled as "target point zone"
🛑 Invalid Zone (Sell Weakens): Above 148.600 – 149.000 (marked as “making clearly selling sides”)
Entry Zone:
Current market is near your ideal entry zone.
A pullback or rejection around 147.800 provides a good short opportunity.
🎯 Take-Profit Zones:
TP1: 147.050 (first support level / structure base)
TP2: 146.300 (major demand zone)
📉 Stop-Loss (SL):
Above 148.600
JPYUSD trade ideas
USDJPY H1 I Bearish Reversal off the 61.8%Based on the H1 chart, the price is rising toward our sell entry level at 147.90, a pullback resistance that aligns closely with the 61.8% Fib retracement.
Our take profit is set at 146.78 an overlap support.
The stop loss is set at 149.05, a swing high resistance.
High Risk Investment Warning
Trading Forex/CFDs on margin carries a high level of risk and may not be suitable for all investors. Leverage can work against you.
Stratos Markets Limited (tradu.com ):
CFDs are complex instruments and come with a high risk of losing money rapidly due to leverage. 66% of retail investor accounts lose money when trading CFDs with this provider. You should consider whether you understand how CFDs work and whether you can afford to take the high risk of losing your money.
Stratos Europe Ltd (tradu.com ):
CFDs are complex instruments and come with a high risk of losing money rapidly due to leverage. 66% of retail investor accounts lose money when trading CFDs with this provider. You should consider whether you understand how CFDs work and whether you can afford to take the high risk of losing your money.
Stratos Global LLC (tradu.com ):
Losses can exceed deposits.
Please be advised that the information presented on TradingView is provided to Tradu (‘Company’, ‘we’) by a third-party provider (‘TFA Global Pte Ltd’). Please be reminded that you are solely responsible for the trading decisions on your account. There is a very high degree of risk involved in trading. Any information and/or content is intended entirely for research, educational and informational purposes only and does not constitute investment or consultation advice or investment strategy. The information is not tailored to the investment needs of any specific person and therefore does not involve a consideration of any of the investment objectives, financial situation or needs of any viewer that may receive it. Kindly also note that past performance is not a reliable indicator of future results. Actual results may differ materially from those anticipated in forward-looking or past performance statements. We assume no liability as to the accuracy or completeness of any of the information and/or content provided herein and the Company cannot be held responsible for any omission, mistake nor for any loss or damage including without limitation to any loss of profit which may arise from reliance on any information supplied by TFA Global Pte Ltd.
The speaker(s) is neither an employee, agent nor representative of Tradu and is therefore acting independently. The opinions given are their own, constitute general market commentary, and do not constitute the opinion or advice of Tradu or any form of personal or investment advice. Tradu neither endorses nor guarantees offerings of third-party speakers, nor is Tradu responsible for the content, veracity or opinions of third-party speakers, presenters or participants.

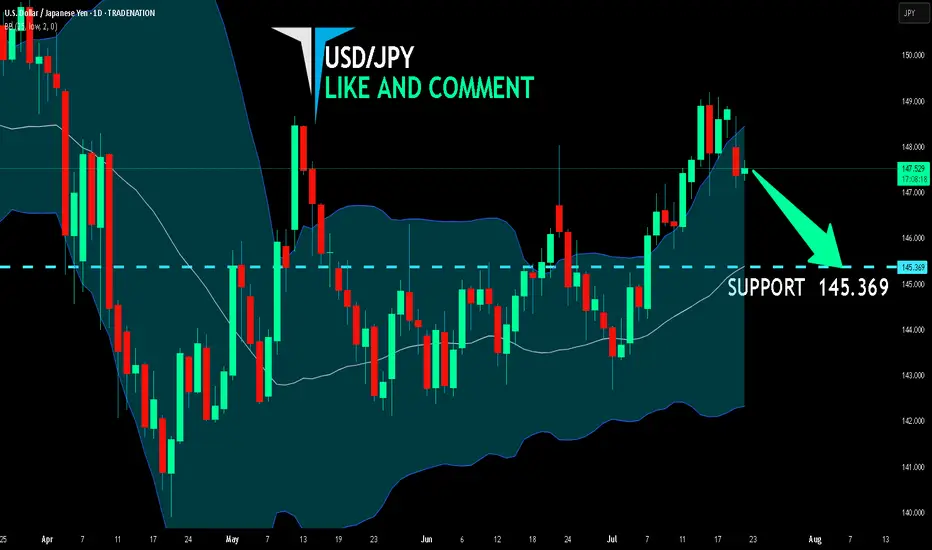
USD/JPY SENDS CLEAR BEARISH SIGNALS|SHORT
Hello, Friends!
USD/JPY pair is trading in a local uptrend which we know by looking at the previous 1W candle which is green. On the 1D timeframe the pair is going up too. The pair is overbought because the price is close to the upper band of the BB indicator. So we are looking to sell the pair with the upper BB line acting as resistance. The next target is 145.369 area.
Disclosure: I am part of Trade Nation's Influencer program and receive a monthly fee for using their TradingView charts in my analysis.
✅LIKE AND COMMENT MY IDEAS✅
USDJPY TREND REVERSAL TRADELooking at 4h chart, our short term bearish channel has been broken indicating a possible reversal. Waiting for this sell setup to trigger. Let me know your thoughts.

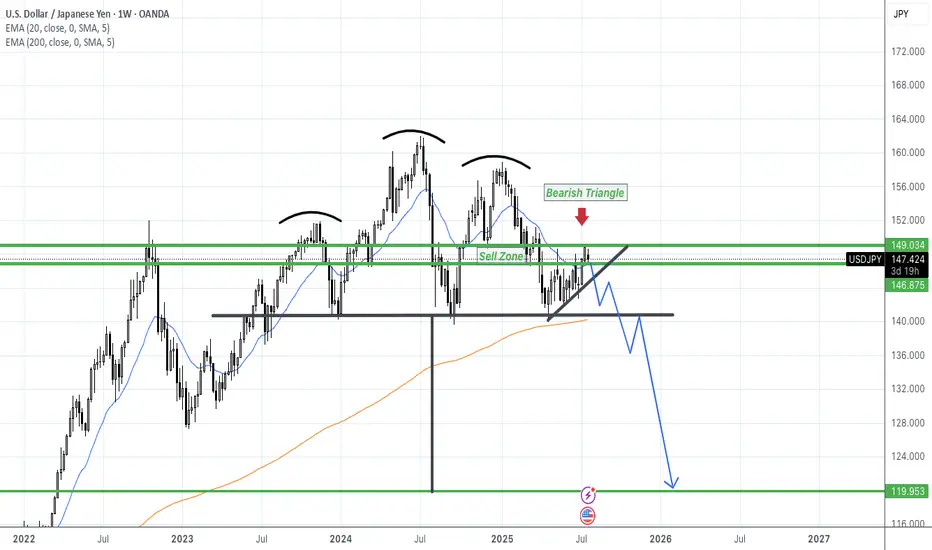
USDJPY SHORTSThe weekly chart shows a clear head and shoulders formation forming under a major bearish descending triangle, with strong rejection from the 149.034–150.000 Sell Zone. Price action continues to print lower highs, and the horizontal support near 140 is weakening under repeated pressure.
Technical Breakdown Highlights:
• Multiple rejections forming the classic head and shoulders reversal structure.
• Price is coiling under resistance, compressing in a bearish triangle, signaling seller strength.
• Bearish momentum could trigger a breakdown toward the 119.950 support zone—nearly 2,700+ pips from current levels.
• 20 EMA is below the 200 EMA—bearish alignment.
⸻
🧠 Macro & Micro Fundamentals Supporting This Setup:
🔻 Macro (Fundamental Pressure on USD):
• The Federal Reserve is shifting dovish as inflation cools and unemployment begins to rise. Markets are now pricing in multiple rate cuts in 2025, which could weaken the USD significantly.
• The 10-year Treasury yield is falling, further reducing USD attractiveness.
• Global de-dollarization and capital flight to alternative assets (gold, crypto, BRICS currencies) adds long-term pressure on USD.
💴 Micro (Supportive Tailwinds for JPY):
• The Bank of Japan is gradually tightening—it has begun to move away from negative interest rates and yield curve control. Any shift in BoJ policy will strengthen the yen dramatically due to Japan’s massive capital flows.
• Japan remains one of the largest global creditors—capital repatriation from Japanese institutions during risk-off cycles supports the JPY.
• Safe haven demand during any geopolitical or recessionary volatility also favors the yen.
⸻
🎯 Target: 120.000
⛔️ Invalid if Weekly Closes >150.000
⏳ Timing: Breakdown likely between Q3 2025 and early 2026 if macro alignment holds.
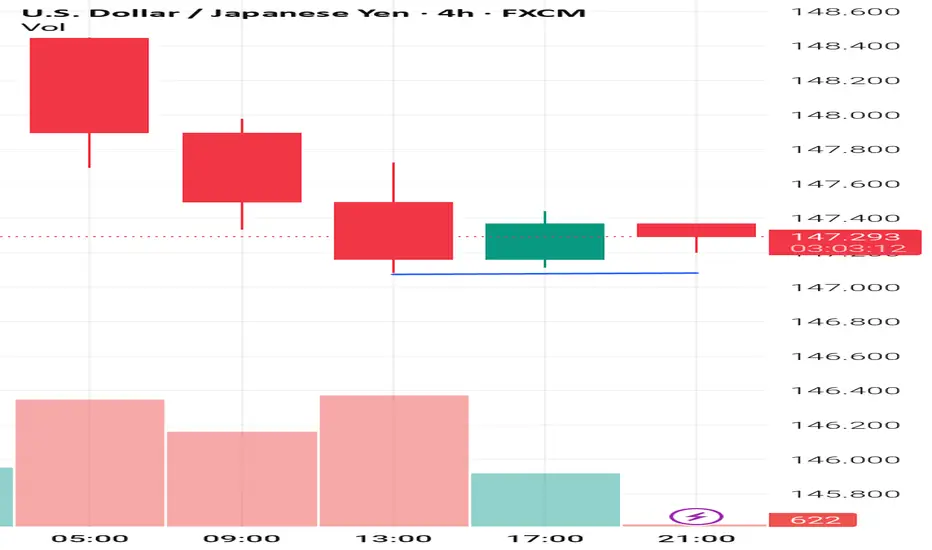
USD/JPY Drops as Market Awaits Powell's RemarksIn today’s trading session, the USD/JPY pair is showing renewed weakness, currently trading around 147.76 — down more than 0.68% from the previous session. The decline is driven by falling U.S. Treasury yields and cautious investor sentiment ahead of an upcoming speech by Federal Reserve Chair Jerome Powell, which is weighing on the U.S. dollar.
From a technical perspective, USD/JPY has broken its short-term uptrend and is approaching a key support level at 147.60. If this level fails to hold, the bearish momentum could extend further.

USD/JPY 4-Hour Forex Chart4-hour chart from FOREX.com displays the exchange rate between the U.S. Dollar (USD) and the Japanese Yen (JPY). The current rate is 147.446, with a slight increase of 0.072 (+0.05%). The chart shows recent price movements, including a notable drop within a highlighted support and resistance zone (light green and pink areas). Buy and sell prices are marked at 147.446 and 147.444, respectively, with additional price levels indicated on the right side ranging from 146.943 to 149.000. The chart includes candlestick patterns and is timestamped up to July 22, 2025.

Fundamental analysis: JPY strength and TV show recommendation The outcome of the Japanese election has created JPY strength. If you placed a short term JPY long based on the election, I would find it difficult to argue. But, personally, I think any JPY strength will be short lived. Essentially due to uncertainty creating a likelihood of a slower pace of BOJ rate hikes (If at all). Meaning, JPY short trades back on the table soon.
Whilst I await a 4hr swing with a 'push up' on JPY charts (for a JPY short). I'd like to recommend a very interesting TV programme I recently watched called FINDING THE MONEY.
Depending on your region you might be able to watch it for free., Living in the UK, I paid about £6 to watch it via Amazon prime.
It won't necessarily make you a better trader, it's just a very interesting watch, particularly if you're curious about the concept of M.M.T and the workings of the financial system.
USD/JPY Bearish Reversal Setup with Key Targets and Stop LossThis 4-hour USD/JPY chart suggests a bearish setup. Price has rejected the order block near 149.220 and is heading downward. A support level is marked at 145.268, with the target around 142.637. A stop loss is set above the order block, indicating a short trade setup expecting a continued drop.

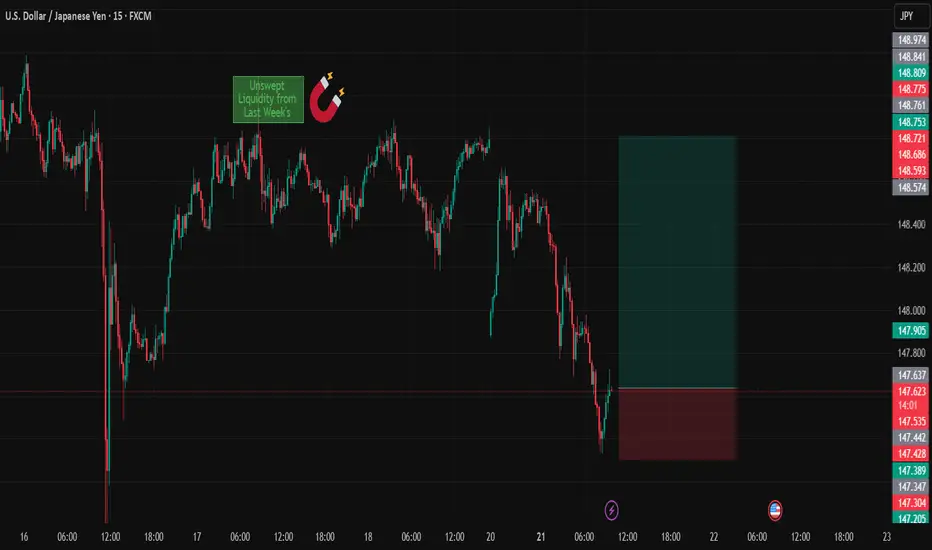
USDJPY (Weekly analysis) 22/07hi everyone please see the weekly analysis i did not do one yesterday as it was a bank holiday in JPY. happy trading everyone

USDJPY
Date:
July 21,2025
Session:
New York Open
Pair:
USDJPY
Bias:
Long
1. Clean liquidity pool left unswept from last week's NYC Open (Thursday).
2. NY session typically retraces or extends from London reversal, giving directional momentum.
Entry:147.544
Stop Loss:147.250
Target:148.794
RR:4.11
USD/JPY Fibo Support Test NearbyUSD/JPY continues to brew traps on both sides of the pair as last week's push up to fresh three-month highs has been followed by a decisive snap back in the pair. The drive behind the move is also of interest, as Japanese election results over the weekend haven't been completely digested by Japanese markets, as they were closed on Monday for a public holiday. So the next 24 hours will be key for seeing the way that this theme gets priced-in.
In USD/JPY, there's a support level nearby in the form of the 61.8% retracement of the September-January move. Notably, this was the price that caught the low last Wednesday after the Trump-fueled sell-off took over in the USD, just after the threat to fire Jerome Powell.
Fears of a more dovish Fed make sense for USD-weakness as that could pressure further unwind of the carry trade. But with the LDP losing a majority in the upper chamber, it seems that greater political vulnerability would make for a more difficult road for the Bank of Japan to hike rates. Nonetheless, the response to support is what matters here, and there's quite a bit of structure lurking below the Fibonacci level, with 146.54 and 145.93 both of note, and that's before the 145.00 level comes back into play. - js


Japan's coalition loses majority, yen higherThe Japanese yen has started the week with strong gains. In the European session, USD/JPY is trading at 147.71, down 0.73% on the day.
Japanese Prime Minister Ishiba's ruling coalition failed to win a majority in the election for the
upper house of parliament on Sunday. The result is a humiliating blow to Ishiba, as the government lost its majority in the lower house in October. The stinging defeat could be the end of the road for Ishiba. The Prime Minister has declared he will remain in office, but there is bound to be pressure from within the coalition for Ishiba to resign.
The election result was not a surprise, as voters were expected to punish the government at the ballot box due to the high cost of food and falling incomes. The price of rice, a staple food, has soared 100% in a year, causing a full-blown crisis for the government, which has resorted to selling stockpiled rice from national reserves to the public.
The election has greatly weakened Ishiba's standing, which is bad news as Japan is locked in intense trade talks with the US. President Trump has warned that he will impose 25% tariffs on Japanese goods if a deal isn't reached by August 1. Japan is particularly concerned about its automobile industry, the driver of its export-reliant economy.
The Bank of Japan meets on July 31 and is widely expected to continue its wait-and-see stance on rate policy. The BoJ has been an outlier among major central banks as it looks to normalize policy and raise interest rates. However, with the economic turbulence and uncertainty due to President Trump's erratic tariff policy, the Bank has stayed on the sidelines and hasn't raised rates since January. Japan releases Tokyo Core CPI on Friday, the last tier-1 event before the rate meeting.

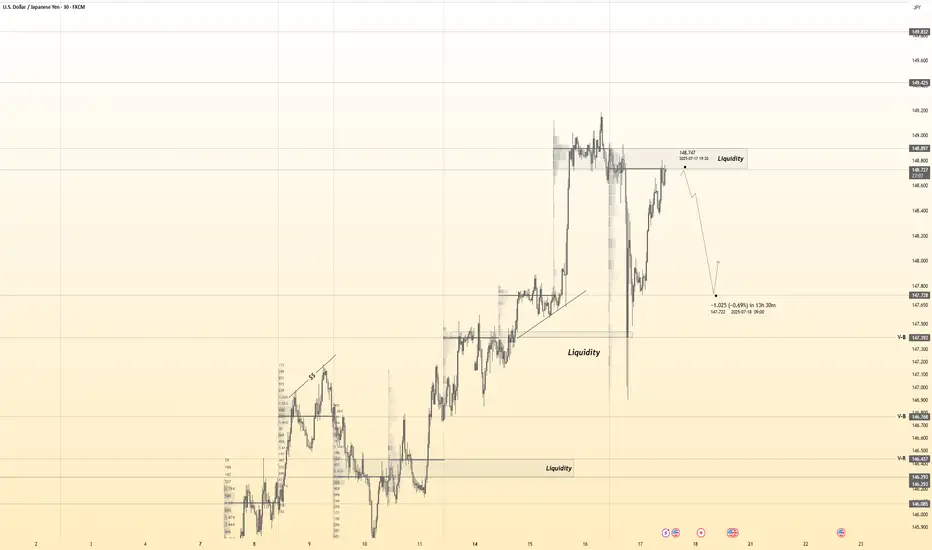
USDJPY Support & Resistance Levels🚀 Here are some key zones I've identified on the 15m timeframe.
These zones are based on real-time data analysis performed by a custom software I personally developed.
The tool is designed to scan the market continuously and highlight potential areas of interest based on price action behavior and volume dynamics.
Your feedback is welcome!

USDJPY BREAKOUT IN H1 Price just broke out of the trendline that was formerly serving as support. A sell opportunity is envisaged from the current market price. Target profit is at 146.207

USDJPY sell1. price created a double top near the premium zone
2. price moved down and broke the bullish trendline and closed below it
3. Created a new bearish trendline with multiple touches confirming that that the bullish move has ended
Entry idea:
will wait for price to pullback into the 50% zone fora limit order or alternatively wait for price to be overbought with a stochastic cross to enter at market order then exit/TP at the next available order block

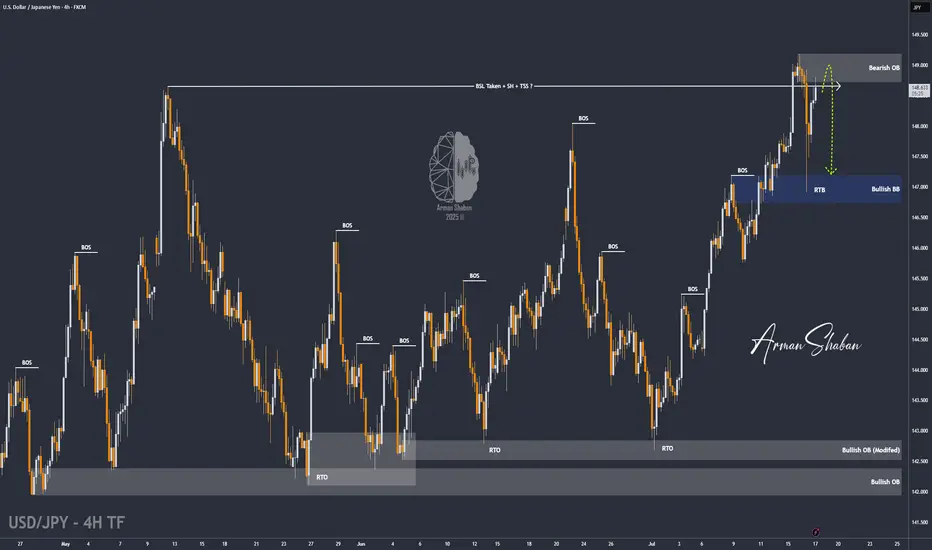
USD/JPY : Get Ready for another Fall ! (READ THE CAPTION)By analyzing the USDJPY chart on the 4-hour timeframe, we can see that after our last daily timeframe analysis, the price started its rally from the 144 zone and, as expected, hit all three targets at 145.5, 147.35, and 148.65, delivering over 500 pips in returns — even reaching as high as 149.2! Once the price broke above 148.65 and swept the liquidity above this level, it faced selling pressure and dropped to 146.9. Currently trading around 148.65, if USDJPY manages to hold below the supply zone between 148.65 and 149.2, we can expect further downside movement. This analysis will be updated with your support!
THE DAILY ANALYSIS :
Please support me with your likes and comments to motivate me to share more analysis with you and share your opinion about the possible trend of this chart with me !
Best Regards , Arman Shaban
USD/JPY Faces Rejection at 148.6, Bearish Setup EmergesFenzoFx—USD/JPY began a bearish wave after the 148.6 resistance rejected the price. As of this writing, the currency pair flipped below the ascending trendline and formed a bearish FVG at 147.9.
A pullback toward the FVG can provide a premium price to go short on USD/JPY, targeting 146.9, followed by 145.7.

USDJPY short position 21/07/2025English : According to our analysis, we anticipate a bearish scenario.
Morocan Darija : kanchofo d'apres l'analyse dyalna antsanaw hboot
ATENTION : I only share my ideas, not signals

USDJPY 30Min Engaged ( Bearish Entry Detected )————-
➕ Objective: Precision Volume Execution
Time Frame: 30-Minute Warfare
Entry Protocol: Only after volume-verified breakout
🩸 Bearish From now Price :148.750
➗ Hanzo Protocol: Volume-Tiered Entry Authority
➕ Zone Activated: Dynamic market pressure detected.
The level isn’t just price — it’s a memory of where they moved size.
Volume is rising beneath the surface — not noise, but preparation.
🔥 Tactical Note:
We wait for the energy signature — when volume betrays intention.
The trap gets set. The weak follow. We execute.
Market Insights with Gary Thomson: 21 - 25 JulyMarket Insights with Gary Thomson: RBA Minutes, BoJ Speech, ECB Decision, UK Sales, Earnings Reports
In this video, we’ll explore the key economic events, market trends, and corporate news shaping the financial landscape. Get ready for expert insights into forex, commodities, and stocks to help you navigate the week ahead. Let’s dive in!
In this episode of Market Insights, Gary Thomson unpacks the strategic implications of the week’s most critical events driving global markets.
👉 Key topics covered in this episode:
— RBA Meeting Minutes
— BoJ Deputy Governor Uchida Speech
— ECB Interest Rate Decision & Press Conference
— UK Retail Sales
— Corporate Earnings Statements
Don’t miss out—gain insights to stay ahead in your trading journey.
This video represents the opinion of the Companies operating under the FXOpen brand only. It is not to be construed as an offer, solicitation, or recommendation with respect to products and services provided by the Companies operating under the FXOpen brand, nor is it to be considered financial advice.

USDJPY 30Min Engaged ( Bullish Entry Detected )➕ Objective: Precision Volume Execution
Time Frame: 30-Minute Warfare
Entry Protocol: Only after volume-verified breakout
🩸 Bullish From now Price : 147.900
➗ Hanzo Protocol: Volume-Tiered Entry Authority
➕ Zone Activated: Dynamic market pressure detected.
The level isn’t just price — it’s a memory of where they moved size.
Volume is rising beneath the surface — not noise, but preparation.
🔥 Tactical Note:
We wait for the energy signature — when volume betrays intention.
The trap gets set. The weak follow. We execute.
