BUY USDJPYJPY weakness at Asia market open. USDJPY among other JPY pairs will seek supply. Target is at 148,820
JPYUSD trade ideas

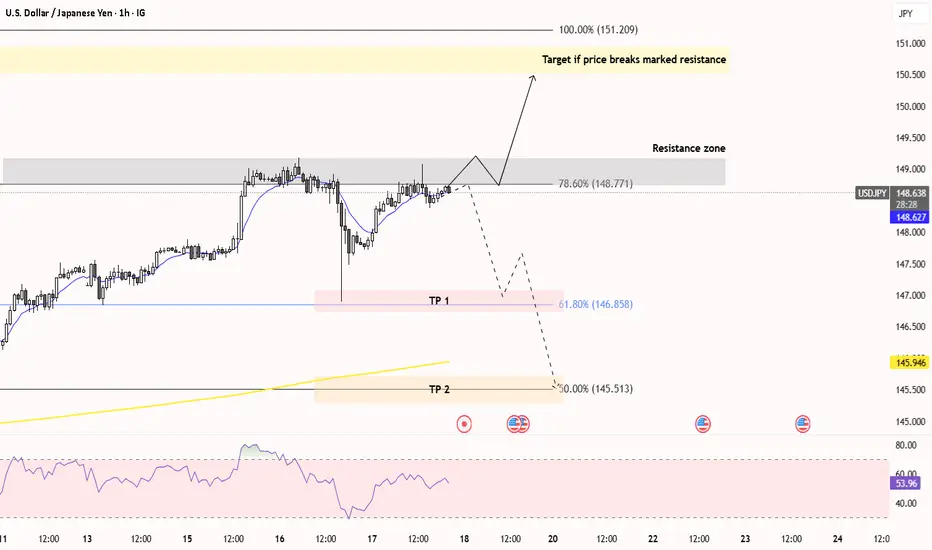
USD/JPY: Battle at Resistance - Bull Run or Rejection?Alright Traders,
Here's my breakdown of USD/JPY's next moves:
The price has been repeatedly testing a strong resistance zone (those areas I've highlighted). It's really trying to push through, but this resistance is holding firm.
Here's the game plan:
If price successfully breaks above this resistance, we could see a strong bull run. My target for this move would be the 150 - 151 JPY zone (that yellow highlighted area).
However, if price gets rejected from this resistance again, going short could be a good idea. We might see it drop to test the 61.80% Fibonacci retracement level, or even further down to the 50% Fibonacci level.
I've put this analysis together using Fibonacci retracements, moving averages, trend lines, and price action.
Patience is key here. We need to wait for clear confirmation: either the resistance breaks, or price gets rejected and breaks the trendline support for a short entry.
Trade smart!
USDJPY H1 CONFIRM ANALYSISThe Japanese Yen selling remains unabated through the early European session on Thursday, which along with a goodish pickup in the US Dollar demand, lifts the USD/JPY pair to the 148.80 region in the last hour. Data released earlier today showed that Japan clocked a smaller-than-expected trade surplus in June.

Good setup to short USDJPYRecently the risk emotions caused by the White House and inflation worries it produced drives long term US Treasury yields rising, with 20-yr yield cross up to 5% once again.
Yet, you can see that the yield difference are still at a dropping trend. Moreover, the Fed is expected to cut 125 bps in the next 15 months according to the swap market.
Combined with the techincal levels, it's a good price to get into a short position of USDJPY. I don't know about you guys. I'm in

USDJPY SELL IDEAAfter yesterday's spiky move caused by d.trump
Market should correct some of those imbalance soon
Target at the ERL

SHORT ON USD/JPYNice CHOC (Change of Character) on USD/JPY
Followed by a retest to the supply area/zone with massive wick rejection.
I will be selling USD/JPY looking to catch over 200 pips to the next level of support/demand.

Short idea on JPYLikely a double top with momentum weakness.
Hoping the market to fall from here
Trade at your own Risks


USDJPY SELLJapanese Yen adds to intraday losses; USD/JPY climbs to 148.80 amid broad-based USD strength
The Japanese Yen selling remains unabated through the early European session on Thursday, which along with a goodish pickup in the US Dollar demand, lifts the USD/JPY pair to the 148.80 region in the last hour. Data released earlier today showed that Japan clocked a smaller-than-expected trade surplus in June.
From a technical perspective, the USD/JPY pair showed some resilience below the 100-hour Simple Moving Average (SMA) on Wednesday, and the subsequent move up favors bullish traders. Moreover, oscillators are holding comfortably in positive territory and are still away from being in the overbought zone, suggesting that the path of least resistance for spot prices is to the upside. Hence, some follow-through strength back towards the 149.00 mark, en route to the overnight swing high near the 149.15-149.20 region, looks like a distinct possibility. The upward trajectory could extend further towards reclaiming the 150.00 psychological mark for the first time since late March.
On the flip side, the 148.00 round figure now seems to protect the immediate downside ahead of the Asian session low, around the 147.70 region. The latter nears the 100-hour SMA, below which the USD/JPY pair could retest sub-147.00 levels. Some follow-through selling might shift the bias in favor of bearish trades and drag spot prices to the 146.60 intermediate support en route to the 146.20 area, the 146.00 mark, and the 100-day SMA support, currently pegged near the 145.80 region\
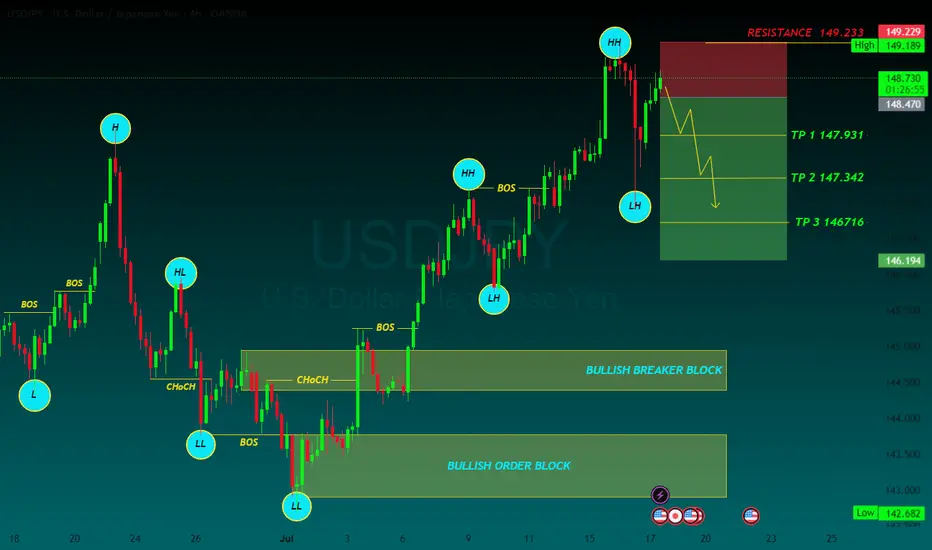
TP 1 147.931
TP 2 147.342
TP 3 146716
RESISTANCE 149.233
USDJPY SWING SHORTUSDJPY potential sell to fill downside liquidity following economic activities between the us and also the yen currency ,, target 140000

Advanced Order Types in ECN TradingAdvanced Order Types in ECN Trading
Electronic Communication Networks (ECN) have transformed the landscape of financial trading, offering direct market access and enhanced transparency. Central to ECN trading is the use of various order types, each tailored to specific strategies and risk management approaches. This article delves into advanced order types, providing traders with essential knowledge for navigating this dynamic trading environment.
Understanding ECN Trading
Electronic Communication Network (ECN) trading represents a pivotal development in financial markets, offering a pathway for traders to connect directly with each other without requiring intermediaries. This system functions through an electronic network that efficiently matches buy and sell trades, contributing to greater transparency and tighter spreads in the market.
In an ECN environment, traders can see the best available bid and ask prices, along with the market depth, which includes potential entries from various market participants. This visibility into the market's order book enables more informed decision-making as traders gain insights into potential market movements and liquidity.
A key advantage of ECNs is the anonymity they provide, enabling traders to execute transactions without exposing their strategy. This feature is particularly effective for large-volume traders who wish to avoid market impact.
ECN brokers, tend to offer lower costs compared to traditional market makers, as they typically charge a fixed commission per transaction rather than relying on the bid-ask spread. Such a cost structure can be advantageous for active traders and those employing high-frequency trading strategies.
Basic Market Order Types Explained
Forex and CFD trading involves several different order types, each serving unique strategies and goals. Among the most fundamental are market, limit and stop orders:
- Market: This type allows traders to buy or sell an asset at the current price. It's designed to offer immediate execution, making it ideal for traders who prioritise speed over control. They’re used when certainty of execution is more important than the execution price.
- Limit: Limit orders enable traders to specify the level at which they wish to buy or sell. A buy limit is set below the current price, while a sell limit is above. This type is used when traders seek to control the rate, accepting the risk of the entry not being filled if the market doesn’t reach their specified level.
- Stop: Stop orders act as a trigger for a trade. When the asset reaches the specified stop level, the stop becomes a market entry and executes a trade at the current price. It's a simple yet effective way to enter or exit the market at a predetermined point.
Advanced ECN Order Types
Advanced order types offer traders nuanced control over their transactions, catering to specific strategies and risk management needs. Here, we delve into three types: stop losses, trailing stops, and icebergs.
- Stop Loss: These are designed to limit a trader's loss on a position. A stop-loss order automatically sells (or buys, in the case of a short position) when the asset hits a predefined level. This tool is crucial in risk management, as it helps traders cap potential losses without the need to constantly monitor the charts.
- Trailing Stop: Trailing stop orders provide a dynamic way to manage risk. Instead of setting a fixed exit level like in a stop loss, a trailing stop moves with the current price at a set distance, potentially allowing traders to secure returns automatically as the market moves favourably, and adjusts to potentially protect against adverse moves.
- Iceberg: Named for the way only a small part of the total transaction is visible to the market, icebergs are used to buy or sell large quantities with small transactions. They prevent significant market impact, which could occur from a large trade and provide more discreet execution.
Stop Limit Orders Explained
In ECN trading, stop limit orders are an intricate yet powerful tool, blending the characteristics of stop and limit orders. A stop limit order type involves two prices: the stop price, which triggers the trade, and the limit price, at which the entry will be executed. It offers more control than a basic limit or stop order by specifying the exact range within which a trade should occur.
In a stop-limit buy order explained example, the stop price is set above the current price, and the limit price is set higher than the stop price. Once the stop level is reached, it becomes an order to buy at the limit price or better. It ensures that the trader does not pay more than a predetermined price.
The difference between a limit order and a stop order lies in their execution. A limit is executed at a specified value or better, but it doesn't guarantee execution. A stop, on the other hand, triggers at a specified price and then becomes a market entry executed at the current price. Stop limits merge these features, offering a targeted range for execution and combining the certainty of a stop order with the control of a limit order.
Conditional Orders
In ECN trading, conditional orders are sophisticated tools enabling traders to implement complex strategies. Here are the key types:
- One-Cancels-the-Other (OCO): An OCO links two orders; when one executes, the other is automatically cancelled. It's useful when setting up simultaneous profit and loss targets.
- One-Triggers-Another (OTA): An OTA activates a secondary instruction only after the primary order executes. They’re ideal for those planning successive actions based on initial trade execution.
- Ladder: This involves setting multiple orders at varying levels. As the market hits each level, a new order activates, allowing for gradual execution. They’re effective in managing entry and exit strategies in volatile assets.
- Order By Date (OBD): OBDs are time-based, executing on a specified date. It’s particularly useful for those looking to align their trades with specific events or timelines.
The Bottom Line
Mastering advanced order types in ECN trading may equip traders with the tools necessary for more effective strategy execution and risk management.
This article represents the opinion of the Companies operating under the FXOpen brand only. It is not to be construed as an offer, solicitation, or recommendation with respect to products and services provided by the Companies operating under the FXOpen brand, nor is it to be considered financial advice.
Yen Falls on Weak Trade DataThe Japanese yen weakened to around 148 per dollar on Thursday after disappointing trade data fueled concerns of a technical recession. June’s trade surplus came in at JPY 153.1 billion, well below the JPY 353.9 billion forecast and JPY 221.3 billion from a year earlier. Exports dropped 0.5% YoY, the second straight monthly decline, mainly due to the fallout from U.S. tariffs.
These signs have heightened fears of another quarterly contraction for Japan.
Resistance is at 147.75, with major support at 146.15.
Dollar-yen remains at a crossroadsUSDJPY gained more strongly than most other major pairs with the dollar in the aftermath of June’s higher American inflation. One of the key factors here seems to be generally disappointing trade data from Japan and rising concern in some quarters of a technical recession; weaker economic figures challenge the prevailing expectations that the BoJ will continue to hike rates, but a hike on 31 July still seems fairly likely.
¥149, also the area of the 200 SMA, is a key area: a close above there might signal a push up to ¥150 or possibly even higher. However, the price still hasn’t clearly broken above the previous resistance of the 38.2% weekly Fibonacci retracement slightly above ¥148. Another close above there with higher volume of buying might give more confidence of further gains.
There isn’t an obvious short-term support. ¥147, the limit of 16 July’s tail, is a possibility, but this isn’t confirmed. The 20 SMA is a lot lower; a move beyond there into the value area with the 50 and 100 SMAs seems very unlikely for now unless there’s major surprising news of tariffs or expectations for monetary policy shift dramatically.
This is my personal opinion, not the opinion of Exness. This is not a recommendation to trade.

Yen Weakness Deepens as Dollar Strength ResurfacesThe Japanese Yen continues to struggle, extending its multi-session decline against the U.S. Dollar. This morning’s weakness followed disappointing Japanese trade data, with June’s surplus falling well short of expectations due to another sharp contraction in exports, particularly to China. This trend has renewed fears that Japan may be slipping into a technical recession, which has further undermined confidence in the Yen.
Beyond trade numbers, Japan’s macro landscape is becoming increasingly fragile. Real wages have declined, inflation is cooling, and the Bank of Japan’s path to normalizing policy now appears more uncertain. Adding to the pressure, political risk is also rising ahead of the upcoming Upper House election, leaving markets without a clear direction from fiscal leadership.
In contrast, the U.S. Dollar is enjoying a resurgence. Federal Reserve members, including Williams and Logan, hinted this week that rates could remain higher for longer, particularly as President Trump’s latest wave of tariffs adds to inflation concerns. The administration’s recent clarification that there are no plans to replace Fed Chair Jerome Powell has also calmed investor nerves, restoring faith in policy stability. The result: increased demand for the dollar at the Yen’s expense.
Technical Outlook:
• Current price: Just below 148.60 resistance
• Support: 147.90 and 147.50
• Breakout potential: A decisive move above 148.60 could open the door toward 149.60 and even test the psychological 150.00 mark—last seen in March.
• Indicators: Price is supported by the 100-hour EMA with positive oscillator alignment.
Momentum remains bullish unless support at 147.90 is breached.
Takeaway: Expect continued volatility as the Yen reacts to domestic data while USD remains supported by Fed hawkishness and trade tensions.


USD/JPY – 4H Technical and Fundamental AnalysisUSD/JPY – 4H Technical and Fundamental Analysis
USD/JPY continues to gain bullish momentum, driven by stronger U.S. inflation data and rising Treasury yields. These macroeconomic factors have tempered expectations of aggressive Fed rate cuts, strengthening the dollar across the board—including against the yen. The Federal Reserve’s cautious tone, amid inflation tied to tariff pressures, further supports dollar strength.
Meanwhile, Japan faces ongoing political uncertainty with an upcoming election, and US-Japan trade negotiations remain sluggish. This creates hesitation around any near-term monetary tightening from the Bank of Japan (BOJ), keeping the yen under pressure and enhancing the bullish outlook for USD/JPY.
From a technical perspective, USD/JPY has broken above the key resistance level at 148.300, signaling renewed buying interest. After a brief consolidation—interpreted as an accumulation phase—price executed a liquidity hunt, triggering stop-losses placed above the resistance. This manipulation move set the stage for a potential continuation higher. Price is currently hovering near a minor key level.
We are now watching for a clear candle close above the 148.300 zone to validate further upside momentum. Once confirmed, we aim to enter long on a breakout play.
📍 Buy Setup
Entry: Buy Stop at 148.660
Stop Loss: 147.570
Take Profit: 150.870
📌 Disclaimer:
This is not financial advice. Always wait for proper confirmation before executing trades. Manage risk wisely and trade what you see—not what you feel.


USD/JPY(20250717)Today's AnalysisMarket news:
The annual rate of PPI in the United States in June was 2.3%, lower than the expected 2.5%, the lowest since September 2024, and the previous value was revised up from 2.6% to 2.7%. Federal Reserve Beige Book: The economic outlook is neutral to slightly pessimistic. Manufacturing activity declined slightly, and corporate recruitment remained cautious.
Technical analysis:
Today's buying and selling boundaries:
147.97
Support and resistance levels:
150.23
149.38
148.84
147.11
146.56
145.72
Trading strategy:
If it breaks through 147.97, consider buying in, and the first target price is 148.84
If it breaks through 147.11, consider selling in, and the first target price is 146.56

USD/JPY – Rising Wedge Meets Major ResistanceChart Overview:
USD/JPY is printing a textbook rising wedge formation, typically a bearish pattern—especially when occurring at the top of a major move.
What makes this setup compelling:
Price is testing the upper wedge resistance near the 148.50–149.00 region, a historically reactive zone.
There’s clear confluence with the 200 SMA, horizontal resistance, and wedge structure—all signaling potential exhaustion.
🔍 Key Technicals:
Resistance Zone: 148.00–149.00 (Highlighted Supply Zone)
Rejection Candle Pattern: Recent upper wick shows rejection and buyer fatigue
Bearish Divergence on RSI (14): Price made higher highs, RSI printed lower highs — a classic warning signal
🧠 Educational Note: Rising Wedge Patterns
A rising wedge is a bearish reversal pattern, especially potent when it forms after an extended rally. The structure narrows as buyers lose steam, leading to a likely breakdown once support is breached.
Pro Tip: Always confirm a wedge breakdown with a close below support + volume spike or bearish engulfing.
🔄 Invalidation:
This idea becomes invalid above 150.467, where the wedge breaks upward and price potentially enters a new bullish phase. Marked clearly as “Idea Invalid” on the chart.
🧠 Final Thoughts:
This chart combines price action, pattern structure, RSI divergence, and SMA confluence — a high-probability scenario favored by elite traders. If you trade based on confirmation rather than prediction, this could be a setup to watch closely.
🗣 Drop your thoughts or questions below!
💬 Let’s learn and grow together.

USDJPY H1 I Bearish Reversal Based on the H1 chart, the price is approaching our sell entry level at 148.61, a pullback resistance that aligns with the 78.6% Fib retracement.
Our take profit is set at 147.57, an overlap support.
The stop loss is set at 149.18 a swing high resistance.
High Risk Investment Warning
Trading Forex/CFDs on margin carries a high level of risk and may not be suitable for all investors. Leverage can work against you.
Stratos Markets Limited (tradu.com ):
CFDs are complex instruments and come with a high risk of losing money rapidly due to leverage. 66% of retail investor accounts lose money when trading CFDs with this provider. You should consider whether you understand how CFDs work and whether you can afford to take the high risk of losing your money.
Stratos Europe Ltd (tradu.com ):
CFDs are complex instruments and come with a high risk of losing money rapidly due to leverage. 66% of retail investor accounts lose money when trading CFDs with this provider. You should consider whether you understand how CFDs work and whether you can afford to take the high risk of losing your money.
Stratos Global LLC (tradu.com ):
Losses can exceed deposits.
Please be advised that the information presented on TradingView is provided to Tradu (‘Company’, ‘we’) by a third-party provider (‘TFA Global Pte Ltd’). Please be reminded that you are solely responsible for the trading decisions on your account. There is a very high degree of risk involved in trading. Any information and/or content is intended entirely for research, educational and informational purposes only and does not constitute investment or consultation advice or investment strategy. The information is not tailored to the investment needs of any specific person and therefore does not involve a consideration of any of the investment objectives, financial situation or needs of any viewer that may receive it. Kindly also note that past performance is not a reliable indicator of future results. Actual results may differ materially from those anticipated in forward-looking or past performance statements. We assume no liability as to the accuracy or completeness of any of the information and/or content provided herein and the Company cannot be held responsible for any omission, mistake nor for any loss or damage including without limitation to any loss of profit which may arise from reliance on any information supplied by TFA Global Pte Ltd.
The speaker(s) is neither an employee, agent nor representative of Tradu and is therefore acting independently. The opinions given are their own, constitute general market commentary, and do not constitute the opinion or advice of Tradu or any form of personal or investment advice. Tradu neither endorses nor guarantees offerings of third-party speakers, nor is Tradu responsible for the content, veracity or opinions of third-party speakers, presenters or participants.

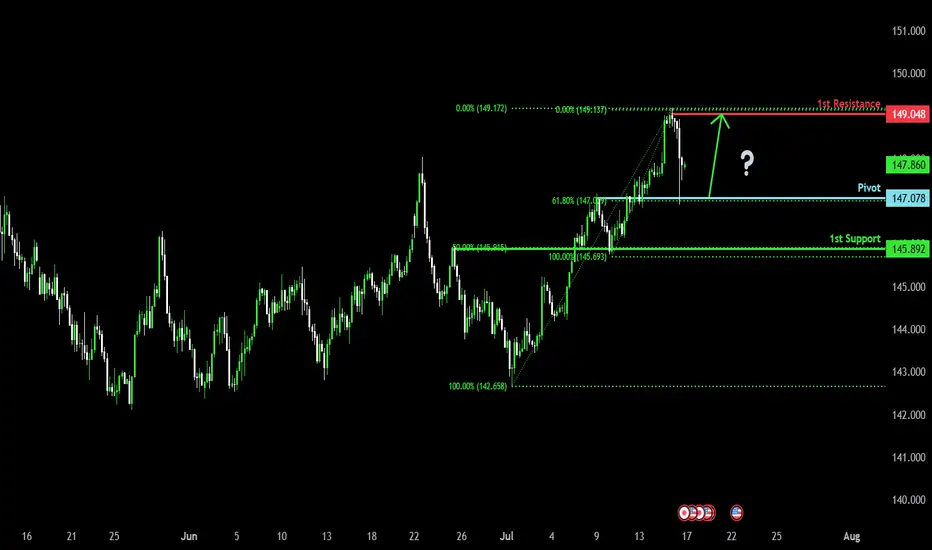
Bullish bounce off pullback support?USD/JPY is falling towards the pivot which aligns with the 61.8% Fibonacci retracement and could bounce to the 1st resistance.
Pivot: 147.07
1st Support: 145.89
1st Resistance: 149.04
Risk Warning:
Trading Forex and CFDs carries a high level of risk to your capital and you should only trade with money you can afford to lose. Trading Forex and CFDs may not be suitable for all investors, so please ensure that you fully understand the risks involved and seek independent advice if necessary.
Disclaimer:
The above opinions given constitute general market commentary, and do not constitute the opinion or advice of IC Markets or any form of personal or investment advice.
Any opinions, news, research, analyses, prices, other information, or links to third-party sites contained on this website are provided on an "as-is" basis, are intended only to be informative, is not an advice nor a recommendation, nor research, or a record of our trading prices, or an offer of, or solicitation for a transaction in any financial instrument and thus should not be treated as such. The information provided does not involve any specific investment objectives, financial situation and needs of any specific person who may receive it. Please be aware, that past performance is not a reliable indicator of future performance and/or results. Past Performance or Forward-looking scenarios based upon the reasonable beliefs of the third-party provider are not a guarantee of future performance. Actual results may differ materially from those anticipated in forward-looking or past performance statements. IC Markets makes no representation or warranty and assumes no liability as to the accuracy or completeness of the information provided, nor any loss arising from any investment based on a recommendation, forecast or any information supplied by any third-party.
USDJPY (Daily Update) 17/07hi everyone as we yesterdays video is pretty much showing us whats happened today i did not go in as much detail but hopefully this video you find helpful. as always happy trading
