Swing Setup On USDJPYUSDJPY has printed a reversals price action which is clear seen on the 4hr and the 1hr charts. On the 4hr, we can a Double bottom and the 1hr charts we can see price trying to break out from the bullish flag. Technically, we are to expert a bullish wave to a previous Supply zone has seen on the charts
JPYUSD trade ideas

USD Set To bounce? EUR/USD, USD/JPY, USD/CHFIt has been a week since the US dollar plunged following a weak NFP report. Given it has consolidated within a tight range near last week's low, alongside price action clues on EUR/USD, USD/JPY and USD/CHF, I suspect the dollar could bounce before its losses resume.
Matt Simpson, Market Analyst at City Index and Forex.com

USDJPY potential buy area!USDJPY 4H price has formed 2 important impulse and started to move back to the upside with new series of higher high and higher low showing a potential trend continuation.
Daily price is just crossed above 10ema and may pullback to daily 10ema which is also 4h support an important level where a bullish trade is high probale.

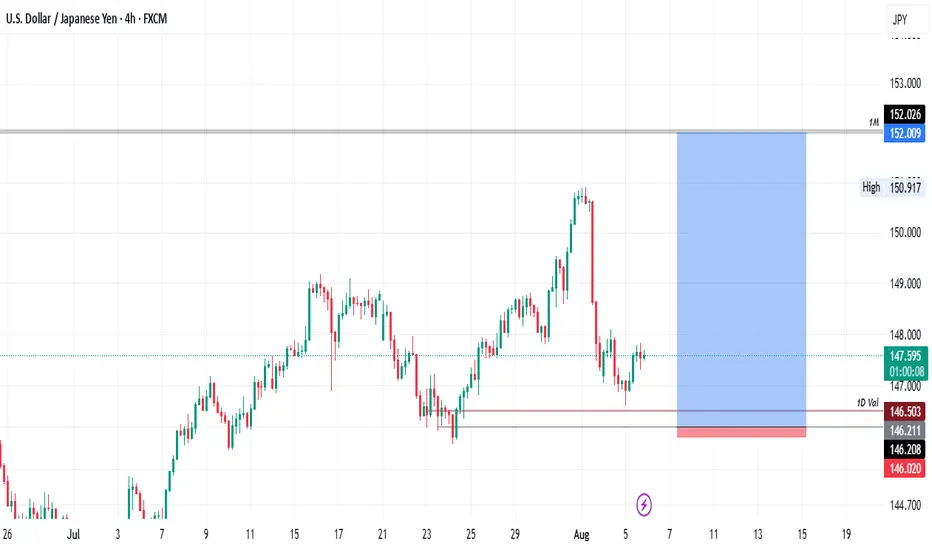
USDJPYUSDJPY Is moving in range
Sell/Short from Resistance Buy/long from Support
This plans on playable befroe CPI data tomorrow / Untill Support Or resistance breaks, trade it between Support & Resistance
Manage risk as per your capital
support resistance
Candle stick cofirmation

USDJPY - What do you think?- In the monthly (higher timeframes), USDJPY is bullish.
- In the weekly timeframe, USDDJPY is bullish with a clear BOS and a retest.
- In the daily timeframe, it is also in a clear uptrend.
- As convincing as it is to keep our focus on the current bullish price reaction, patience tells us otherwise to wait it out lower below the 1d validation and its preceding price structures.
- We are risking 19 Pips on this trade for a potential 1:30.
USD-JPY Local Short! Sell!
Hello,Traders!
USD-JPY made a retest
Of the horizontal resistance
Of 148.101 from where we
Are already seeing a bearish
Reaction so we will be
Expecting a further
Bearish move down
Sell!
Comment and subscribe to help us grow!
Check out other forecasts below too!
Disclosure: I am part of Trade Nation's Influencer program and receive a monthly fee for using their TradingView charts in my analysis.

Buy USD/JPY ( great bounce from 38.2% Fib level )Buy USD/JPY now. Perfect test and retest of 38.2% Daily Fib retracement of previous large move ( look on Daily, Weekly charts.)
Buy now : 147.00
Stop : 146.25
Profit : 149.7
Risk : 1-3.6


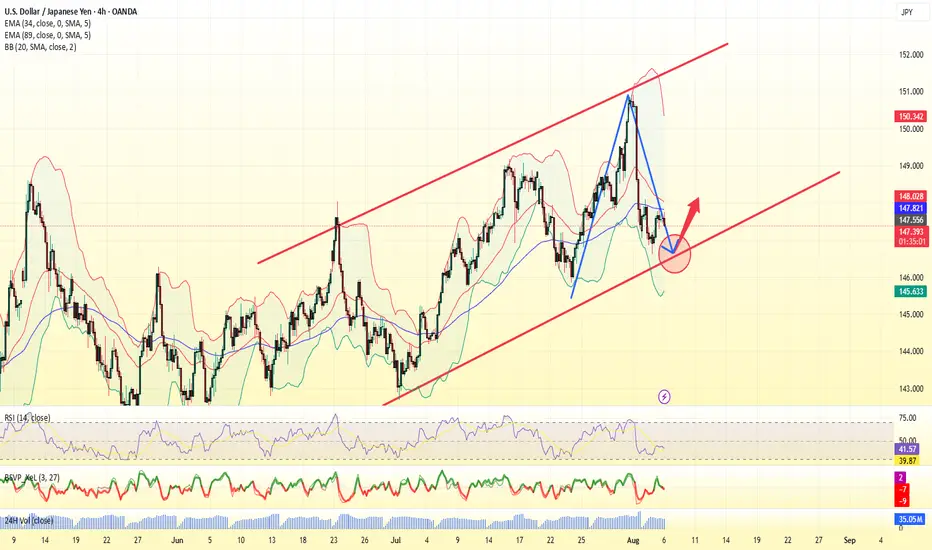
USDJPY BUY IDEA1. Ascending Channel Structure
Price has been respecting a rising channel for several weeks.
Currently testing channel support (lower trendline).
This suggests a critical decision point: bounce or break.
2. 200 EMA (likely)
Price is hovering just above a long-term moving average, acting as dynamic support.
A clean break below this could trigger bearish momentum.
3. Support & Resistance Zones
A gray demand zone aligns with recent consolidation (support area).
Price is hovering near this demand zone, meaning buyers could step in here.
Overhead resistance (at ~151.045) marks the final target zone for the long setup.
4. Long Position Markup
A buy setup is marked with:
Entry: Around 147.150
Stop Loss: Around 146.385
Take Profit: 151.045
Risk-Reward Ratio: ~1:5 (very favorable)
5. Bearish Candlestick Pressure
Recent candles show multiple rejections and pressure near structure.
But no clean break below the trendline or EMA yet.

USDJPY
The market is currently in a "decision zone", meaning price action around current levels will determine the next major move.
Direction Probability Confirmation Condition
📈 Bullish move to 155.733 ✅ 60–65% Hold above 147 support and break above 151 resistance
📉 Bearish move to 144/140 ❌ 35–40% Confirmed daily candle break below 147 level

USDJPY TRADE IDEA – LIQUIDITY GRAB & POTENTIAL DROP📉 USDJPY TRADE IDEA - LIQUIDITY GRAB & POTENTIAL DROP 💣
07 August 2025 | USDJPY | 30m TF
Following recent bullish corrective movement, price has now tapped into a premium supply zone marked by a previous inefficiency and liquidity buildup.
After sweeping short-term internal liquidity, USDJPY rejected cleanly from the marked POI, showing signs of exhaustion. With the overall market structure still favoring lower highs and lower lows, this area could serve as a strong distribution zone.
🧭 Current Bias:
I am anticipating price to reject deeper into the 146.622 region, aiming for liquidity resting below last week's low. Trade is active, and confirmation aligns with:
Bearish BOS on lower TFs
Strong reaction from premium zone
Favorable risk-to-reward setup (as seen in the projection box)
💡 Why this setup matters:
High probability reversal zone tapped
Confluence of imbalance + internal liquidity grab
Clear downside inefficiencies yet to be filled
Patience now becomes the strategy, letting price unfold to target the liquidity voids below.
#USDJPY #ForexSetup #SmartMoney #PriceAction #LiquidityGrab #OrderBlocks #SupplyZone #MarketStructure #TradeSmart #FXForecast #TradingPsychology #JpyTraders #ForexNigeria

USD increased slightly and JPY decreased deeplyThe world USD price increased slightly. The USD-Index reached 98.79 points, 0.08 points higher than yesterday. According to CNBC, the USD increased in value compared to most currencies as the market focused on President Donald Trump's personnel nomination for the US Federal Reserve (Fed). Yesterday, President Donald Trump said he would soon announce decisions on replacing Governor Adriana Kugler, who resigned last Friday, including choosing the next Fed chair. Fed Chair Jerome Powell's term will end in May 2026.
Yesterday's report from the Institute for Supply Management said that the US non-manufacturing purchasing managers' index (PMI) in July fell to 50.1 from 50.8 in June. Economists polled by Reuters had forecast the services PMI would increase to 51.5. A PMI reading above 50 indicates growth in the services sector, which accounts for more than two-thirds of the economy. Investors are pricing in a high probability that the Fed will cut interest rates at its September meeting. Investment bank Goldman Sachs expects the Fed to deliver three consecutive 0.25% rate cuts starting in September...
USDJPY Is Bullish! Buy!
Please, check our technical outlook for USDJPY.
Time Frame: 4h
Current Trend: Bullish
Sentiment: Oversold (based on 7-period RSI)
Forecast: Bullish
The market is approaching a significant support area 148.480.
The underlined horizontal cluster clearly indicates a highly probable bullish movement with target 149.489 level.
P.S
The term oversold refers to a condition where an asset has traded lower in price and has the potential for a price bounce.
Overbought refers to market scenarios where the instrument is traded considerably higher than its fair value. Overvaluation is caused by market sentiments when there is positive news.
Disclosure: I am part of Trade Nation's Influencer program and receive a monthly fee for using their TradingView charts in my analysis.
Like and subscribe and comment my ideas if you enjoy them!

USDJPY long set upBelow is the price action analysis on UJ to start ur week
Price might revisit the Order Block that created bullish ride up. And when price return to that block, I expect a push up from that point that might clear out that all time highest high at 161.847

USDJPY LONGUSDJPY is currently giving us a clear uptrend a HH and HL on the Daily timeframe , i am waiting for the retest of the trendline 3rd touch in confluence with the order block below to go long .

USDJPY drop evidentMulti-dimensional reasoning on market data shows that the current multi-party confidence continues to weaken, and the willingness to participate on the long side is insufficient. In the high-frequency trading trajectory, the system captures the typical weak market structure of "failed tentative rebound - active selling pressure intensifies - short-side active attack".
At the public opinion level, keywords such as "weak rebound", "overreaction to bearishness" and "emotional imbalance" appear frequently, and users and analysts are generally inclined to judge short-term weakness in their discussions. In conjunction with real-time capital flow monitoring, we found that small and medium-sized investors are accelerating their exodus behavior, and the short game structure is forming an advantage.
In the current market environment, the rebound is mostly technical or short-term liquidity replenishment triggered by weak sustainability, the strong pressure structure has not yet been destroyed. We suggests focusing on the "rebound - pressure - fall" short-term game window.

USDJPY: True Bullish Reversal?!The 📈USDJPY pair completed consolidating within a horizontal parallel channel.
A strong upward breakout above its resistance confirms a bullish trend.
I anticipate a corrective move down to around 149.00.


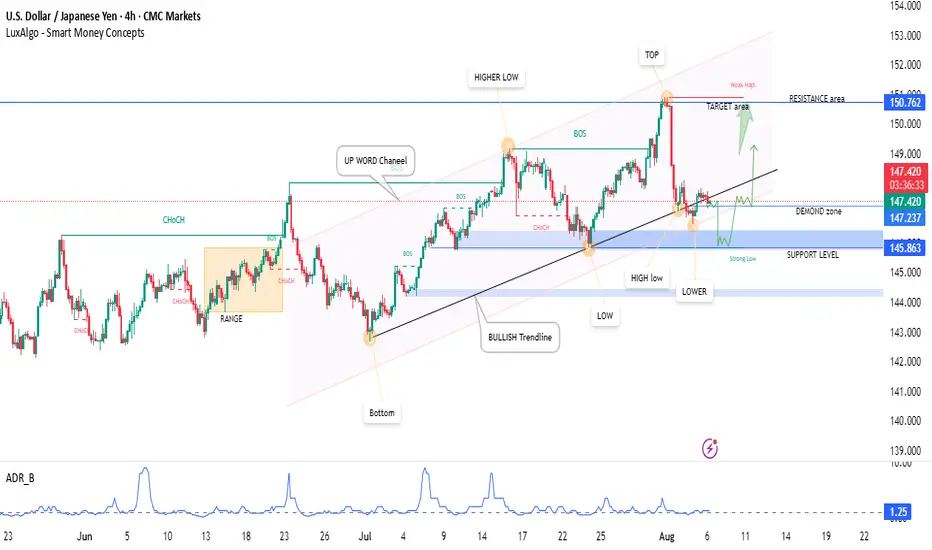
"USDJPY Smart Money Play | Bullish Rejection at Key Demand ZoneUSDJPY showing textbook Smart Money behavior!
✅ Key Highlights:
Bullish ChoCH and Break of Structure (BOS)
Strong bounce from the Demand Zone near 145.86 (marked Strong Low)
Retest of the Bullish Trendline inside the Upward Channel
Expecting continuation to TARGET area (150.76)
Lower Timeframe Entry: Look for confirmation on M15/M30 near 147.23
🧠 Smart money concepts at play:
Mitigation of previous lows
Liquidity sweep followed by bullish intent
Market structure shifting back to bullish
📈 Bias: Bullish
🎯 Short-term Target: 150.76 (Resistance Area)
🛑 Invalid if clean break below 145.86

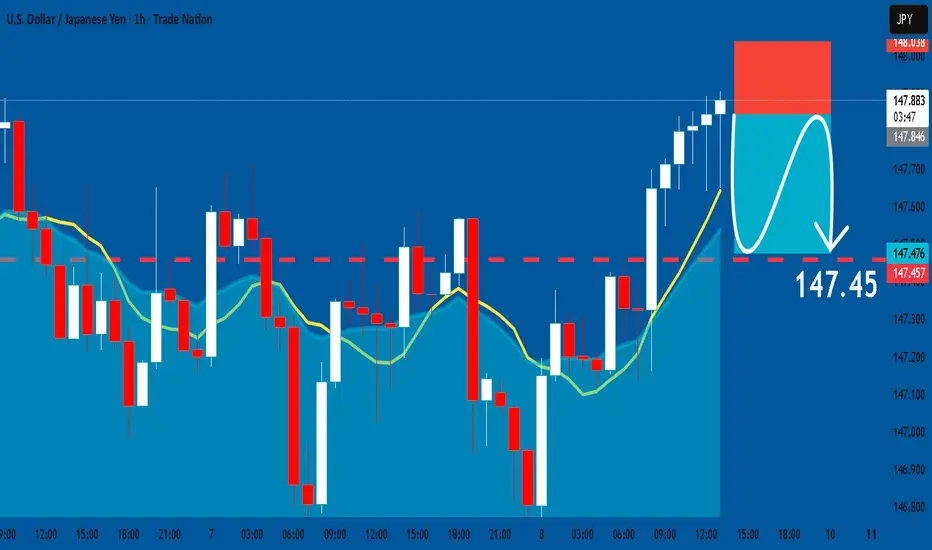
USDJPY: Short Trading Opportunity
USDJPY
- Classic bearish setup
- Our team expects bearish continuation
SUGGESTED TRADE:
Swing Trade
Short USDJPY
Entry Point - 147.84
Stop Loss - 148.03
Take Profit - 147.45
Our Risk - 1%
Start protection of your profits from lower levels
Disclosure: I am part of Trade Nation's Influencer program and receive a monthly fee for using their TradingView charts in my analysis.
❤️ Please, support our work with like & comment! ❤️
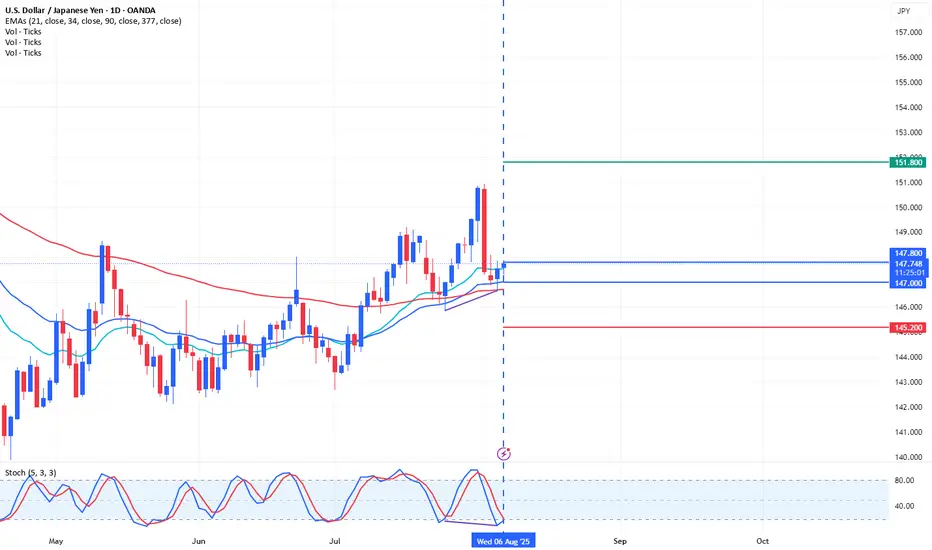
Trading Ideas USDJPY 1D [Disc On]Technical Analysis:
There is a hidden bullish stochastic divergence on the 1D timeframe, indicating a potential continuation of the previous trend. The price has also entered the Fibonacci 0.618 retracement area.
Conclusion:
There is a high probability of seeking BUY positions in the range of 147.800 – 147.000, with a Take Profit target at 151.800 and a Stop Loss at 145.200.
USD/JPY – 15M | OB Rejection SetupPrice is approaching the Order Block (OB) zone.
Scenario to watch:
📉 Bearish – Reject from OB (~148.75) → Break below P1D High (~148.20) → Target Swing Low (~147.80) and P1D Low (~147.15).
