USDJPY: Bearish Continuation is Highly Probable! Here is Why:
Remember that we can not, and should not impose our will on the market but rather listen to its whims and make profit by following it. And thus shall be done today on the USDJPY pair which is likely to be pushed down by the bears so we will sell!
Disclosure: I am part of Trade Nation's Influencer program and receive a monthly fee for using their TradingView charts in my analysis.
❤️ Please, support our work with like & comment! ❤️
JPYUSD trade ideas
USDJPY Wave Analysis – 7 July 2025
- USDJPY reversed from long-term support level 142.50
- Likely to rise to resistance level 148.00
USDJPY currency pair recently reversed up from the support zone located between the long-term support level 142.50 (which has been steadily reversing the price from August of 2024, as can be seen from the daily USDJPY chart below) and the lower daily Bollinger Band.
The upward reversal from this support zone stopped the previous short-term ABC correction 2 from the end of June.
Given the strength of the support level 142.50 and the strongly bearish yen sentiment seen today, USDJPY currency pair can be expected to rise to the next resistance level 148.00 (top of the previous waves 4, (1) and 1).

USDJPY ReversalUSDJPY started selling off nicely on Friday late trading session. Price has quickly regained bullish momentum but, we can expect a nasty reversal from this supply area towards 143,333

SELL USDJPYIn todays session we are monitoring USDJPY for selling opportunity. Our entry is at 145.746 and our stops are above 146.357 . Our targets is 143.376. Use proper risk management. Cheers

Japan Seeks US Deal as Tariff Deadline NearsThe yen hovered around 145 per dollar Friday after a nearly 1% drop in the previous session, pressured by trade uncertainties as Tokyo seeks a deal with Washington before next week’s deadline. Trump may announce new tariffs or extend deadlines today, having previously threatened tariffs up to 35% on Japanese goods over low US rice and car imports.
The yen also weakened as a stronger US dollar followed a better June jobs report, easing recession fears and reducing near-term Fed cut chances. In Japan, May household spending grew more than forecast, supported by government efforts to increase demand.
The key resistance is at $145.35, meanwhile the major support is located at $143.55.

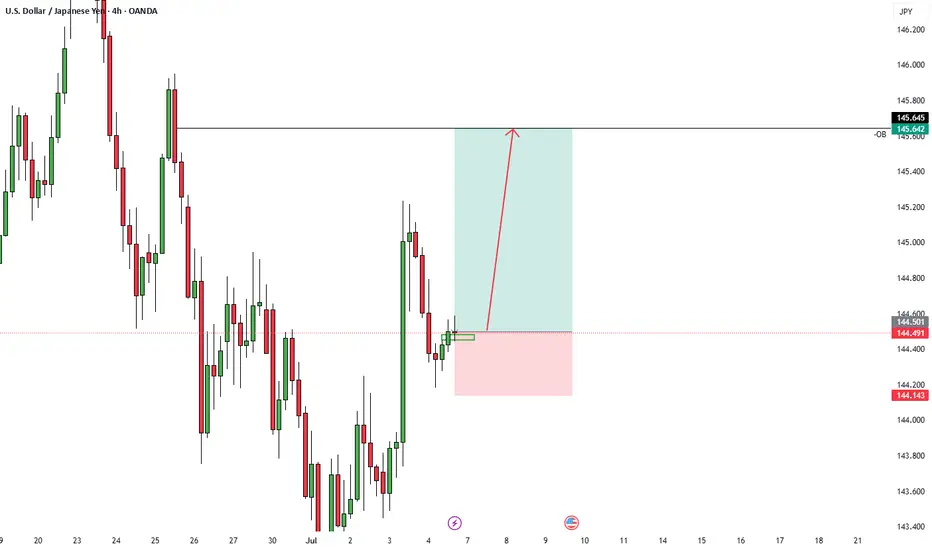
USD/JPY - continue with the UptrendOn USD/JPY , it's nice to see a strong buying reaction at the price of 143.860.
There's a significant accumulation of contracts in this area, indicating strong buyer interest. I believe that buyers who entered at this level will defend their long positions. If the price returns to this area, strong buyers will likely push the market up again.
(FVG) - Fair Value GAP and high volume cluster are the main reasons for my decision to go long on this trade.
Happy trading
Dale


USDJPY LONGMarket structure bullish on HTFs DH
Entry at both Weekly and Daily AOi
Weekly Rejection at AOi
Daily Rejection At AOi
Previous Structure point Daily
Around Psychological Level 144.000
H4 Candlestick rejection
Rejection from Previous structure
Levels 2.91
Entry 95%
REMEMBER : Trading is a Game Of Probability
: Manage Your Risk
: Be Patient
: Every Moment Is Unique
: Rinse, Wash, Repeat!
: Christ is King.

BUY usdjpy
The JPY sector is going to be the most promising sector, for the next half of the year, low risk, huge margin of safety, economic indicators are supportive of the pairs intrinsic value .
It's advisable to place huge amount of your portfolio into this sector

USDJPY FREE STRATEGYHere is a brief strategy on how to successfully trade usdjpy and become profitable.

USDJPY h4 strong downResistance Reversal Zone: 145.80–146.20 (watch for break or rejection).
Support Trap Area: 143.80–144.20 (possible fakeout and rally).
Breakout Confirmation: Sustained candle close above 146.30.
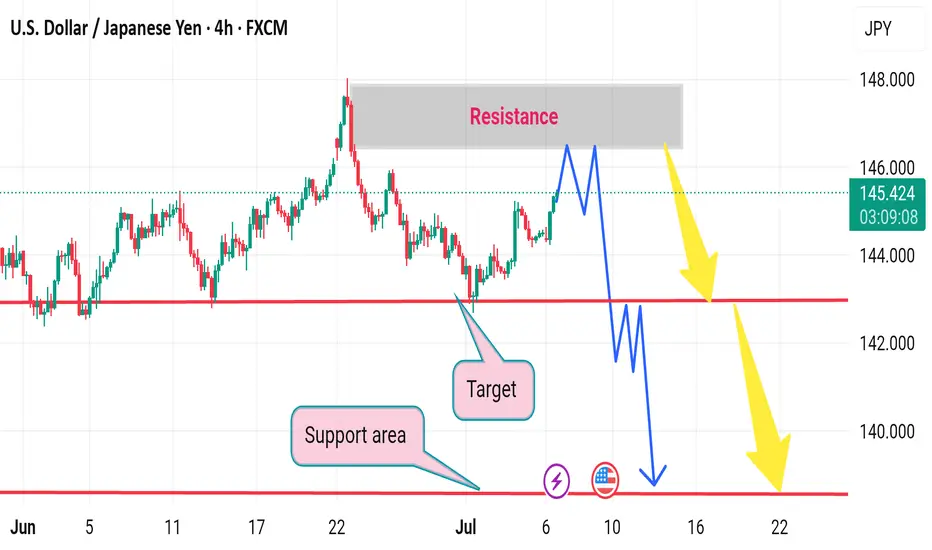
BUY If it activates, we are in control.* ✅ **Do not manually enter early** — let the price pull back naturally.
* 🧘♂️ Your job is only to **execute with discipline**, not predict.

USDJPY1. Inverted Head and Shoulders Pattern
This is a classic bullish reversal pattern.
You've marked the left shoulder, head, and right shoulder, and the neckline is broken to the upside.
Breakout confirms trend reversal from bearish to bullish.
2. Break of Trendline
A long-term bearish trendline was clearly broken.
Price broke above it with momentum, showing bullish strength.
3. Fib Confluence
Entry area is around the 61.8%–78.6% Fibonacci retracement zone.
Combined with support zone = high-probability reversal area.
4. Change of Character (CHoCH)
CHoCH confirms that the market has shifted structure from lower highs/lows to potential higher highs/lows.
You can see the higher low (HL) forming already.
5. Strong Bullish Candles
The breakout move is supported by strong bullish candles, showing buying pressure.
We're entering on a confirmed bullish reversal – Inverted Head & Shoulders breakout, trendline breach, and bullish market structure shift. Fib zone confluence seals the setup. Buy-side pressure is in control.

USDJPY 1:3 4HR Trade Idea - ICTBeautiful 1:3 Trade idea on USDJPY - I am bearish on DXY and also bearish on JXY but the pair itself is shifting bullish so I am more inclined into a long (this is due to JXY dropping more rapidly than DXY shifting it bullish).
USDJPYPotential long
- Bullish engulfing candle sticks
- CHOCH - change of momentum
- USD gaining strength
- wait for break of structure again
- wait for retest on demand zone

USDJPY (Update)Hi everyone hope the video helps nice continuation of the bulls looking for that untapped daily wick zone this week. hope everyone is having a great start to the week. I have a full house at the moment with family visiting so I will probably be limited with posting. any questions feel free to message me directly and i will try get to it as soon as i can.
Happy Trading!!!

Buy USDJPYAs I mentioned in the analysis I posted a few hours ago about USDJPY, if it reacts well to the trendline, we could consider a buying opportunity.

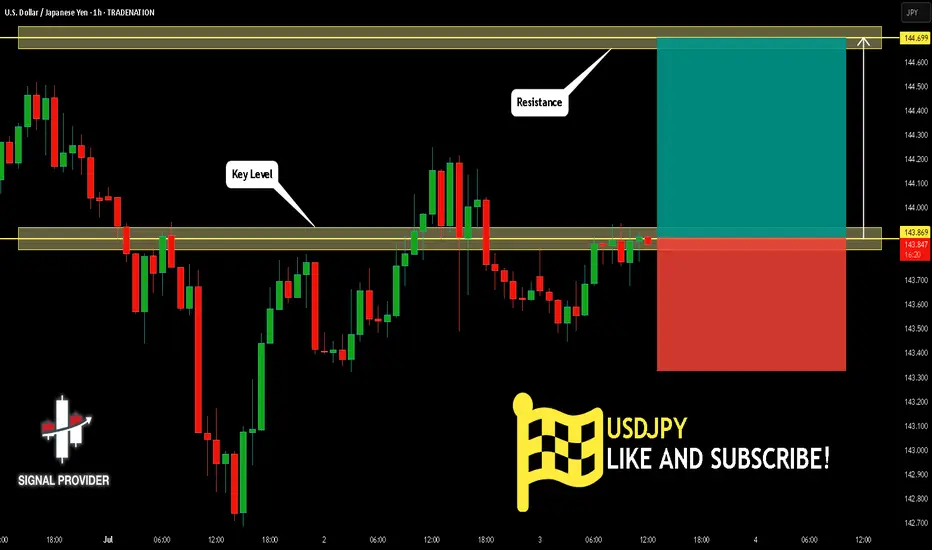
USDJPY Is Bullish! Buy!
Take a look at our analysis for USDJPY.
Time Frame: 1h
Current Trend: Bullish
Sentiment: Oversold (based on 7-period RSI)
Forecast: Bullish
The market is on a crucial zone of demand 143.869.
The oversold market condition in a combination with key structure gives us a relatively strong bullish signal with goal 144.699 level.
P.S
We determine oversold/overbought condition with RSI indicator.
When it drops below 30 - the market is considered to be oversold.
When it bounces above 70 - the market is considered to be overbought.
Disclosure: I am part of Trade Nation's Influencer program and receive a monthly fee for using their TradingView charts in my analysis.
Like and subscribe and comment my ideas if you enjoy them!
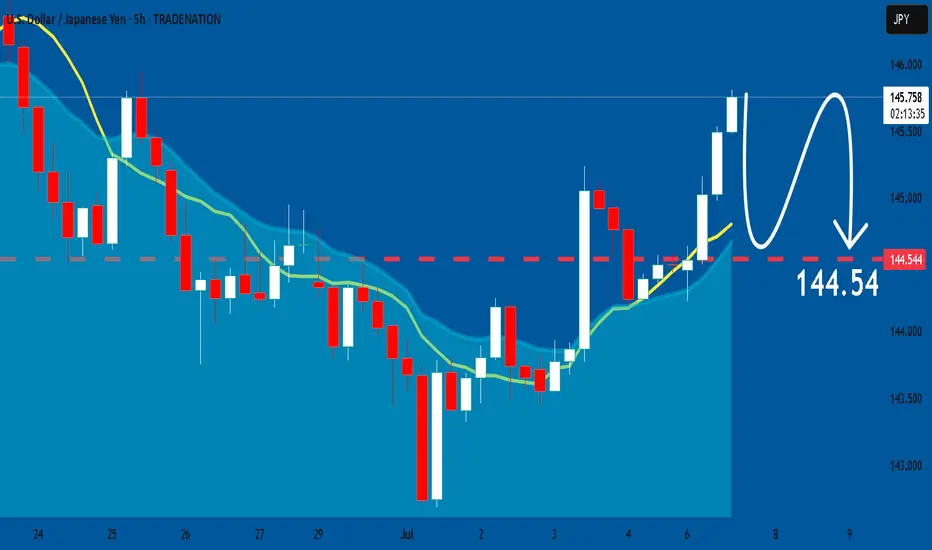
USD/JPY - Channel BreakoutThe USD/JPY pair on the M30 timeframe presents a Potential Selling Opportunity due to a recent Formation of a Breakout Pattern. This suggests a shift in momentum towards the downside and a higher likelihood of further advances in the coming hours.
Possible Short Trade:
Entry: Consider Entering A Short Position around Trendline Of The Pattern.
Entry (Sell Limit): 144.435
Stop Loss: 144.669
Take Profit: 143.768
This is Sell Limit entry and wait for pullback to enter the trade

Analysis on USD/JPY LONGHello! As we all know the Thursday NFP came in positive for USD thereby making usd to be in stronger position against the JPY. More analysis are stated below
US–Japan Interest Rate Divergence
Bank of Japan (BoJ) remains cautious post its January rate hike, with rates near 0.5% and monetary policy likely on hold through 2025
U.S. Federal Reserve (Fed) has postponed cuts amid robust job data and inflation above target; markets have pulled forward rate cut expectations to autumn rather than summer .
The interest-rate gap (USD >4%, JPY ~0.5%) favours a stronger dollar but carries a steep “carry cost” for yen investors .
Economic Outlooks & Trade Dynamics
Japan’s Q2 business sentiment (Tankan) is slightly positive, despite export weakness due to tariff risks
U.S.–Japan trade tensions are escalating, with looming tariffs on Japanese car imports potentially impacting growth and yen sentiment
reddit.com
Persistent Japanese inflation (~2.5% in Tokyo) and wage gains (~2.8%) bolster long-term BoJ tightening expectations
Summary: The dollar remains supported by stronger U.S. policy and treasury yields. Meanwhile, Japan’s cautious BoJ, inflation, and trade vulnerabilities push the yen—and thus USD/JPY—into a volatile bracket.


Buy USDJPYUSDJPY remains in an uptrend on the 1-hour chart and is currently testing the trendline for the third time. A strong bullish reaction at this level may signal a potential buying opportunity.

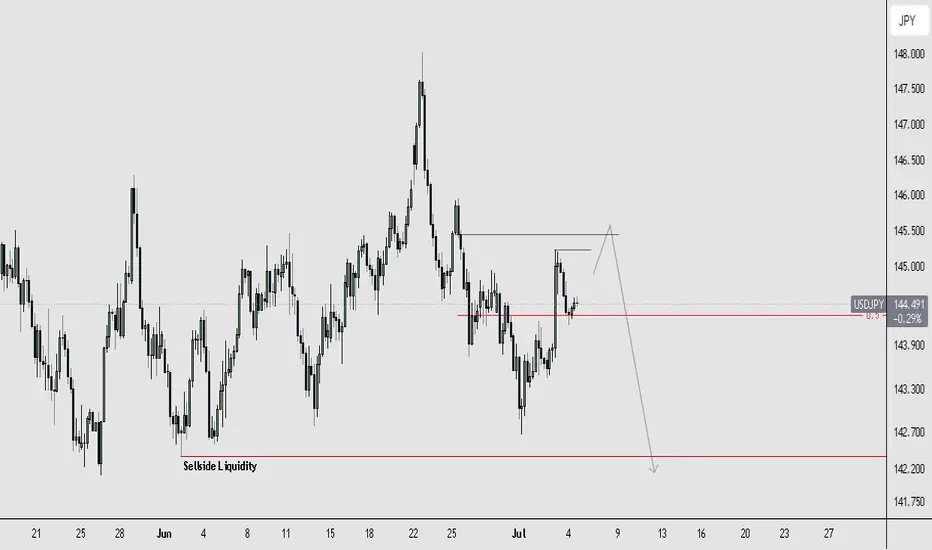
USDJPY BEARISH SETUPI am expecting price to raid the buyside liquidity resting above the previous week high. This area coincides with a Bearish Order Block (OB) that I have marked as the ideal zone for price to reverse from.
Execution Outlook:
Bias: Bearish
Short-Term Expectation: Price to push higher to raid buyside liquidity and tap into the OB.
Trigger Zone: OB above the 50% level – this is where I expect the reversal.
Target: Sell-side liquidity below the recent swing lows (~142.200 area).
Invalidation: A clean break and close above the OB would invalidate the bearish idea.