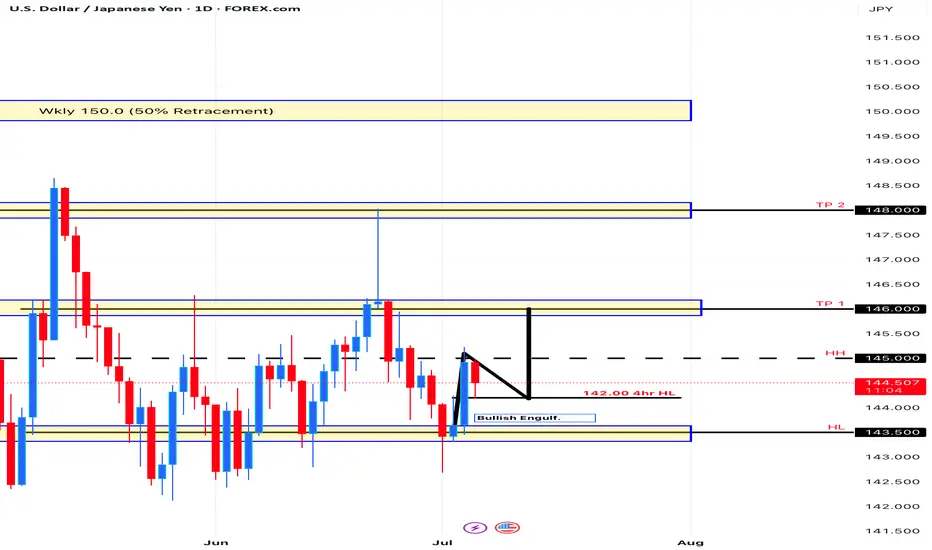
Uptrend USD/JPYDaily - uptrend
4hr- uptrend
Price hit a key level at 145.000
We can possibly see a retrace back to the 4hr HL @ 144.200 then shoot up to the 1st TP @ 146.000
JPYUSD trade ideas
USD/JPY pair struggles due to a weaker US DollarOn the JPY side, nothing has changed fundamentally, and the currency has been mainly driven by the risk sentiment. As a reminder, the BoJ kept interest rates unchanged at 0.5% and reduced the bond tapering plan for fiscal year 2026 as expected at the last meeting. The BoJ continues to place a great deal on the US-Japan trade deal and the evolution of inflation.
USD/JPY is moving lower despite the disappointing Industrial Production report from Japan. The report showed that Industrial Production increased by +0.5% month-over-month in May, compared to analyst forecast of +3.5%. However, I think that if we respect this area, we might see upward momentum coming soon.

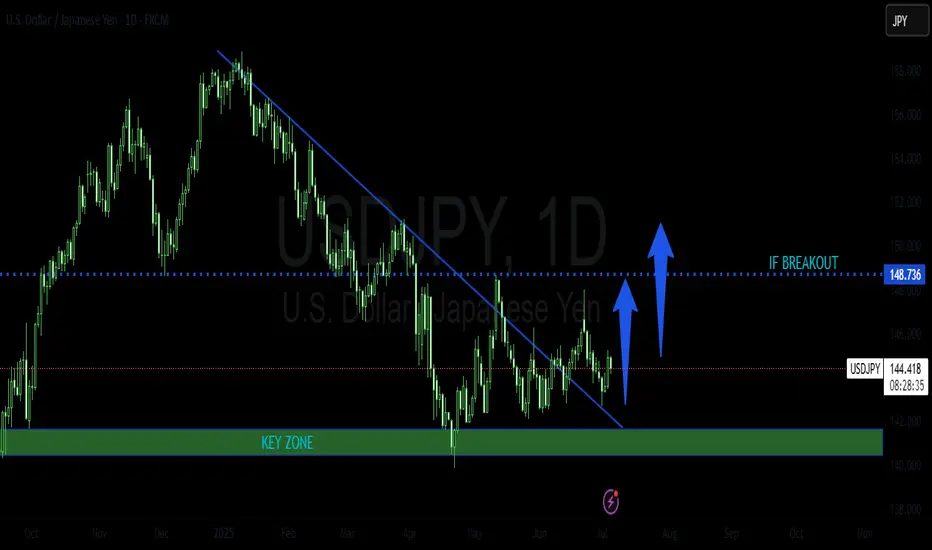
USDJPY POSSIBLE LONG TRADE PLANThe pair has been trading in a bearish trend for sometime now. It has recently rejected near a key zone and broke out a falling trend line. It looks like it is now retesting this zone before initiating a bull movement.
Please do your own analysis before placing any trades.
Cheers and happy trading !!!

Trading Recommendations and Analysis for USDJPYThe technical picture on Monday may shape future developments in the medium term. The week began a gap up, followed by the formation of a long upper shadow. The daily close occurred exactly at the support level of 146.11 thereby closing the gap.
Today's trading also opened exactly at the same level, and the candle is already black in the early hours of trading. This defines Monday's movement as false, thus creating a strong bearish signal, with a potential breakdown of the 143.45 support and a subsequent decline toward the MACD line, which coincides with the target level of 141.70. The Marlin oscillator has turned downward. its return to negative territory will add additional pressure on the price.
In the H4 timeframe, the price has consolidated below the 146.11 level, making it easier to settle below the MACD line eventually.
A break below 145.48 -the June 11 high-will serve as confirmation. The Marlin oscillator appears to be fixed in bearish territory and has joined the new downward movement.

USD/JPY loses bulk of NFP-related gainsThe USD/JPY has given back a bulk of yesterday's NFP-driven gains. Although the data was not as strong as the headlines suggested, the fact that we saw decent moves in bond and equity markets suggests investors were overall impressed by the figures. So it seems the market is preparing itself for some more tariff-related volatility as we approach the 9 July deadline, when 'Liberation Day' tariffs will revert. Trump has suggested letters are being sent out to trading partners over the next few days, informing them of their new tariff rate. If you recall, during the worst of April's volatility, the likes of the franc, euro and yen were all outperforming. Could we see a similar pattern this time?
Well, looking at the USD/JPY, traders have certainly sold into yesterday's rally. But we need a more decisive breakdown of support between 140.00-140.25 now to trigger some long side liquidation. Below this area, key support comes in around 142.50. Resistance comes in at 145.00, followed by 146.00.
By Fawad Razaqzada, market analyst with FOREX.com

USDJPY 4-Hour Technical Analysis (Smart Money Concept Breakdown)📈 Overall Market Structure Overview:
The chart reflects a multi-phase Smart Money playbook, consisting of:
Bullish channel structure
Breakout followed by liquidity sweep
Supply zone flip to demand
Price mitigation and structure shift
Anticipated reaction zone for upcoming move
🔎 Phase-by-Phase Analysis:
🧱 1. Ascending Channel Formation
Price was moving upward in a controlled bullish ascending channel, suggesting institutional accumulation with planned distribution above highs.
The channel breakout was the first significant liquidity event, where early breakout traders were baited.
💧 2. Fakeout and Supply Interchange into Demand (Ellipse Zone)
Once the channel broke, price sharply reversed, retracing into a previous supply zone.
However, institutions defended this zone, flipping it into a demand area.
This behavior, marked with the blue ellipse, signals “Supply Interchange in Demand” – a core SMC concept.
Here, orders were absorbed
Liquidity was trapped below
A bullish push confirmed institutional intent
🎯 3. Previous Target Hit – Completion of Bullish Leg
Price made a strong rally from the demand zone, hitting the previous target near 147–148 zone.
This bullish leg created a Major Break of Structure (BOS) confirming bullish dominance at that phase.
⚠️ 4. Distribution Begins: Shift in Momentum
After reaching the Major BOS area, price failed to hold higher levels.
A decline followed, indicating distribution by smart money.
The reaction was sharp and consistent, creating lower highs, signaling weakness.
🔄 5. Minor CHoCH Formation – Early Reversal Signal
A Minor Change of Character (CHoCH) occurred around the 144.000–143.000 area.
This is a key transition, where smart money transitions from bullish intent to potential bearish delivery.
📦 6. Next Target Zone – Bullish POI (Point of Interest)
The chart identifies a next target demand zone around 141.800–141.200, marked in green.
This zone:
Holds unmitigated demand
Sits below a recent liquidity pool
Aligns with past support
This is where Smart Money could re-enter, offering a long opportunity if a bullish CHoCH or BOS forms from that zone.
📊 Trade Scenarios & Forecast:
🔻 Bearish Short-Term Play (Sell Setup):
If price respects current resistance (144.500–145), and a lower high forms:
Short entry opportunity
Target: 142.000–141.200 demand zone
Confirmation: Strong bearish candle, CHoCH below minor support
🔺 Bullish Reversal Play (Buy Setup):
At the demand zone:
Look for bullish reaction + CHoCH or BOS
Long entry potential
Target: Retest of 144.000 or even 147.000 if liquidity allows
🔐 Smart Money Tactics in Play:
Liquidity Engineering:
Price trapped both bulls (at highs) and bears (below ellipse zone)
Supply into Demand Flip:
A classic trap where supply becomes a launchpad for bullish delivery
Minor CHoCH:
Early signal of intent change
Next POI (Point of Interest):
Potential reaccumulation zone below major liquidity grab
🧠 Educational Takeaway:
This analysis illustrates:
Why breakouts are often traps without confirmation
How to identify real institutional zones
The role of CHoCH/BOS in planning ahead
Importance of waiting for price to come to your levels, not chasing
⚠️ Risk & Caution:
News catalysts can cause deviation from technical levels
Always use stop loss and proper risk management
SMC is about patience and precision, not prediction
✅ Summary:
USDJPY is showing early signs of a smart money distribution and a potential pullback toward demand.
Watch closely for confirmation at the key zone (141.800–141.200) before engaging long. Until then, short setups on rallies may be favorable.

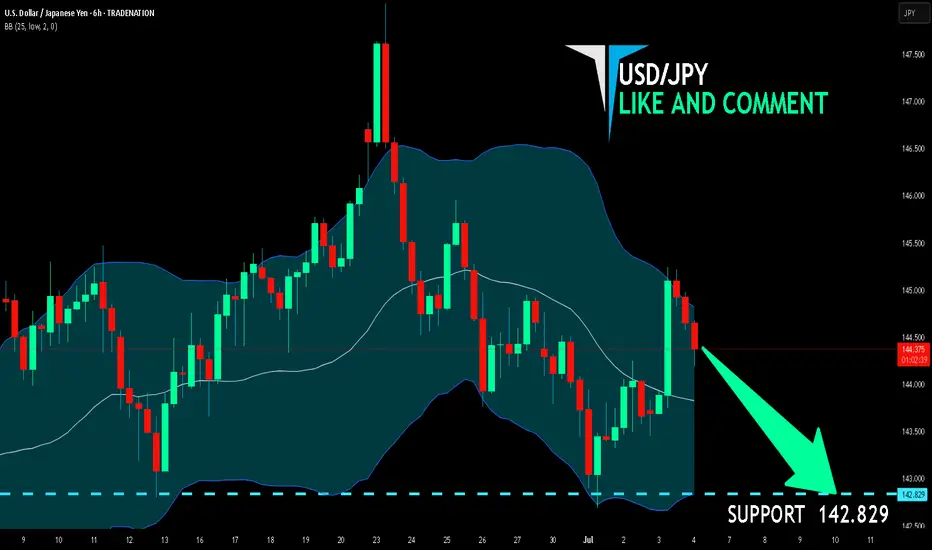
USD/JPY SENDS CLEAR BEARISH SIGNALS|SHORT
Hello, Friends!
USD-JPY uptrend evident from the last 1W green candle makes short trades more risky, but the current set-up targeting 142.829 area still presents a good opportunity for us to sell the pair because the resistance line is nearby and the BB upper band is close which indicates the overbought state of the USD/JPY pair.
Disclosure: I am part of Trade Nation's Influencer program and receive a monthly fee for using their TradingView charts in my analysis.
✅LIKE AND COMMENT MY IDEAS✅
MarketBreakdown | USDJPY, USDCAD, BITCOIN, SILVER
Here are the updates & outlook for multiple instruments in my watch list.
1️⃣ #USDJPY daily time frame 🇺🇸🇯🇵
The market nicely respected a rising trend line
and bounced from that, forming a high momentum bullish candle.
I think that the pair will continue rising and reach 145.8 level soon.
2️⃣ #USDCAD daily time frame 🇺🇸🇨🇦
The price is currently approaching an important confluence
zone based on a falling trend line and a horizontal support.
I will expect a pullback from that.
3️⃣ #BITCOIN #BTCUSD daily time frame
The price successfully violated a resistance line of a bullish
flag pattern and closed above that.
It is a critical bullish signal. I believe that the price will test
a current high then and will violate that with a high probability.
4️⃣ #SILVER #XAGUSD daily time frame 🪙
The market broke a resistance line of a bullish flag.
Uptrend is going to continue, and the price is going to reach 37,14 level soon.
Do you agree with my market breakdown?
❤️Please, support my work with like, thank you!❤️
I am part of Trade Nation's Influencer program and receive a monthly fee for using their TradingView charts in my analysis.

USD/JPY💰Symbol: { USD/JPY }
🟩Price: { 144.818 }
🟥Stop: { 145.567 }
1️⃣profit: { 144.191 }
2️⃣profit: { 143.459 }
3️⃣profit: { 142.771 }
4️⃣profit: { 142.207 }
📊Check your chart before entering.
🚨Check before use to make sure there is no important news.🚨

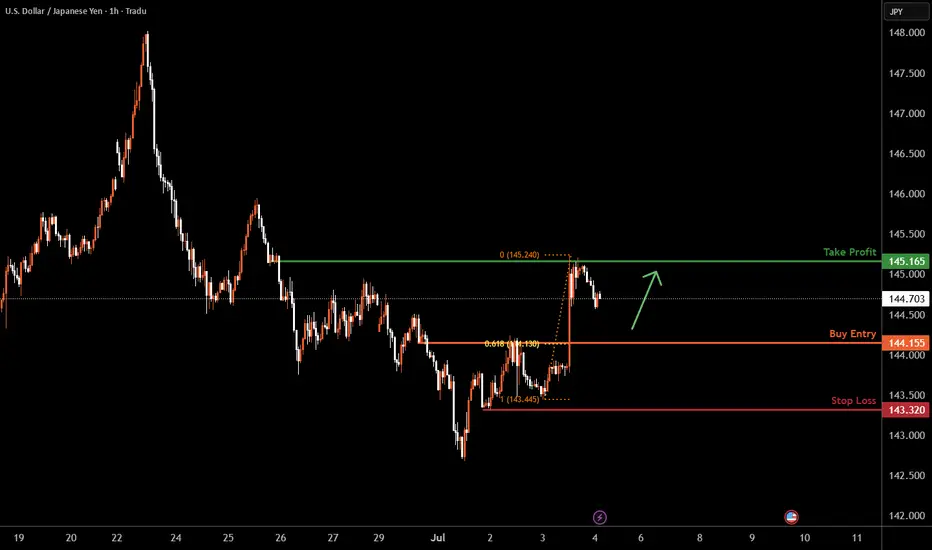
USDJPY H1 I Bullish Bounce off the 61.8% FibBased on the H1 chart analysis, the price is falling our buy entry level at 144.15, a pullback support that aligns with the 61.8% Fib retracement.
Our take profit is set at 145.16, an overlap resistance.
The stop loss is placed at 143.32, a swing low support.
High Risk Investment Warning
Trading Forex/CFDs on margin carries a high level of risk and may not be suitable for all investors. Leverage can work against you.
Stratos Markets Limited (tradu.com ):
CFDs are complex instruments and come with a high risk of losing money rapidly due to leverage. 63% of retail investor accounts lose money when trading CFDs with this provider. You should consider whether you understand how CFDs work and whether you can afford to take the high risk of losing your money.
Stratos Europe Ltd (tradu.com ):
CFDs are complex instruments and come with a high risk of losing money rapidly due to leverage. 63% of retail investor accounts lose money when trading CFDs with this provider. You should consider whether you understand how CFDs work and whether you can afford to take the high risk of losing your money.
Stratos Global LLC (tradu.com ):
Losses can exceed deposits.
Please be advised that the information presented on TradingView is provided to Tradu (‘Company’, ‘we’) by a third-party provider (‘TFA Global Pte Ltd’). Please be reminded that you are solely responsible for the trading decisions on your account. There is a very high degree of risk involved in trading. Any information and/or content is intended entirely for research, educational and informational purposes only and does not constitute investment or consultation advice or investment strategy. The information is not tailored to the investment needs of any specific person and therefore does not involve a consideration of any of the investment objectives, financial situation or needs of any viewer that may receive it. Kindly also note that past performance is not a reliable indicator of future results. Actual results may differ materially from those anticipated in forward-looking or past performance statements. We assume no liability as to the accuracy or completeness of any of the information and/or content provided herein and the Company cannot be held responsible for any omission, mistake nor for any loss or damage including without limitation to any loss of profit which may arise from reliance on any information supplied by TFA Global Pte Ltd.
The speaker(s) is neither an employee, agent nor representative of Tradu and is therefore acting independently. The opinions given are their own, constitute general market commentary, and do not constitute the opinion or advice of Tradu or any form of personal or investment advice. Tradu neither endorses nor guarantees offerings of third-party speakers, nor is Tradu responsible for the content, veracity or opinions of third-party speakers, presenters or participants.
USDJPY Forecast – Bullish Roadmap with Key Retracement LevelsUSDJPY is currently sitting around 144.658. From this level, I’m anticipating a short-term retracement down toward the 143.800 zone, which may act as a demand area or liquidity grab before a bounce.
From 143.800, price is expected to climb back to 144.646, potentially breaking slightly above into 144.652, where intraday liquidity or stop hunts might occur. If bullish momentum remains strong, a slight retracement into the 145.132 region could follow — possibly retesting a breakout zone or OB — before a final bullish continuation*targeting 147.353.
> 🔽 Short-term pullback zone: 143.800
> 🔼 Initial bullish target: 144.646 – 144.652
> 🔁 Expected mid-level retracement: 145.132
> 🎯 Final bullish target: 147.353
> 📍 Current price: 144.658
I’ll be monitoring each key level closely for reactions such as W formations, bullish engulfing candles, or break of internal structure to confirm momentum shifts.
📌 Risk Management Note:
This is not financial advice. Always use strict risk management:
✔️ Risk no more than 1–2% per trade
✔️ Use proper **risk-to-reward setups (min 1:2 RR)
✔️ Wait for **clear confirmations before entering
✔️ Protect capital — consistency beats intensity

Another supplement to the previous bullish setupAs we now have bounced off as I described in the previous idea. This month is bullish
Ps: Whoever says trendlines don't work I can explain to you in whatever strategy you use it's the umbrella ☔ of all forex strategies. Fibonacci, SnDs, ICTs, even FVGs like this example here. FVG trader can confirm. Etcetera

Bearish reversal?USD/JPY has rejected off the pivot and could potentially drop to the 38.2% Fibonacci support.
Pivot: 145.22
1st Support: 144.17
1st Resistance: 145.91
Risk Warning:
Trading Forex and CFDs carries a high level of risk to your capital and you should only trade with money you can afford to lose. Trading Forex and CFDs may not be suitable for all investors, so please ensure that you fully understand the risks involved and seek independent advice if necessary.
Disclaimer:
The above opinions given constitute general market commentary, and do not constitute the opinion or advice of IC Markets or any form of personal or investment advice.
Any opinions, news, research, analyses, prices, other information, or links to third-party sites contained on this website are provided on an "as-is" basis, are intended only to be informative, is not an advice nor a recommendation, nor research, or a record of our trading prices, or an offer of, or solicitation for a transaction in any financial instrument and thus should not be treated as such. The information provided does not involve any specific investment objectives, financial situation and needs of any specific person who may receive it. Please be aware, that past performance is not a reliable indicator of future performance and/or results. Past Performance or Forward-looking scenarios based upon the reasonable beliefs of the third-party provider are not a guarantee of future performance. Actual results may differ materially from those anticipated in forward-looking or past performance statements. IC Markets makes no representation or warranty and assumes no liability as to the accuracy or completeness of the information provided, nor any loss arising from any investment based on a recommendation, forecast or any information supplied by any third-party.

End of Week analysis (USDJPY)Sorry for the late video but we are looking good for another continuation day. we have some strong bullish momentum now to tap into that untapped daily wick. from there we will see some strong resistance.
Happy trading everyone hope everyone had a great week.

Yen-Carry Trade isn't overWhat we witnessed last summer was just the start. Equities will take a hit as a result.

Could the price drop from here?USD/JPY is rising towards the resistance level which is a pullback resistance that aligns with the 50% Fibonacci retracement and could drop from this level to our take profit.
Entry: 145.36
Why we like it:
There is a pullback resistance that lines up with the 50% Fibonacci retracement.
Stop loss: 146.21
Why we like it:
There is a pullback resistance level that is slight above the 61.8% Fibonacci retracement.
Take profit: 144.16
Why we like it:
There is a pullback support level.
Enjoying your TradingView experience? Review us!
Please be advised that the information presented on TradingView is provided to Vantage (‘Vantage Global Limited’, ‘we’) by a third-party provider (‘Everest Fortune Group’). Please be reminded that you are solely responsible for the trading decisions on your account. There is a very high degree of risk involved in trading. Any information and/or content is intended entirely for research, educational and informational purposes only and does not constitute investment or consultation advice or investment strategy. The information is not tailored to the investment needs of any specific person and therefore does not involve a consideration of any of the investment objectives, financial situation or needs of any viewer that may receive it. Kindly also note that past performance is not a reliable indicator of future results. Actual results may differ materially from those anticipated in forward-looking or past performance statements. We assume no liability as to the accuracy or completeness of any of the information and/or content provided herein and the Company cannot be held responsible for any omission, mistake nor for any loss or damage including without limitation to any loss of profit which may arise from reliance on any information supplied by Everest Fortune Group.

USDJPY GOING SHORT🔥 Sellers in control after breaking structure.
🎯 TP: Demand Zone below
🛑 SL: Just above Supply
🔴 Looking to sell the premium and ride the drop!

USDJPYUSD: Bearish
JPY: Strong Bullish
USD/JPY Bias: Bearish
(Market expects the yen to strengthen and the dollar to weaken — meaning USD/JPY may fall)
Speculators are heavily betting against the U.S. Dollar and in favor of the Japanese Yen, signaling strong downside bias for USD/JPY.

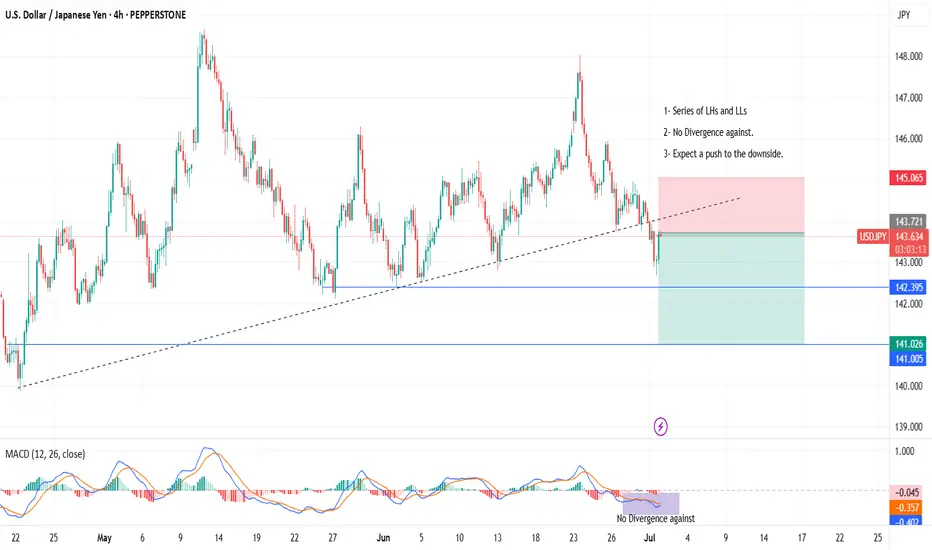
01-07-2025 _ Short Term Bearish Idea _ USDJPY H41- Series of LHs and LLs
2- No Divergence against.
3- Expect a push to the downside.
Forecast USDJPY Disclaimer:
This is not financial advice, and I do not encourage anyone to follow my analysis blindly. I’m simply sharing my personal market view based on my strategy, experience, and interpretation of the data.
Everyone is responsible for their own decisions.
The USD/JPY market has likely just exited
its accumulation phase after several weeks of quiet consolidation. What we’re seeing now is a clear buy-side manipulation orchestrated by major players. Despite weak fundamentals for the dollar — disappointing NFP, rising unemployment, and a slowdown in services — price exploded to the upside, trapping early sellers and drawing in retail buyers through a false breakout.
Technically, the market is overbought on H1 and H4, with a hidden bearish divergence extending all the way from the historical highs of 1971, combined with a confirmed bearish reversal divergence on the weekly chart. On top of that, institutional speculators (COT data) are heavily short USD/JPY, reinforcing the idea that this rally is not genuine but engineered for liquidity grabs.
I’m not rushing in. I’m waiting for 146.00, a key psychological and structural level where this manipulation could reach its peak. That zone would likely mark the end of the fake bullish move and the beginning of a real distribution phase. All signals — technical, macro, and behavioral — are aligned. This could be one of the best short opportunities on USD/JPY in months.

Sell USDJPYFor the first time, I have done some fundamental analysis. Last time NFP release was on a Thursday due to Bank Holiday was July 2020 where the USD gained on the news release but later gave up the gains. I am expecting a pullback

USD/JPY and what’s expected from the NFP?The USD/JPY hasn't dropped like the other dollar crossed yet, but could we potentially see a clean break down below 142.50 support? Well, we will need to see a big miss on the NFP print for that to potentially happen.
The consensus is for a 110K increase in non-farm payrolls, but recent data has been less than convincing. The ADP private payrolls figure released yesterday registered its first decline in over a year, stoking concerns that today’s number might fall short of expectations — potentially even slipping below 100K.
On the unemployment front, a slight uptick to 4.3% is anticipated, up from 4.2%, while Average Hourly Earnings are seen rising 0.3% month-on-month vs. 0.4% increase the month before.
By Fawad Razaqzada, market analyst with FOREX.com
