USDJPY Breakout Watch | Bullish Momentum Toward Key ResistanceUSD/JPY is showing strong bullish momentum on the 15-minute chart, breaking out of a consolidation range with increased volume.
Technical Highlights:
Price has surged with strong bullish candles, showing clean impulsive movement.
The key level at 144.39 is being tested as potential breakout resistance.
If price sustains above this zone, it may target the next resistance area near 145.35.
Clean price structure with volume supporting upward movement.
Risk is managed with a stop below the breakout level, targeting a favorable risk-to-reward ratio.
This setup reflects trend continuation with bullish momentum and clear technical structure.
📈 Watching closely for confirmation and follow-through above key breakout zone.
JPYUSD trade ideas

USDJPY LONG /// 1:1 RRHello. Im bullish on USDJPY. RR is 1:! for this trade. It should play in a day or few days. GL

USDJPD - SHORTMy bias is a short on USDJPY with a RR 1:10
awaiting for NewYork session for the main push downward
Maybe i am wrong... lol let's see haha!

Based on the lessons learned from our previous tradeReduced position sizing (maximum 1% risk)
Clear invalidation criteria (price closing above 145.500 on 4H)

Gross Analysis on USDJPYYou can follow us for more Analysis(Images and Videos) with Precise definition of the Financial Market.ENJOY!!!

Downtrend Awaiting ConfirmationUSDJPY has just made a technical rebound from the support zone at 142.22 up to the resistance area around 144.60 — a confluence with both the EMA 34 and EMA 89. However, based on the chart, this zone has previously acted as a reversal point, and price is now retesting that same level of rejection.
The current price action suggests a high likelihood of a small double-top pattern forming around 144.60. If selling pressure re-emerges here, the market could reverse and head back down toward 142.22, aligning with the developing downtrend.
Moody’s recent warning on U.S. credit rating has placed pressure on the USD, while the JPY continues to hold its safe-haven appeal amid market uncertainty.

Yen Reaches Highest Level in a MonthThe Japanese yen strengthened toward 142 per dollar on Tuesday, its highest in four weeks, driven by safe-haven inflows and weak dollar sentiment tied to Trump’s fiscal plan. Worries over a widening U.S. deficit weighed on the greenback, while speculation of a 25% iPhone tariff added to trade conflicts. Domestically, expectations for more BoJ tightening rose after core inflation surprised at 3.5%, a two-year high.
Resistance stands at 148.60, with further levels at 149.80 and 151.20. Support is found at 139.70, then 137.00 and 135.00.
Analysing the Volatility Spike on the USD/JPY ChartAnalysing the Volatility Spike on the USD/JPY Chart
The USD/JPY chart offers plenty of noteworthy insights for analysis:
→ A one-month low was recorded today (marked by the arrow);
→ This was followed by a sharp upward reversal, with a series of large bullish candlesticks forming on the intraday chart.
Why Is USD/JPY Moving Sharply Today?
The primary driver appears to be recent statements from Bank of Japan Governor Kazuo Ueda.
According to Trading Economics, this morning Ueda:
→ warned of rising core inflation risks linked to increasing food prices;
→ indicated that the Bank of Japan is prepared to adjust its monetary policy in order to achieve a stable inflation target.
Latest data show that Japan’s core inflation unexpectedly rose to 3.5% — the highest level in two years — reinforcing the case for further rate hikes. However, what's particularly striking is that despite Ueda’s hawkish tone, the yen is weakening.
Technical Analysis of the USD/JPY Chart
Yen fluctuations formed a downward trajectory (marked in orange) in the second half of May, partly driven by US dollar weakness. Following a period of relative calm, the market has shifted into high gear — the ATR indicator is climbing sharply from multi-month lows, breaking through resistance at the 143.0 level.
This aggressive price action on the USD/JPY chart today suggests we may be witnessing an attempted bullish breakout from the channel. In light of this, it is possible that the surge in volatility reflects a fundamental shift in market sentiment — one that could potentially lead to the development of an upward trend.
This article represents the opinion of the Companies operating under the FXOpen brand only. It is not to be construed as an offer, solicitation, or recommendation with respect to products and services provided by the Companies operating under the FXOpen brand, nor is it to be considered financial advice.

MarketBreakdown | USDJPY, US100, BITCOIN, GBPJPY
Here are the updates & outlook for multiple instruments in my watch list.
1️⃣ #USDJPY 4H time frame 🇺🇸🇯🇵
I see a strong bullish reaction to a key daily/intraday horizontal support.
A formation of a high momentum bullish candle and a violation of a resistance line
of a bullish flag indicate a highly probable rise to higher levels.
2️⃣ #US100 #NASDAQ Index 4H time frame
I spotted one more bullish flag on US100.
Its resistance was violated yesterday and we already see
a strong buying interest.
I think that the market will rise more, at least to a current local high.
3️⃣ #BITCOIN #BTCUSD daily time frame
The price nicely respected a confluence zone based on
a rising trend line and a recently broken horizontal structure.
Probabilities will be high that the market will continue rising from that.
4️⃣ #GBPJPY daily time frame 🇬🇧🇯🇵
The price nicely respected a solid rising trend line.
I see a breakout attempt of a minor daily horizontal resistance.
IF a daily candle closes above that, it will provide a strong bullish confirmation.
Do you agree with my market breakdown?
❤️Please, support my work with like, thank you!❤️
I am part of Trade Nation's Influencer program and receive a monthly fee for using their TradingView charts in my analysis.

USDJPY Analysis – Yield Support Signals Potential UpsideUSDJPY is currently sitting at a key support zone around 142.80–143.00, showing signs of a potential bullish reversal. This support area has previously acted as a strong launchpad for price rallies.
🟢 Technical Setup:
Price action has formed a clean higher low structure, bouncing off horizontal support.
The US10Y Treasury Yield (pink line) has rebounded sharply and is diverging to the upside — a leading indicator for USDJPY strength.
The Fib retracement from the last swing move aligns well with the 0% zone, suggesting the dip might be complete.
A bullish reaction from here targets the 148.50 zone, with intermediate resistance around 145.00–146.00.
🟠 Risk Levels:
Invalidated below 141.40 (structure break).
Stops could be placed below 142.00, targeting a 2:1 or better risk-reward ratio.
🔍 Macro-Fundamental Insight:
U.S. Yields are firming despite mixed Fed signals — this gives strength to USD, especially against low-yielders like the JPY.
BOJ remains dovish with no urgency to normalize rates, keeping the yen weak.
With risk appetite improving and bond yields lifting, carry trade dynamics favor USDJPY upside.
✅ Conclusion:
As long as US10Y yields remain firm and USD holds above 142.00, USDJPY has a strong probability of rallying toward 148.50. Look for confirmation with higher highs on the 4H chart and continued divergence between yield and price.


CHECK USDJPY SIGNALS READ CAPTAIN USDJPY Buy limit zone
TRADE
Entry level 142.555
Take profit Target 144.385
Stop loss 141.900

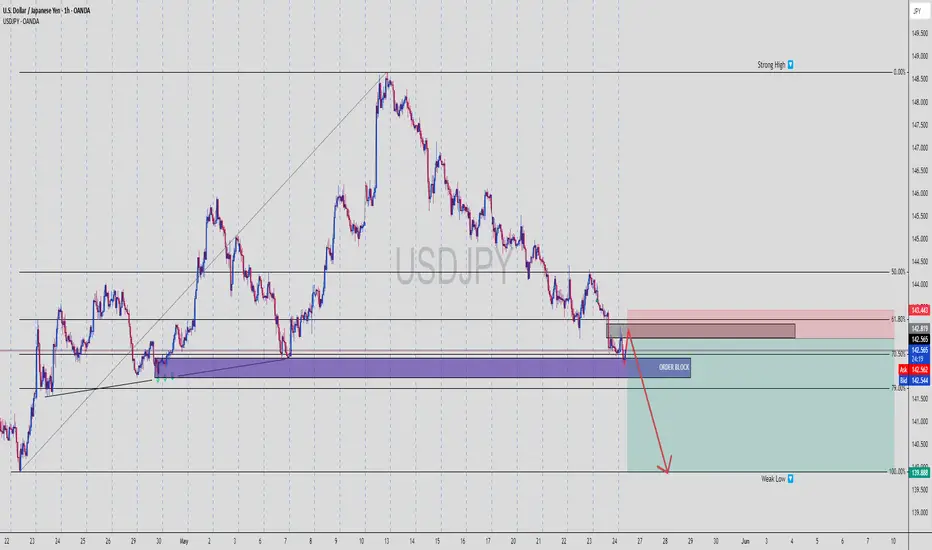
USDJPY | FVG + OB + Weak Low Target = Textbook SMC Setup📊 USDJPY | 1H Bearish Play – Smart Money In Control
We’re seeing a classic setup where price retraces into a bearish zone of confluence and prepares for a selloff toward internal liquidity. Check the breakdown:
🔻 1. Structure Shift Confirmed
Price broke structure on the downside after forming a lower high
Current move is a retracement into discount OB zone
Clear rejection is forming, signaling short momentum incoming
🟪 2. Zone Confluence
📌 Order Block (OB): Sitting just under the 61.8% Fib
📌 Fair Value Gap (FVG): Mitigated perfectly
📌 Fib Retracement: Price reacts between 61.8% and 70.5% — classic Smart Money play
📌 Previous Demand Turned Supply: This level is now acting as a rejection zone
This is stacked confluence — just how Smart Money likes to move.
💣 3. Entry Strategy
Entry Zone: 142.55 (midpoint of the OB reaction area)
Stop Loss: Above 143.443 (above OB + liquidity wick)
Take Profit: 139.888 (weak low, previous liquidity resting point)
⚖️ 4. Risk-to-Reward Ratio (RRR)
🎯 TP = 139.888
📍 Entry = 142.550
🔐 SL = 143.443
✅ RRR ≈ 1:3.5
A great example of high-probability short setup using pure Smart Money logic.
📉 5. Why This Works
Retail traders will try to long at this zone hoping for a breakout
Smart Money uses this zone to engineer liquidity
They tap into the FVG/OB, then target internal liquidity and weak lows
Clean, controlled sell-off expected down to 139.888
🧠 SMC Insights
This chart is all about liquidity engineering:
Push up into OB
Reject at premium pricing
Drive down to weak low to collect stops
Possibly reverse or continue trend from there
💬 Comment “FVG TAP + OB = 🔥” if you spotted this setup early
💾 Save it before the drop happens
📤 Share with a fellow SMC trader who needs this breakdown
Usdjpy I posted this signal yesterday and this is the outcome usdjpy have been pretty nice this few times

Fundamental Market Analysis for May 27, 2025 USDJPYThe Japanese yen (JPY) is attracting fresh buyers in Tuesday's Asian session following the release of strong inflation data. Additionally, comments from Bank of Japan Governor Kazuo Ueda left the door open for further policy tightening by the central bank. This is in sharp contrast to expectations that the Federal Reserve (Fed) will continue to cut interest rates this year, and is proving to be a key factor that is providing a nice lift for the yen.
In addition, persistent geopolitical risks related to the protracted war between Russia and Ukraine and conflicts in the Middle East are contributing to the yen's safe haven status. The US dollar (USD), on the other hand, remains near its lowest level since April 22 amid concerns over the deteriorating US fiscal situation. This contributes to the USD/JPY pair's fall to 142.000, or more than a one-month low, and supports the prospects for further losses.
Trading recommendation: SELL 143.300, SL 143.900, TP 142.000

USDJPY The volatility we are seeing in the long-term bond market will spill over into the USDJPY ratio.

USDJPY – Ride the Rail Short IdeaPair is still gliding inside a clean 30-min downslope channel.
Price is now retesting the upper rail (≈ 143.00).
fade this retest while the trend-line holds.
Entry zone: 142.90 – 143.00
Target: 142.10 (bottom rail / prior pivot)
If the rail snaps, no trade; if it holds, I’m looking for the next slide to 142.1.

USDJPY COT and Liquidity AnalysisHey what up traders welcome to the COT data and Liquidity report. It's always good to go with those who move the market here is what I see in their cards. I share my COT - order flow views every weekend.
🎯 Non Commercials added 6K longs nad just 300 shorts, I still see a price coming higher but, first liquidity is lower so it makes more sense to close shorts on lower prices and overall still the exposure seems more bearish.
📍Please be aware that institutions report data to the SEC on Tuesdays and data are reported on Fridays - so again we as retail traders have disadvantage, but there is possibility to read between the lines. Remember in the report is what they want you to see, that's why mostly price reverse on Wednesday after the report so their cards are hidden as long as possible. However if the trend is running you can read it and use for your advantage.
💊 Tip
if the level has confluence with the high volume on COT it can be strong support / Resistance.
👍 Hit like if you find this analysis helpful, and don't hesitate to comment with your opinions, charts or any questions.
Analysis done on the Tradenation Charts
Disclosure: I am part of Trade Nation's Influencer program and receive a monthly fee for using their TradingView charts in my analysis.
"Adapt what is useful, reject what is useless, and add what is specifically your own."
— David Perk aka Dave FX Hunter ⚔️

USDJPY I Daily CLS Nested In Weekly CLS, Model 1Hey, Market Warriors, here is another outlook on this instrument
If you’ve been following me, you already know every setup you see is built around a CLS range, a Key Level, Liquidity and a specific execution model.
If you haven't followed me yet, start now.
My trading system is completely mechanical — designed to remove emotions, opinions, and impulsive decisions. No messy diagonal lines. No random drawings. Just clarity, structure, and execution.
🧩 What is CLS?
CLS is real smart money — the combined power of major investment banks and central banks moving over 6.5 trillion dollars a day. Understanding their operations is key to markets.
✅ Understanding the behaviour of CLS allows you to position yourself with the giants during the market manipulations — leading to buying lows and selling highs - cleaner entries, clearer exits, and consistent profits.
🛡️ Models 1 and 2:
From my posts, you can learn two core execution models.
They are the backbone of how I trade and how my students are trained.
📍 Model 1
is right after the manipulation of the CLS candle when CIOD occurs, and we are targeting 50% of the CLS range. H4 CLS ranges supported by HTF go straight to the opposing range.
📍 Model 2
occurs in the specific market sequence when CLS smart money needs to re-accumulate more positions, and we are looking to find a key level around 61.8 fib retracement and target the opposing side of the range.
👍 Hit like if you find this analysis helpful, and don't hesitate to comment with your opinions, charts or any questions.
⚔️ Listen Carefully:
Analysis is not trading. Right now, this platform is full of gurus" trying to sell you dreams based on analysis with arrows while they don't even have the skill to trade themselves.
If you’re ever thinking about buying a Trading Course or Signals from anyone. Always demand a verified track record. It takes less than five minutes to connect 3rd third-party verification tool and link to the widget to his signature.
"Adapt what is useful, reject what is useless, and add what is specifically your own."
— David Perk aka Dave FX Hunter ⚔️

USDJPY H1 I Bullish Rise Based on the H1 chart analysis, we can see that the price has just bounced off our buy entry at 142.31. a swing low support.
Our take profit is set at 142.71, a pullback resistance.
The stop loss is placed at 141.65, below the 161.8% Fibo extension.
High Risk Investment Warning
Trading Forex/CFDs on margin carries a high level of risk and may not be suitable for all investors. Leverage can work against you.
Stratos Markets Limited (tradu.com ):
CFDs are complex instruments and come with a high risk of losing money rapidly due to leverage. 63% of retail investor accounts lose money when trading CFDs with this provider. You should consider whether you understand how CFDs work and whether you can afford to take the high risk of losing your money.
Stratos Europe Ltd (tradu.com ):
CFDs are complex instruments and come with a high risk of losing money rapidly due to leverage. 63% of retail investor accounts lose money when trading CFDs with this provider. You should consider whether you understand how CFDs work and whether you can afford to take the high risk of losing your money.
Stratos Global LLC (tradu.com ):
Losses can exceed deposits.
Please be advised that the information presented on TradingView is provided to Tradu (‘Company’, ‘we’) by a third-party provider (‘TFA Global Pte Ltd’). Please be reminded that you are solely responsible for the trading decisions on your account. There is a very high degree of risk involved in trading. Any information and/or content is intended entirely for research, educational and informational purposes only and does not constitute investment or consultation advice or investment strategy. The information is not tailored to the investment needs of any specific person and therefore does not involve a consideration of any of the investment objectives, financial situation or needs of any viewer that may receive it. Kindly also note that past performance is not a reliable indicator of future results. Actual results may differ materially from those anticipated in forward-looking or past performance statements. We assume no liability as to the accuracy or completeness of any of the information and/or content provided herein and the Company cannot be held responsible for any omission, mistake nor for any loss or damage including without limitation to any loss of profit which may arise from reliance on any information supplied by TFA Global Pte Ltd.
The speaker(s) is neither an employee, agent nor representative of Tradu and is therefore acting independently. The opinions given are their own, constitute general market commentary, and do not constitute the opinion or advice of Tradu or any form of personal or investment advice. Tradu neither endorses nor guarantees offerings of third-party speakers, nor is Tradu responsible for the content, veracity or opinions of third-party speakers, presenters or participants.

USDJPY InsightWelcome, dear subscribers!
Please share your personal opinions in the comments. Don’t forget to like and subscribe.
Key Points
- U.S. President Trump announced a delay of the 50% tariff, which he had warned would take effect from June 1, until July 9.
- Nvidia’s earnings will be released after the market closes on the 28th, drawing attention as a potential catalyst for increased risk appetite.
- At the opening of the two-day conference themed “New Challenges in Monetary Policy” on the 27th, BOJ Governor Ueda stated that "Japan’s inflation is closer to the target than at any time in the past 30 years," and added, "As economic activity and prices improve, we will adjust the level of monetary easing as necessary to achieve the sustainable 2% inflation target, within the range that reinforces confidence in our baseline scenario based on incoming data."
Key Economic Events This Week
+ May 28: FOMC Meeting Minutes
+ May 29: U.S. Q1 GDP
+ May 30: U.S. April PCE Price Index
USDJPY Chart Analysis
While it initially seemed like a short-term uptrend was forming with 149 as the peak, the pair broke below the 144 level, failing to establish the uptrend. The breakdown below the support line suggests a possible decline toward the 140 level. After reaching the low, we will need to monitor the situation, but a rebound is expected at this point.
If the 140 level is breached, we will quickly develop a new strategy.

0527: Bearish USD/JPY: BoJ Rate Hike Expectations Hello traders,
In the futures market, I once again came across a more "interesting" piece of data. The COT position data showed that the speculative long positions in the Japanese yen soared to 167,330 contracts, reaching an extreme level not seen in recent years.
★ I would like to present another set of data:
✔ In April, the price of rice in Japan soared by 98.4% year-on-year, marking the largest monthly increase since 1971. This increase was even higher than the 92.1% in March.
✔ The Japanese government cancelled subsidies for gas and electricity in March, causing energy prices to rise by 9.3%.
✔ Japan's core CPI excluding fresh food rose by 3.5% year-on-year, higher than 3.2% in March. This is the fifth consecutive month of core inflation above 3%.
✔ Meanwhile, the Japanese economy contracted by 0.7% in the first quarter of 2025, marking the first negative growth since the first quarter of 2024.
✔ Within 45 days, the yield on Japan's 30-year government bonds soared by 100 basis points, reaching a record high of 3.20%. Over 500 billion US dollars of 40-year Japanese government bonds, regarded as "safe assets", have depreciated by more than 20% in the past 6 weeks.
Technically, weekly chart, UJ has make a bearish reversed bowl top and now this pair is targeting south running beneath WEEKLY EMAs.
The support zone that be test triple would become resistance zone very soon.
The weekly selling targets are marked out on this chart!
Based on the latest market trends and the policy signals from the Bank of Japan, there is a high probability that the Bank of Japan will raise interest rates at its next meeting (expected to be in June 2025). It is now the time to buy the expectation and sell the reality.
GOOD LUCK!
LESS IS MORE!

USDJPY BUYTargets @ 144.57 TP1 - 2.1bn @ 145 TP2 - Entries at Structure Breaks or 141 Area combined with Volume - FOMC provide Direction
