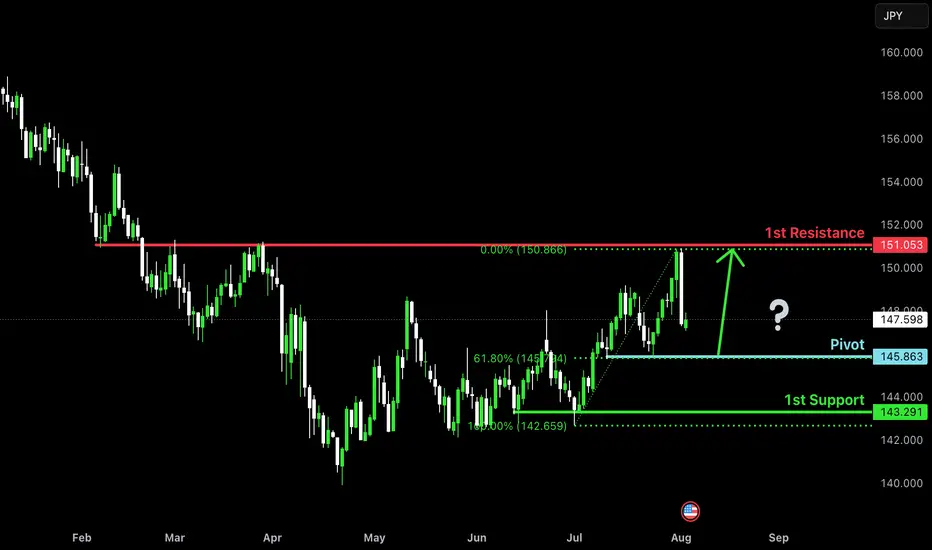
Bullish bounce off pullback support?USD/JPY is falling towards the pivot, which is a pullback support and could bounce to the 1st resistance.
Pivot: 145.86
1st Support: 143.29
1st Resistance: 151.05
Risk Warning:
Trading Forex and CFDs carries a high level of risk to your capital and you should only trade with money you can afford to lose. Trading Forex and CFDs may not be suitable for all investors, so please ensure that you fully understand the risks involved and seek independent advice if necessary.
Disclaimer:
The above opinions given constitute general market commentary, and do not constitute the opinion or advice of IC Markets or any form of personal or investment advice.
Any opinions, news, research, analyses, prices, other information, or links to third-party sites contained on this website are provided on an "as-is" basis, are intended only to be informative, is not an advice nor a recommendation, nor research, or a record of our trading prices, or an offer of, or solicitation for a transaction in any financial instrument and thus should not be treated as such. The information provided does not involve any specific investment objectives, financial situation and needs of any specific person who may receive it. Please be aware, that past performance is not a reliable indicator of future performance and/or results. Past Performance or Forward-looking scenarios based upon the reasonable beliefs of the third-party provider are not a guarantee of future performance. Actual results may differ materially from those anticipated in forward-looking or past performance statements. IC Markets makes no representation or warranty and assumes no liability as to the accuracy or completeness of the information provided, nor any loss arising from any investment based on a recommendation, forecast or any information supplied by any third-party.
JPYUSD trade ideas
USDJPY 30Min Engaged (Buy & Sell Reversal Entry's Detected )Time Frame: 30-Minute Warfare
Entry Protocol: Only after volume-verified breakout
🩸Bullish Reversal - 148.750
🩸Bearish Reversal - 150.100
➗ Hanzo Protocol: Volume-Tiered Entry Authority
➕ Zone Activated: Dynamic market pressure detected.
The level isn’t just price — it’s a memory of where they moved size.
Volume is rising beneath the surface — not noise, but preparation.
🔥 Tactical Note:
We wait for the energy signature — when volume betrays intention.
The trap gets set. The weak follow. We execute.

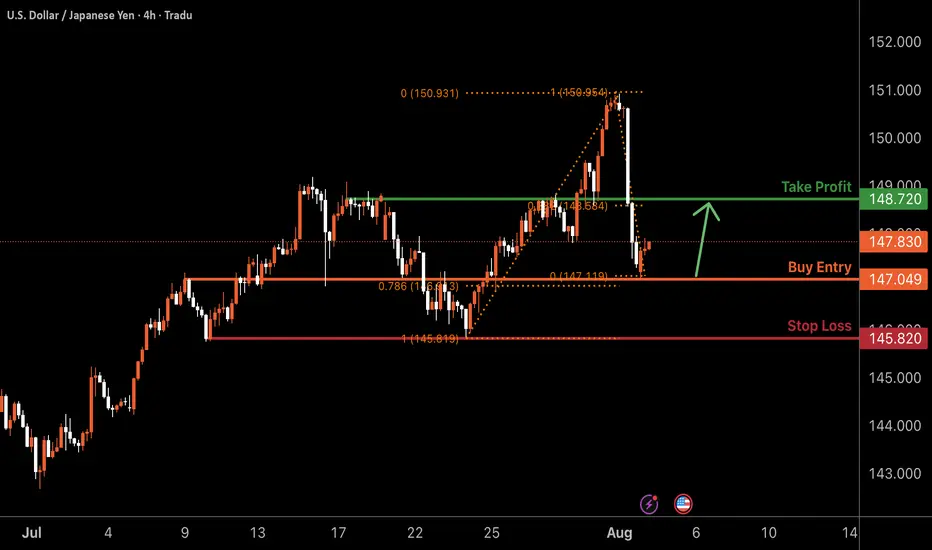
USDJPY H4 | Bullish bounce offBased on the H4 chart analysis, we can see that the price has bounced off the buy entry, which is an overlap support, and could potentially rise further.
Buy entry is at 147.04, which is an overlap support that aligns with the 78.6% Fibonacci retracement.
Stop loss is at 145.82, which is a multi-swing low support.
Take profit is at 148.72, which is a pullback resistance that lines up with the 38.2% Fibonacci retracement.
High Risk Investment Warning
Trading Forex/CFDs on margin carries a high level of risk and may not be suitable for all investors. Leverage can work against you.
Stratos Markets Limited (tradu.com ):
CFDs are complex instruments and come with a high risk of losing money rapidly due to leverage. 65% of retail investor accounts lose money when trading CFDs with this provider. You should consider whether you understand how CFDs work and whether you can afford to take the high risk of losing your money.
Stratos Europe Ltd (tradu.com ):
CFDs are complex instruments and come with a high risk of losing money rapidly due to leverage. 66% of retail investor accounts lose money when trading CFDs with this provider. You should consider whether you understand how CFDs work and whether you can afford to take the high risk of losing your money.
Stratos Global LLC (tradu.com ):
Losses can exceed deposits.
Please be advised that the information presented on TradingView is provided to Tradu (‘Company’, ‘we’) by a third-party provider (‘TFA Global Pte Ltd’). Please be reminded that you are solely responsible for the trading decisions on your account. There is a very high degree of risk involved in trading. Any information and/or content is intended entirely for research, educational and informational purposes only and does not constitute investment or consultation advice or investment strategy. The information is not tailored to the investment needs of any specific person and therefore does not involve a consideration of any of the investment objectives, financial situation or needs of any viewer that may receive it. Kindly also note that past performance is not a reliable indicator of future results. Actual results may differ materially from those anticipated in forward-looking or past performance statements. We assume no liability as to the accuracy or completeness of any of the information and/or content provided herein and the Company cannot be held responsible for any omission, mistake nor for any loss or damage including without limitation to any loss of profit which may arise from reliance on any information supplied by TFA Global Pte Ltd.
The speaker(s) is neither an employee, agent nor representative of Tradu and is therefore acting independently. The opinions given are their own, constitute general market commentary, and do not constitute the opinion or advice of Tradu or any form of personal or investment advice. Tradu neither endorses nor guarantees offerings of third-party speakers, nor is Tradu responsible for the content, veracity or opinions of third-party speakers, presenters or participants.
USDJPY BUYThe year will be politically marked by Trump’s return to the White House. A Republican government is seen as positive for financial markets, but Trump’s pledge to cut taxes and impose tariffs on foreign goods and services may introduce uncertainty to both the political and economic landscape.
In Japan, political uncertainty looms, as the ruling Liberal Democratic Party (LDP) lacks a parliamentary majority and may call fresh elections. An LDP victory could strengthen the Yen by ensuring stability, while opposition gains might lead to fiscal expansion and weaken the currency. If no elections occur, a modest budget would likely keep the Yen supported.
In terms of monetary policy, the Fed and BoJ are set to diverge in monetary policy. The Fed expects to deliver only two additional rate cuts in 2025, the BoJ is expected to maintain its dovish stance, avoiding rate hikes amid weak inflation and a shrinking economy, leaving the Yen vulnerable to market disappointment over policy inaction
SUPPORT 149.232
SUPPORT 148.598
SUPPORT 147.963
RESISTANCE 147.285
RESISTANCE 146.913

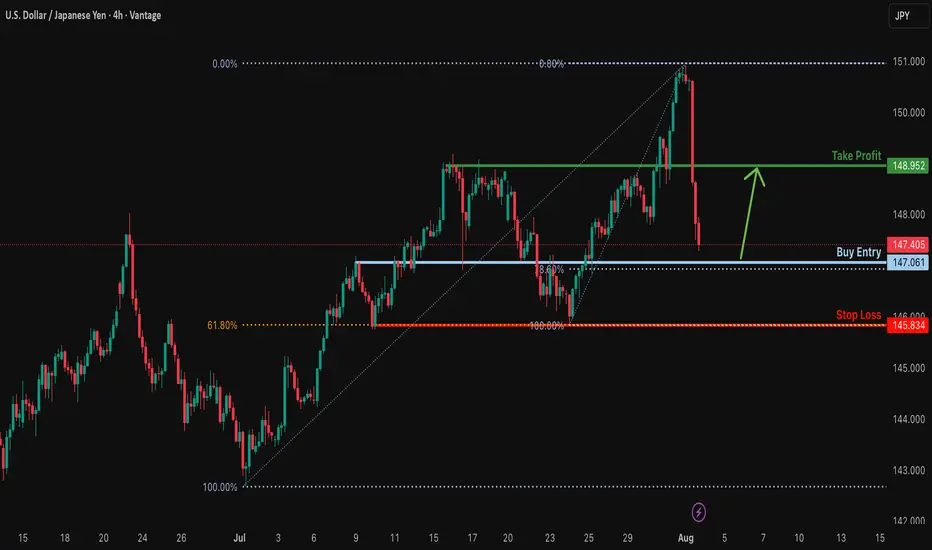
Falling towards 78.6% Fibonacci support?USD/JPY is falling towards the support level, which is an overlap support that aligns with the 78.6% Fibonacci retracement and could bounce from this level to our take profit.
Entry: 147.06
Why we like it:
There is an overlap support that aligns with the 78.6% Fibonacci retracement.
Stop loss: 145.83
Why we like it:
There is a multi-swing low support that aligns with the 61.8% Fibonacci retracement.
Take profit: 148.95
Why we like it:
There is a pullback resistance.
Enjoying your TradingView experience? Review us!
Please be advised that the information presented on TradingView is provided to Vantage (‘Vantage Global Limited’, ‘we’) by a third-party provider (‘Everest Fortune Group’). Please be reminded that you are solely responsible for the trading decisions on your account. There is a very high degree of risk involved in trading. Any information and/or content is intended entirely for research, educational and informational purposes only and does not constitute investment or consultation advice or investment strategy. The information is not tailored to the investment needs of any specific person and therefore does not involve a consideration of any of the investment objectives, financial situation or needs of any viewer that may receive it. Kindly also note that past performance is not a reliable indicator of future results. Actual results may differ materially from those anticipated in forward-looking or past performance statements. We assume no liability as to the accuracy or completeness of any of the information and/or content provided herein and the Company cannot be held responsible for any omission, mistake nor for any loss or damage including without limitation to any loss of profit which may arise from reliance on any information supplied by Everest Fortune Group.
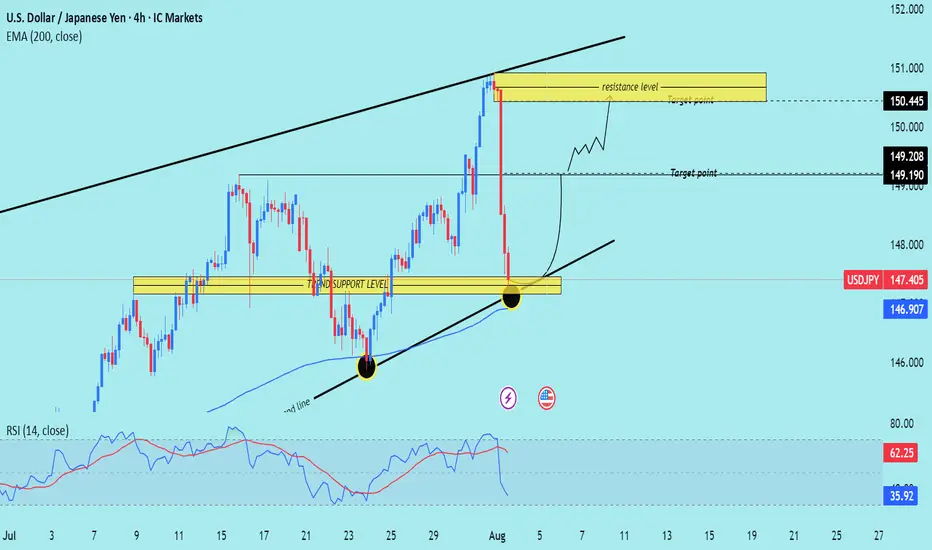
USD/JPY) Bullish trend analysis Read The captionSMC Trading point update
Technical analysis of USD/JPY on the 4-hour timeframe, using a combination of trendline support, key horizontal levels, and EMA 200 confluence to identify a potential bounce.
---
Technical Breakdown:
1. Market Structure:
USD/JPY experienced a sharp decline from the resistance zone near 150.445, but price is now testing a strong confluence support area:
Horizontal support zone
Rising trendline
200 EMA (146.907)
2. Support Confluence Zone:
Marked as "trend support level", this zone has historically acted as a springboard for bullish moves.
Recent price action shows a wick rejection at this zone, indicating buying pressure.
3. Resistance/Target Zones:
Target 1: 149.190 – 149.208
Target 2: 150.445 (major resistance zone)
4. EMA 200:
Price is reacting just above the 200 EMA, strengthening the bullish case for a bounce.
5. RSI (14):
RSI has dipped to 35.92, near oversold territory, suggesting the downside may be exhausted.
Prior bounce from similar RSI levels led to strong upward moves.
6. Projected Path:
The chart outlines a potential bullish recovery, targeting a climb back into the upper channel and retesting previous highs.
Mr SMC Trading point
---
Trade Idea Summary:
Bias: Bullish (Reversal from trendline + support zone)
Entry Zone: Current level near 147.40–146.90 (support confluence)
Targets:
TP1: 149.190
TP2: 150.445
Invalidation: Daily close below trendline and 200 EMA (~146.70 or lower)
Indicators: RSI supports a bounce; EMA and trendline confirm structure
Please support boost 🚀 this analysis)
CARRY TRADE RISK IT IS SHOWING CRACKSThe chart posted in my work on TSXV:USS yen I have NOT CHANGED THE WAVE STRUCTURE AT ALL take notice of my statement CRASH COMING

Second Part ANALYSIS
Part 2: USD/JPY Chart Analysis
It seems that, due to the upcoming NFP news (which will be released shortly), the price is in a state of uncertainty. If the downtrend or price correction continues, this is one possible scenario we could see. However, it might also be better to stay risk-free or even close the trade here.
USD/JPY - IMPORTANT UPDATEDear Friends in Trading,
How I see it,
KEYNOTE:
As long as price remains below the "PIVOT AREA" the pair will remain "BEARISH".
Pivot area range: 147.950 - 148.150
Be careful to buy, there is institutional fundamentals at play here during this time.
I sincerely hope my point of view offers a valued insight
Thank you for taking the time study my analysis.

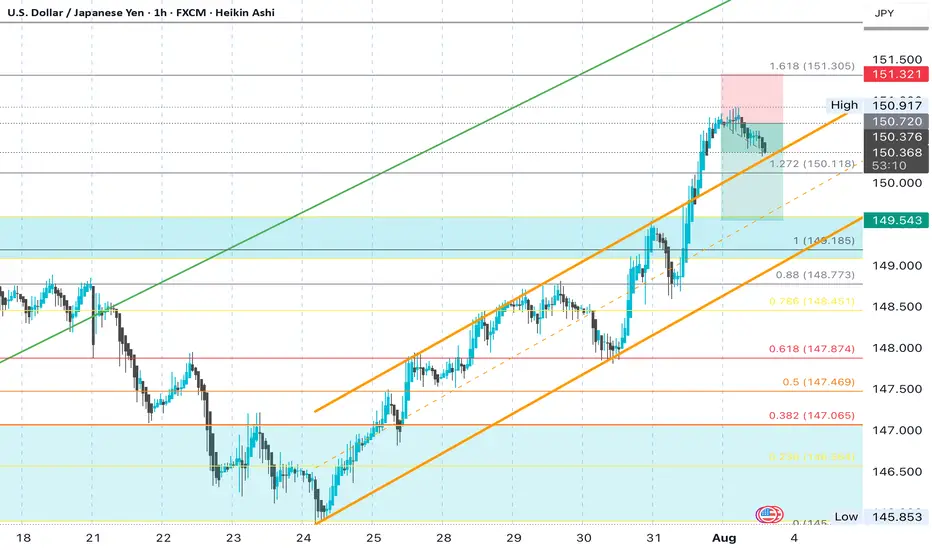
Bearish reversal off overlap resistance?USD/JPY is rising towards the pivot, which has been identified as an overlap resistance and could drop to the 1st support.
Pivot: 151.17
1st Support: 149.03
1st Resistance: 154.51
Risk Warning:
Trading Forex and CFDs carries a high level of risk to your capital and you should only trade with money you can afford to lose. Trading Forex and CFDs may not be suitable for all investors, so please ensure that you fully understand the risks involved and seek independent advice if necessary.
Disclaimer:
The above opinions given constitute general market commentary, and do not constitute the opinion or advice of IC Markets or any form of personal or investment advice.
Any opinions, news, research, analyses, prices, other information, or links to third-party sites contained on this website are provided on an "as-is" basis, are intended only to be informative, is not an advice nor a recommendation, nor research, or a record of our trading prices, or an offer of, or solicitation for a transaction in any financial instrument and thus should not be treated as such. The information provided does not involve any specific investment objectives, financial situation and needs of any specific person who may receive it. Please be aware, that past performance is not a reliable indicator of future performance and/or results. Past Performance or Forward-looking scenarios based upon the reasonable beliefs of the third-party provider are not a guarantee of future performance. Actual results may differ materially from those anticipated in forward-looking or past performance statements. IC Markets makes no representation or warranty and assumes no liability as to the accuracy or completeness of the information provided, nor any loss arising from any investment based on a recommendation, forecast or any information supplied by any third-party.
First possible for SELL After a long buy price need a correction movement and it can be a sell order

USDJPY - NEW BREAKOUT !Hello Traders !
The USDJPY broke the resistance level (148.831 - 149.185).
This key level becomes new support!
So, I expect a bullish move🚀
_______________
TARGET: 150.605🎯

Buy position🔵 **147.000** | Respected beautifully – formed a clear bullish base.
✅ This is a **valid bullish break** of the 147.500–147.600 resistance block.
✅ Candle body is **strong**, suggesting momentum.

USD/JPY 4H –analysis Buy setupUSD/JPY (U.S. Dollar / Japanese Yen)
Timeframe: 4-Hour (4H)
Trend: Bullish Trendline Support – Price is respecting a strong ascending trendline.
Indicators: Ichimoku Cloud is visible; current price is above the cloud = bullish bias.
Current Price: Around 147.95.
---
✅ Buy Entry:
Entry Zone: Between 147.90 – 148.10
(As price is bouncing from the trendline support and Ichimoku cloud.)
🎯 Buy Targets:
1. Target 1: 148.99 (Previous structure resistance)
2. Target 2: 150.50 (Next resistance level)
3. Target 3 (Swing): 152.00+ (If momentum continues)
🛑 Stop Loss:
Below trendline + Ichimoku support = 146.80 (safe zone)
---
🔖 Chart Title Suggestion:
"USD/JPY 4H – Trendline Rebound with Bullish Momentum Targeting 150+"

USDJPY-BUY strategy 3 hourly chart Reg.ChannelThe pair is slightly oversold and in fact trailing below the channel. Downward pressure is still valid for now, so we would seek to BUY somewhere lower 146.50 area.
Strategy BUY @ 146.58 area and take profit near 148.37 for now.,

PRICE BALANCINGAfter that long take of JPY, seller had the bias.
USD is balancing the price in the market as to give the buyer bias over seller making the overall trend bullish where every high is been liquidised.🚀🚀📉📉📈📈

USDJPY InsightWelcome, subscribers!
Please share your personal opinions in the comments. Don’t forget to like and subscribe!
Key Points
- U.S. President Donald Trump announced a plan to impose a high tariff of 39% on Switzerland. In response, the Swiss side expressed willingness to revise the existing negotiation terms.
- Following the employment shock in the U.S., a rate cut by the Fed in September is now considered a given. Market expectations have shifted from 1–2 rate cuts this year to potentially 3. Investors are interpreting the Fed’s move as a precautionary cut to prevent economic cooling.
- On July 31, the Bank of Japan (BOJ) held rates steady. Although Governor Kazuo Ueda’s press conference was seen as showing caution toward future rate hikes, many economists expect a rate hike in October due to the BOJ raising its inflation outlook more than anticipated and adjusting its risk balance to neutral.
Key Economic Events This Week
+ August 7: Bank of England (BOE) interest rate decision
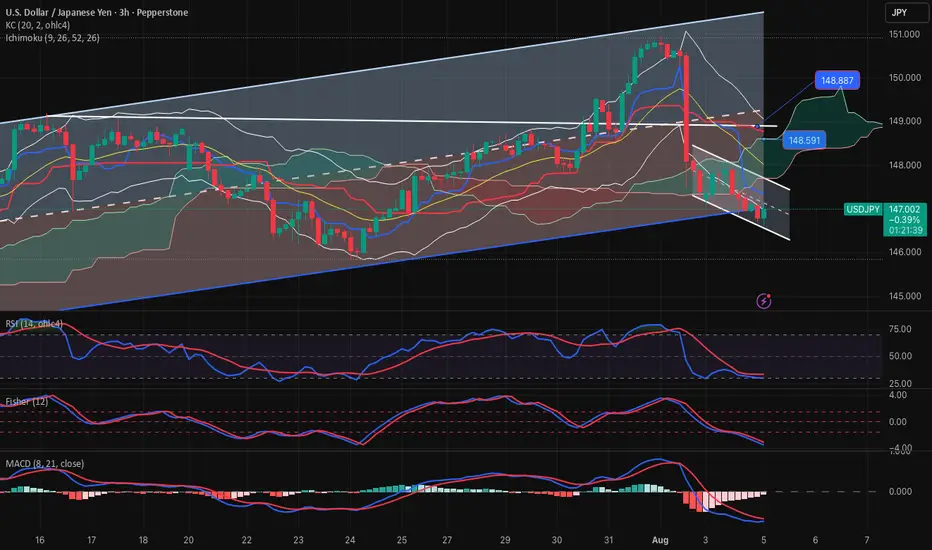
USDJPY Chart Analysis
After falling to the 146 level, the USD/JPY rose to 151, showing a movement in line with expectations. After reaching 151, the price encountered resistance and experienced a pullback. Currently, it is forming around the 147 level.
If it finds support here and rebounds, a breakout above the 151 level is likely. However, if it breaks down through the 147–146 zone, there is a possibility of a retreat to the 144 level.

USDJPY 30Min Engaged (Buy & Sell Reversal Entry's Detected )Time Frame: 30-Minute Warfare
Entry Protocol: Only after volume-verified breakout
🩸Bullish Reversal - 148.350
🩸Bearish Reversal - 148.370
➗ Hanzo Protocol: Volume-Tiered Entry Authority
➕ Zone Activated: Dynamic market pressure detected.
The level isn’t just price — it’s a memory of where they moved size.
Volume is rising beneath the surface — not noise, but preparation.
🔥 Tactical Note:
We wait for the energy signature — when volume betrays intention.
The trap gets set. The weak follow. We execute.

USD/JPY on the 1D timeframeBased on the chart I provided for USD/JPY on the 1D timeframe, here is the target analysis:
📉 Downtrend Analysis:
The chart is showing a descending channel, indicating a bearish trend.
Price has been respecting the upper and lower bounds of the channel.
Two target zones are marked with labels “TakeProfit”, suggesting projected bearish targets.
🎯 Identified Targets:
1. First Target Zone (TakeProfit):
📍 Around 152.00
This is the first expected support area where price may bounce or consolidate.
2. Second Target Zone (TakeProfit):
📍 Around 146.50 – 146.00
This level aligns with historical support and volume profile concentration.

USDJPY Potential UpsidesHey Traders, in tomorrow's trading session we are monitoring USDJPY for a buying opportunity around 147.000 zone, USDJPY is trading in an uptrend and currently is in a correction phase in which it is approaching the trend at 147.000 support and resistance area.
Trade safe, Joe.

Buy usdjpyOur last buying idea already running 500+ pips in buying
Now more buy expected after a lil more retracment

