USDJPY - Long 152.90USDJPY Expected to longer. The pair will see 152.90 levels. The Pair is expected to retrace to the levels of 145.24 before flying high.
JPYUSD trade ideas

USDJPY (daily + Monthly analysis)hi everyone happy trading as always hope this video finds you some value.

USDJPY Is Very Bearish! Sell!
Here is our detailed technical review for USDJPY.
Time Frame: 9h
Current Trend: Bearish
Sentiment: Overbought (based on 7-period RSI)
Forecast: Bearish
The market is on a crucial zone of supply 150.492.
The above-mentioned technicals clearly indicate the dominance of sellers on the market. I recommend shorting the instrument, aiming at 148.583 level.
P.S
We determine oversold/overbought condition with RSI indicator.
When it drops below 30 - the market is considered to be oversold.
When it bounces above 70 - the market is considered to be overbought.
Disclosure: I am part of Trade Nation's Influencer program and receive a monthly fee for using their TradingView charts in my analysis.
Like and subscribe and comment my ideas if you enjoy them!

First Monthly Analysis – USDJPYThe USDJPY pair ends the month of July with a strong bullish impulse reaching 150.6, a price area that may signal the exhaustion of the uptrend that has dominated throughout the month.
An ongoing ABC harmonic structure is taking shape, with wave A likely completing between 151.36 and 152.00, which aligns with the 0.618 CD retracement — a confluence that reinforces the zone as a key resistance area.
From there, a potential bearish correction (wave B) may develop, targeting the 145.89 region. If this structure plays out correctly, a final bullish expansion (wave C) could aim for the 157.05 area.
Key Zones for the Week:
Projected exhaustion zone (wave A): 151.36 – 152.00
Expected pullback (wave B): 145.89
Final bullish target (wave C): 157.05
⚠️ Disclaimer
The correction of July’s bullish trend may begin before reaching the expected zone (151.36–152.00) due to liquidity buildup beneath current levels. A premature reversal is possible if institutional players decide to hunt that liquidity before continuing the larger move.
💬 “Sometimes it’s not about if it will get there, but when they let you in. If the party’s heating up above, check if they’re locking the door from below.”
Order Setup (Speculative Idea)
Sell Limit Order
Entry (Open): 151.362
Stop Loss (SL): 152.403
Take Profit (TP): 146.210
Risk–Reward Ratio : 4.79
Use this as a reference setup. Always manage your risk and adapt based on evolving price action

USDJPY My Opinion! BUY!
My dear friends,
My technical analysis for USDJPY is below:
The market is trading on 147.23 pivot level.
Bias - Bullish
Technical Indicators: Both Super Trend & Pivot HL indicate a highly probable Bullish continuation.
Target - 148.77
About Used Indicators:
A pivot point is a technical analysis indicator, or calculations, used to determine the overall trend of the market over different time frames.
Disclosure: I am part of Trade Nation's Influencer program and receive a monthly fee for using their TradingView charts in my analysis.
———————————
WISH YOU ALL LUCK

USDJPY short position 04/08/2025English : According to our analysis, we anticipate a bearish scenario.
Morocan Darija : kanchofo d'apres l'analyse dyalna antsanaw hboot
ATENTION : I only share my ideas, not signals

USDJPY Will Grow! Buy!
Here is our detailed technical review for USDJPY.
Time Frame: 12h
Current Trend: Bullish
Sentiment: Oversold (based on 7-period RSI)
Forecast: Bullish
The market is testing a major horizontal structure 147.215.
Taking into consideration the structure & trend analysis, I believe that the market will reach 150.314 level soon.
P.S
The term oversold refers to a condition where an asset has traded lower in price and has the potential for a price bounce.
Overbought refers to market scenarios where the instrument is traded considerably higher than its fair value. Overvaluation is caused by market sentiments when there is positive news.
Disclosure: I am part of Trade Nation's Influencer program and receive a monthly fee for using their TradingView charts in my analysis.
Like and subscribe and comment my ideas if you enjoy them!

USD/JPY(20250804)Today's AnalysisMarket News:
① The US non-farm payrolls rose by 73,000 jobs in July, far below the expected 110,000; the previous two months saw a significant downward revision of 258,000 jobs, prompting traders to fully price in two Fed rate cuts before the end of the year.
② The US ISM Manufacturing PMI for July unexpectedly fell to 48, below the expected 49.5 and the lowest level since October 2024.
③ The University of Michigan Consumer Confidence Index for July reached a five-month high.
Technical Analysis:
Today's Buy/Sell Levels:
148.53
Support and Resistance Levels:
152.12
150.78
149.91
147.15
146.28
144.94
Trading Strategy:
If it breaks above 148.53, consider entering a buy position, with the first target price being 149.91. If it breaks below 147.15, consider entering a sell position, with the first target price being 146.28.

USD/JPY - Potential Targets this WeekDear Friends in Trading,
How I see it,
Let me know if anything is unclear, inputs and questions always welcome.
I don't always have the right answers, but I do share my opinion freely.
Keynotes:
If attempts to fill all imbalances fail and or struggles for a clear
and decisive break above 149.500. Potential for more downside remains high.
NFP produced either a trend reversal igniter or a much-needed correction candle.
I remain bearish on this pair until the Killzone is decisively breached.
Talk of the town remains rate cuts that's very long overdue.
Interesting article to read in this regard:
www.tradingview.com
I sincerely hope my point of view offers a valued insight
Thank you for taking the time study my analysis.

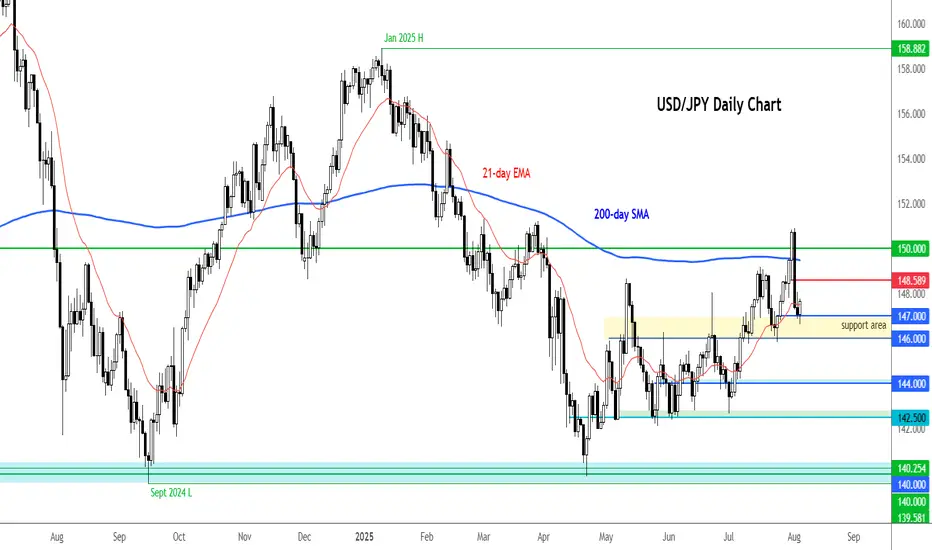
USD/JPY bounced off key support ahead of ISM surveyAfter Friday's weak jobs report and the downward revisions to prior readings, the mood shifted towards the dollar, with markets leaning towards the Fed delivering more than a couple of rate cuts this year. But we have seen a bit of a recovery in the USD since, suggesting investors are either expecting employment to pick up again or inflation to remain sticky amid higher tariffs.
Today’s attention turns to the ISM services report for July, where a modest uptick is expected. Should that materialise, it could give the dollar some further support following Friday’s wobble. We’ll also be hearing from Fed officials Susan Collins and Lisa Cook on Wednesday – and their comments may well shape expectations heading into the autumn.
Ahead of these events, the USD/JPY has bounced off the key support range we highlighted yesterday, between 146.00-147.00 area. A close below this zone would be a bearish outcome, but while it continues to hold we would favour looking for bullish trades than bearish ones. 148.60 then 150.00 are the next key levels to watch on the upside.
By Fawad Razaqzada, market analyst with FOREX.com
BUY USDJPYUSDJPY is experiencing a bhutifull upward push after the price triggered the demand area , the price is expected to recover wit a tendency of filing the FVG left due to last friday NFP news
use proper risk managemebt and risk what you can afford to loose

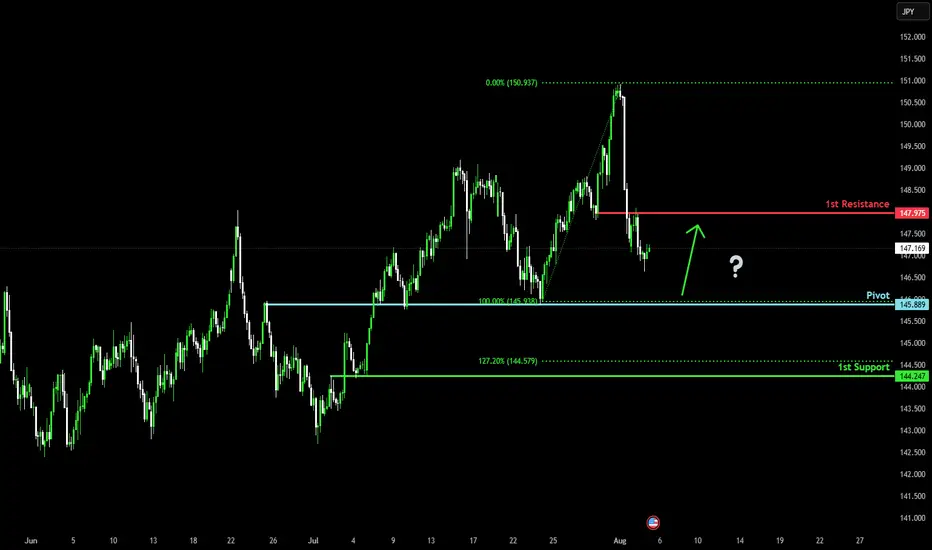
Falling towards major support?USD/JPY is falling towards the pivot, which has been identified as an overlap support and could bounce to the 1st resistance.
Pivot: 145.88
1st Support: 144.24
1st Resistance: 147.97
Risk Warning:
Trading Forex and CFDs carries a high level of risk to your capital and you should only trade with money you can afford to lose. Trading Forex and CFDs may not be suitable for all investors, so please ensure that you fully understand the risks involved and seek independent advice if necessary.
Disclaimer:
The above opinions given constitute general market commentary, and do not constitute the opinion or advice of IC Markets or any form of personal or investment advice.
Any opinions, news, research, analyses, prices, other information, or links to third-party sites contained on this website are provided on an "as-is" basis, are intended only to be informative, is not an advice nor a recommendation, nor research, or a record of our trading prices, or an offer of, or solicitation for a transaction in any financial instrument and thus should not be treated as such. The information provided does not involve any specific investment objectives, financial situation and needs of any specific person who may receive it. Please be aware, that past performance is not a reliable indicator of future performance and/or results. Past Performance or Forward-looking scenarios based upon the reasonable beliefs of the third-party provider are not a guarantee of future performance. Actual results may differ materially from those anticipated in forward-looking or past performance statements. IC Markets makes no representation or warranty and assumes no liability as to the accuracy or completeness of the information provided, nor any loss arising from any investment based on a recommendation, forecast or any information supplied by any third-party.
USDJPY - at his ultimate region, holds or not??#USDJPY .. market just reached at his current supporting region .
That is around 145.55 to 146.70
Keep close that region and if market holds that region then we can expect bounce from here
Keep close and don't be lazy here.
Good luck
Trade wisely
GBPJPY and USDJPY Analysis todayHello traders, this is a complete multiple timeframe analysis of this pair. We see could find significant trading opportunities as per analysis upon price action confirmation we may take this trade. Smash the like button if you find value in this analysis and drop a comment if you have any questions or let me know which pair to cover in my next analysis.

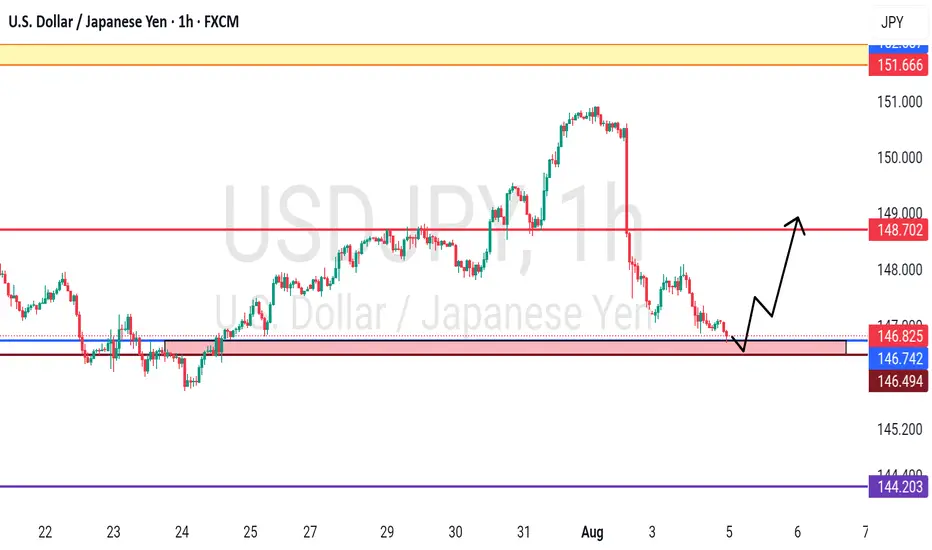
Bullish bounce off an overlap support?USD/JPY is falling towards the pivot, which has been identified as an overlap support and could bounce to the 1st resistance, which acts as a swing high resistance.
Pivot: 147.67
1st Support: 146.99
1st Resistance: 149.04
Risk Warning:
Trading Forex and CFDs carries a high level of risk to your capital and you should only trade with money you can afford to lose. Trading Forex and CFDs may not be suitable for all investors, so please ensure that you fully understand the risks involved and seek independent advice if necessary.
Disclaimer:
The above opinions given constitute general market commentary, and do not constitute the opinion or advice of IC Markets or any form of personal or investment advice.
Any opinions, news, research, analyses, prices, other information, or links to third-party sites contained on this website are provided on an "as-is" basis, are intended only to be informative, is not an advice nor a recommendation, nor research, or a record of our trading prices, or an offer of, or solicitation for a transaction in any financial instrument and thus should not be treated as such. The information provided does not involve any specific investment objectives, financial situation and needs of any specific person who may receive it. Please be aware, that past performance is not a reliable indicator of future performance and/or results. Past Performance or Forward-looking scenarios based upon the reasonable beliefs of the third-party provider are not a guarantee of future performance. Actual results may differ materially from those anticipated in forward-looking or past performance statements. IC Markets makes no representation or warranty and assumes no liability as to the accuracy or completeness of the information provided, nor any loss arising from any investment based on a recommendation, forecast or any information supplied by any third-party.

0721 Impact of Japanese Senate Elections on Yen Exchange Rate Hello traders,
1. I spent the entire weekend following the Japanese Senate elections, as they will determine the fluctuations of the world's largest financing currency—the yen exchange rate.
★ The results are out, and we are currently in scenario two— the ruling coalition suffered a crushing defeat + Shigeru Ishiba refuses to resign. However, senior figures within the Liberal Democratic Party, such as Taro Aso, have publicly stated that they intend to demand Prime Minister Ishiba's resignation for accountability, increasing the pressure on Ishiba to step down. This means we might see "scenario three"—the USD/JPY exchange rate could potentially break through the 151-155 range.
★ Is this the worst-case scenario? Of course not. The worst-case scenario would be if the "far-right party" that campaigned on the slogan "Japan First" achieved a landslide victory in this election. The most notable winner is a marginal far-right party known as the "Reform Party."
The Reform Party originated from a YouTube channel during the pandemic, which spread conspiracy theories about vaccines and "global elite conspiracies." NHK estimates that the Reform Party will win up to 22 seats, whereas three years ago, they had only 1 seat in the Senate and currently have only 3 seats in the House of Representatives.
✔ Let's take a look at this big winner's political proposals—stricter immigration restrictions + opposition to globalism + opposition to radical gender policies + reassessment of decarbonization and vaccine policies + massive tax cuts + increased social welfare spending. This means Japan may implement more "radical tax cuts" combined with aggressive economic stimulus through quantitative easing, leading to a more severe depreciation of the yen, increasing the likelihood of the USD/JPY exchange rate rising to the 160 range.
★ What are the risks of a sharp depreciation of the yen?
For Asia, the depreciation of the yen typically drags down other Asian currencies collectively, especially under U.S. tariff pressures, where Asian currencies are already under devaluation pressure. A strong depreciation of the yen would mean Japan is taking other Asian countries along with it off a cliff. We need to pay attention to the "passive" depreciation of the renminbi.
Asia will feel the pain, but Europe and the U.S. will also suffer. Theoretically, if the USD/JPY exchange rate surges (indicating a sharp depreciation of the yen), it is very advantageous for arbitrage trading with leverage (because the yen becomes cheaper). However, when the yen experiences a severe depreciation, the situation changes.
Let me give you a classic example: After Shinzo Abe returned to power at the end of 2012, he launched the "three arrows" economic policy: unlimited quantitative easing monetary policy + fiscal stimulus + structural reform = artificially lowering the yen exchange rate to stimulate exports (the clear goal was to increase the USD/JPY exchange rate) = rapid depreciation of the yen (from 80 in 2012 to 125 in 2015).
So what happened then? — A large number of Japanese institutions sold off U.S. bonds, European bonds, and REITs to cash out. The reason is simple:
✔ Japanese financial institutions (such as GPIF, insurance companies, and banks) hold a large amount of dollar/euro assets. When the yen depreciates, the yen-denominated market value of these foreign currency assets skyrockets. Selling off overseas assets is equivalent to cashing out foreign exchange gains in advance.
✔ The proportion of foreign currency assets is too high → must rebalance. Due to the yen depreciation, a large institution that originally allocated 20% of its total assets to foreign currency assets might see that proportion swell to 30% or 40%. This triggers asset allocation restrictions within pension and insurance funds (ALM principles), necessitating the sale of overseas assets and reallocation to yen-denominated assets.
✔ The yen depreciation phase is usually accompanied by an expansion of the U.S.-Japan interest rate differential. If Japanese institutions hedge their dollar assets, the hedging costs become very high (the costs of hedging through FX swaps and forwards rise), so they must also sell off some assets to reduce exposure. Therefore, in 2013, there was a collective sell-off of U.S. and European bonds.
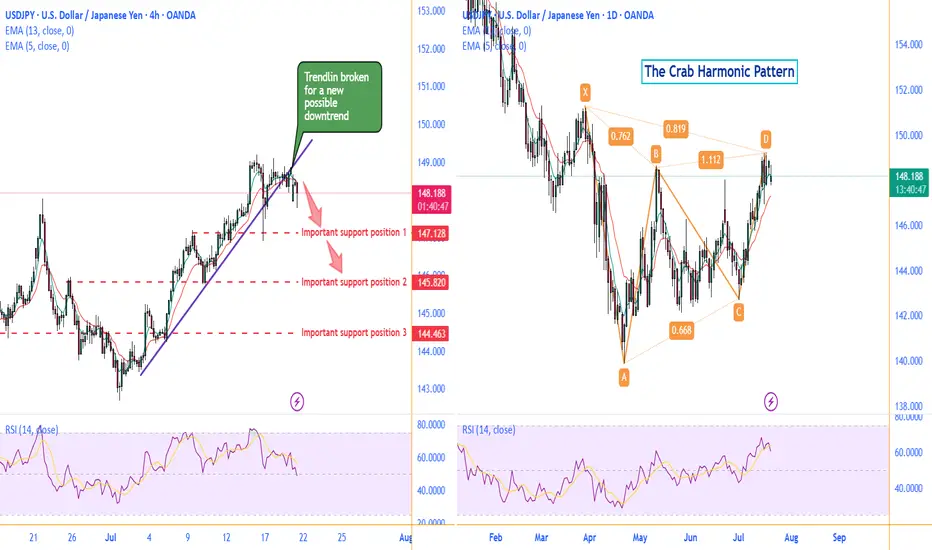
Technically:
Daily chart, there is a possible Crab Harmonic Pattern.
The Crab Harmonic Pattern
From the chart, we can see:
The upward move from A to B is labeled as 0.762, which falls within the Fibonacci ratio range of 0.618-0.786 for the A-B leg of the Crab pattern.
The downward move from B to C is labeled as 0.668, which also falls within the Fibonacci ratio range of 0.382-0.886 for the B-C leg of the Crab pattern.
The upward move from C to D is labeled as 1.112, which corresponds to the Fibonacci ratio range of 1.13-1.272 for the C-D leg of the Crab pattern.
Based on these Fibonacci ratio relationships, we can identify this price action pattern as a typical Crab harmonic pattern. This type of pattern often suggests that the price may be about to reverse.
On the left 4H chart, the broken trendline is suggesting a new possible downtrend to begin .
Make a good use of those support positions, sellers of UJ could find a great trade deal.
Follow me to get more update on UJ.
GOOD LUCK!
LESS IS MORE!
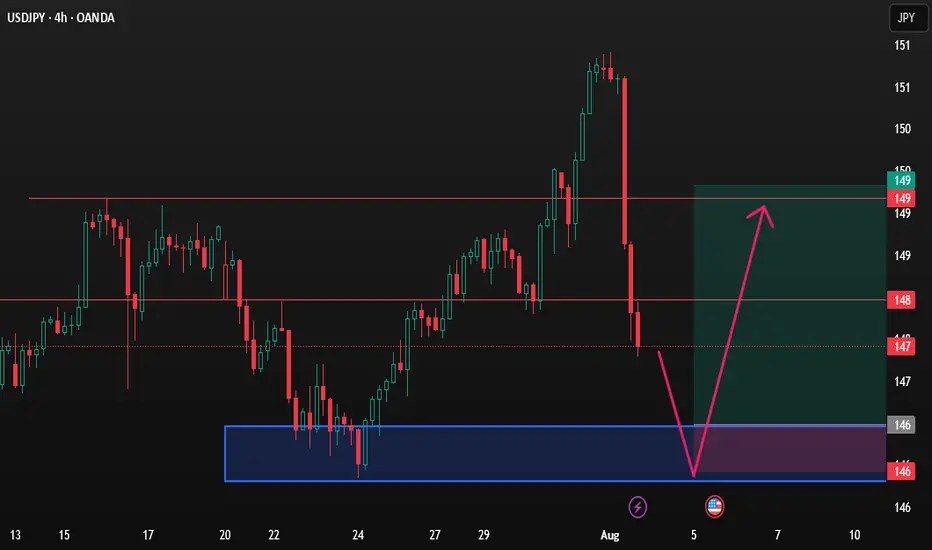
UJ| Bullsih Bias | Professional Sweep Forming Off 30M OB (Refined & Structured):
• Pair: USDJPY
• Bias: Bullish
• 4H Overview: After breaking previous highs, price pulled back into a sell-side liquidity (SSL) zone. This move shows signs of exhaustion following the sweep, hinting at bullish continuation.
• 30M Structure: Price took out internal liquidity/SSL and is now reacting from a refined 30-minute order block. Looks like a professional sweep is in play, with refined structure holding.
• Entry Zone: Waiting for further confirmation on the lower timeframes once the market opens.
• Targets: 5M and 30M structural highs depending on how price delivers.
• Mindset Note: This setup is a prime example of letting price come to you. Trusting HTF structure and recognizing the sweep fuels the patience needed to strike on LTF intent.

USDJPY I Technical and Fundamental Analysis Welcome back! Let me know your thoughts in the comments!
** USDJPY Analysis - Listen to video!
We recommend that you keep this on your watchlist and enter when the entry criteria of your strategy is met.
Please support this idea with a LIKE and COMMENT if you find it useful and Click "Follow" on our profile if you'd like these trade ideas delivered straight to your email in the future.
Thanks for your continued support!

Lingrid | USDJPY Possible Strong Bullish RallyThe price perfectly fulfilled my previous idea . FX:USDJPY is trading within an upward channel after forming a higher low near the 147.50 zone, bouncing from the support trendline. Price action suggests a bullish structure continuation toward the 150.95 resistance, especially if the recent consolidation breaks higher. The overall formation aligns with a healthy correction phase before a potential push into the resistance area. Confirmation above 148.60 would likely accelerate the bullish move.
📌 Key Levels Buy zone: 147.50–147.25
Sell trigger: Below 147.00
Target: 150.95
Buy trigger: Break above 148.80
⚠️ Risks
Break below 147.50 may shift sentiment bearish
Strong resistance awaits near 150.00
Broader market volatility could invalidate pattern
If this idea resonates with you or you have your own opinion, traders, hit the comments. I’m excited to read your thoughts!

USDJPY BULLISHTechnically:
Daily bullish
Bullish trendline support
200 EMA retest
Fib retracement
No bearish divergence

usdjpy buy limitWe’re waiting for the buy setup to form.
Price must hit our demand zone first.
News aligns with bullish sentiment.
No rush — patience protects capital.
We strike only when confirmation comes.
USDJPY 30Min Engaged ( BULLISH & Bearish Break Entry Detected )Time Frame: 30-Minute Warfare
Entry Protocol: Only after volume-verified breakout
🩸Bullish Break- 148.750
🩸Bearish Break- 148.370
➗ Hanzo Protocol: Volume-Tiered Entry Authority
➕ Zone Activated: Dynamic market pressure detected.
The level isn’t just price — it’s a memory of where they moved size.
Volume is rising beneath the surface — not noise, but preparation.
🔥 Tactical Note:
We wait for the energy signature — when volume betrays intention.
The trap gets set. The weak follow. We execute.

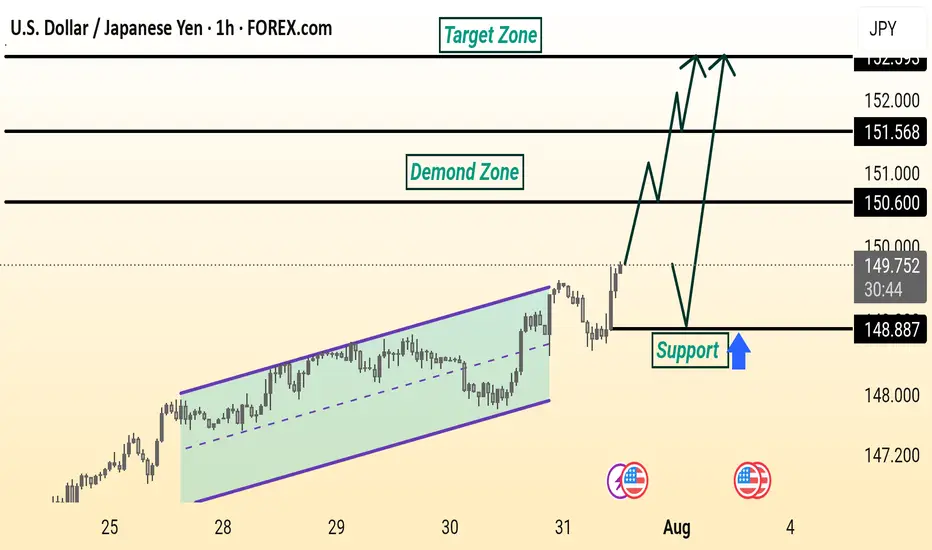
USD/JPY Analysis is Ready USD/JPY is showing a bullish setup. Price broke out of a rising channel and is expected to retest the 148.887 support level before moving higher toward the 150.600 and 151.568 resistance zones, targeting the 152.000 area. The demand zone adds strength to the potential upside.