USDJPY (daily analysis) 1/8hi everyone hope everyone had a great week and have a great weekend happy trading as always
JPYUSD trade ideas

USDJPY M15 Pending SELL Setup 🧭 1. Market Structure (15M + Higher TF Context)
Recent Shift: Bullish structure broke down with an aggressive bearish move (clear BOS).
Consolidation Zone (~147.45–148.17): Price accumulated after the impulsive drop.
Now: Currently trading just above 147.00, testing intraday support.
✅ Structure:
Prev. Highs swept (liquidity grab at top), followed by impulsive drop.
Price formed a bearish flag, broke down, and is now retesting the lower zone.
🗃️ 2. Liquidity Zones
🔴 Buy-side Liquidity Grab: Fakeout to the upside just before the dump — textbook inducement.
🔵 Sell-side Liquidity: Now building under 147.00, with lows being swept but no follow-through (yet) → potential liquidity engineering.
⚠️ If price closes below 146.90, sellers may step in with conviction.
🕯️ 3. Candlestick Behavior
Inside the consolidation box, candles show:
Weak bullish momentum
No strong engulfing or continuation
On the breakout, large bearish candles with follow-through, showing institutional intent
Now: Wicks on both sides → market indecision, likely accumulation before expansion
🔍 4. Chart Patterns Identified
🏁 Bear Flag: Formed after breakdown → continuation pattern
📦 Consolidation box (~147.0–148.15): Liquidity build-up
📉 Descending Triangle Potential: Multiple touches at support (~147.00) with lower highs — bearish pressure building
🔢 5. Fibonacci Reference (Swing High ~149.10 to Swing Low ~146.90)
Level Price Notes
0.382 ~147.70 Rejected here
0.5 ~148.00 Mid-consolidation box
0.618 ~148.25 Price failed to touch
📉 Bias stays bearish unless 148.25 is breached & closed above with volume.
📌 6. Trade Setup
📍 Pending Sell Setup
🔄 Alternative Scenario
📍 Invalidation & Buy Scenario
Only if strong bullish candle closes above 148.20
That would flip structure bullish
But current order flow does not favor this yet.
🧠 Final Notes:
Wait for clear breakout and candle close below 146.90 — no impulse entries inside the range.
Use 1M/5M price action to fine-tune entries once breakout occurs (look for break of structure + BOS on LTF).
Watch Tokyo/London open for real volume to kick in.

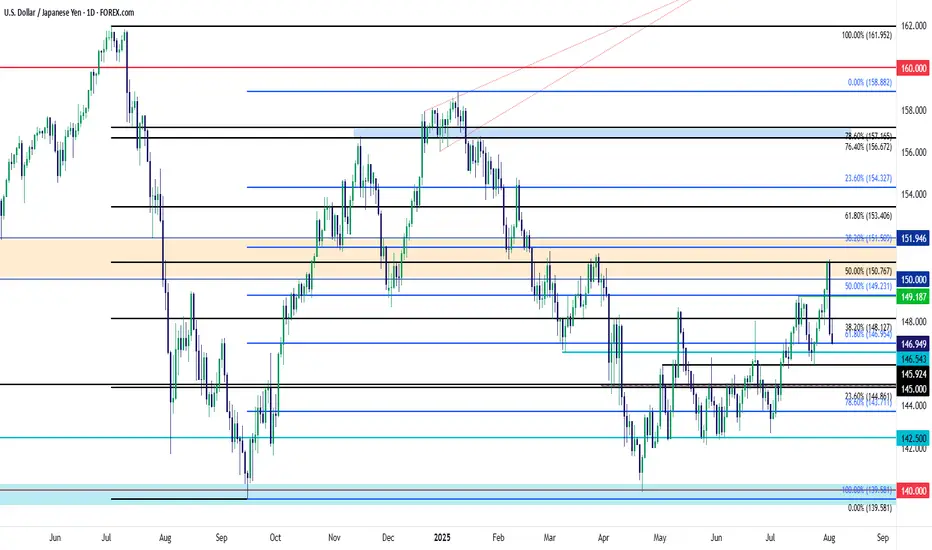
USD/JPY Breakout Falls Flat - Fibonacci Support TestUSD/JPY showed a strong breakout last week in the aftermath of the Fed, BoJ and the Core PCE report.
The big fundamental drive there was lower odds of rate cuts starting from the Fed - and this pushed back the worry of a larger case of carry unwind as USD/JPY remains more than 40% above the early-2021 levels that showed before the carry trade episode got started.
But - chasing the pair continues to be a major challenge as I've highlighted in these pieces, and the Fibonacci resistance that showed up on Thursday has since led to a strong pullback, with USD/JPY now testing another key Fibonacci level for support at 146.95, which is the 61.8% retracement of the recovery move that started last September.
The risk here is that markets pricing in rate cuts from the Fed could cause a rally in the Japanese Yen which brings USD/JPY back to that 140.00 level. And if that breaks, there could be even more motivation for hedges built around that carry trade to unwind. Similar to last July, that could eventually hit other asset classes as the leverage brought on by low rates in Japan quickly draws out of the market. So, there's some significant macro risk here, and this is one of the reasons why we saw such a strong breakout last week when it looked like that rate compression between the U.S. and Japan was not going to happen.
The big question now in USD/JPY is whether bulls step in to hold support. Two weeks ago, following Japanese elections, it was the 145.92 level that held support, and that remains a big line in the sand today. But, if we see sellers grind below 145.00, that could cause other current longs in USD/JPY to get cautious. - js
USDJPY: Breaking Out With Macro Backing 🟢 USDJPY | Breakout Opportunity Above Resistance
Timeframe: 1H
Bias: Bullish
Type: Break and Retest
📊 Technical Setup
USDJPY is currently consolidating at a key 4H resistance zone (147.75–147.90). A clean breakout and retest of this area will confirm bullish continuation.
• Entry: Above 147.90 (after confirmed candle close + retest)
• SL: Below 147.30
• TP: 148.90 / 149.60
• RR: ~1:2.5
• Indicators: RSI showing strong upside momentum, holding above 50
🧠 Fundamentals + Macro Confluence
• USD Strength: Strong macro & delayed rate cuts support USD upside
• JPY Weakness: BOJ remains dovish; risk-on sentiment weighing on JPY
• COT + Conditional Score: USD score increased to 17, JPY dropped to 8
• Risk Sentiment: VIX at 14.2 = RISK ON → bearish JPY bias
🧭 Gameplan
“Wait for confirmation above resistance before entering”
🔔 Set alerts around 147.90 and monitor lower timeframes for retest and bullish candle structure.

USDJPY swing bull trade - 4.8.25We are in bullish trend 4H and 1H timeframe. On 15 min we have bullish divergence. Trade is already on BE. Lets see, what market can give us.

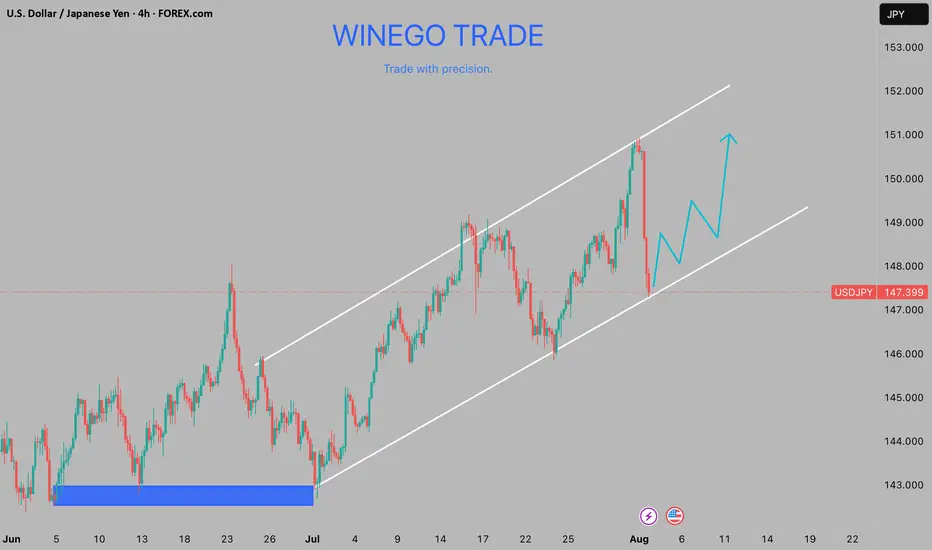
Bullish momentum kicks inThe USDJPY is attempting a bullish reversal to align with a long term trend, BULLISH. Friday's high might be a good profit taking area before a run below Sunday's low.

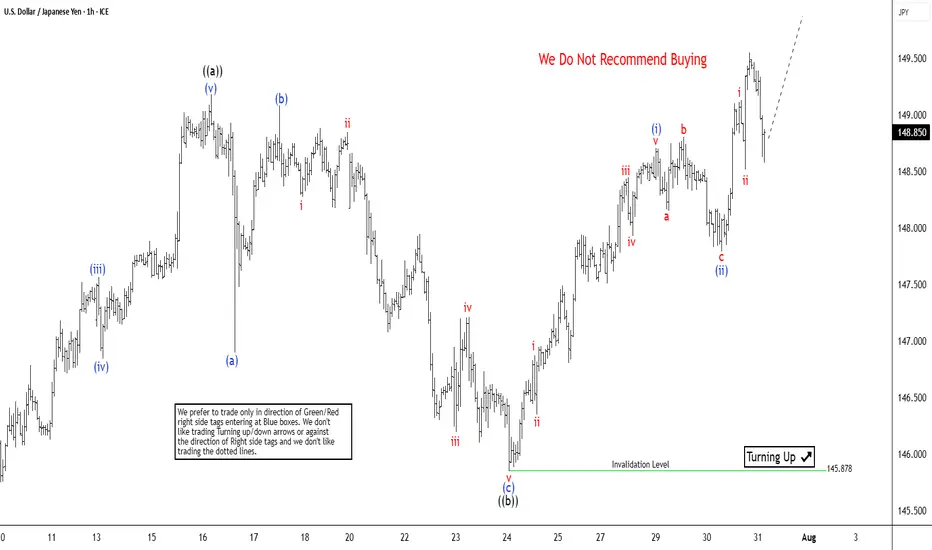
USDJPY Targets Completion of 7 Swing RallyThe USDJPY pair exhibits an incomplete bullish sequence originating from the April 22, 2025 low, signaling potential for further upside. We can project the extreme target area for this rally can be projected using using the 100% to 161.8% Fibonacci extension from the April 22 low. This places the target range between 150.88 and 156.33. The ongoing rally from the May 27, 2025 low is unfolding as a double three Elliott Wave structure. This structure has two zigzag corrective structure driving the upward momentum.
From the May 27 low, wave W concluded at 148.03. A corrective pullback in wave X then followed, which bottomed at 142.67. Currently, wave Y is in progress, with internal subdivision as a zigzag pattern. From the wave X low, wave ((a)) peaked at 149.18, followed by a corrective wave ((b)) that unfolded as a zigzag. Within this structure, wave (a) ended at 147.81 and wave (b) reached 149.08. Wave (c) completed at 145.87, finalizing wave ((b)) in the higher degree. The pair has since resumed its ascent in wave ((c)), developing as a five-wave impulse.
From wave ((b)), wave (i) concluded at 148.71, with a minor pullback in wave (ii) at 147.79. In the near term, as long as the pivot low at 145.87 holds, dips are expected to attract buyers in a 3, 7, or 11-swing corrective pattern, supporting further upside toward the Fibonacci extension targets.
USD/JPY Rejection Trade: Short from ResistanceUSD/JPY 1H Short Setup
Price entered a key resistance zone near 148.700–148.850 and formed a rejection. A short position is triggered with a stop loss above the resistance and target at 147.856 support. Bearish momentum expected.

UDSJPY DRIVEN BY A BULLISH TRENDThe USDJPY pair is currently trading within a well-defined upward channel, showcasing a bullish trend that has been unfolding over recent periods. This upward trajectory is supported by a series of higher lows, with the most recent formation occurring near the 147.40 support level.
The pair's ability to hold above this level and potentially bounce off the trend-line suggests a strong foundation for further upside movement. A key level to watch in this context is 147.80, which, if breached to the upside, would likely provide further confirmation of the bullish momentum. Such a break would not only reinforce the existing upward trend but also potentially accelerate the pace of the advance.
In conclusion, the USDJPY pair's current technical setup appears conducive to further upside movement, driven by the bullish trend within the upward channel and supported by the recent higher low formation. A break above 147.80 would be a key catalyst for accelerating the bullish momentum, potentially paving the way for a move towards higher resistance levels.
USDJPY: The Fed & BOJ Likely To Keep Rates In Place. Buy It!Welcome back to the Weekly Forex Forecast for the week of July 28 - Aug 1st.
In this video, we will analyze the following FX market:
USDJPY
The FED and BOJ are expected to keep their perspective interest rates, come Wednesday. The USD is stabilizing, a US-Japanese tariff deal inked, and investors are slowing moving money from the Yen safe haven to riskier assets.
Look for USDJPY to slowly move higher.
Enjoy!
May profits be upon you.
Leave any questions or comments in the comment section.
I appreciate any feedback from my viewers!
Like and/or subscribe if you want more accurate analysis.
Thank you so much!
Disclaimer:
I do not provide personal investment advice and I am not a qualified licensed investment advisor.
All information found here, including any ideas, opinions, views, predictions, forecasts, commentaries, suggestions, expressed or implied herein, are for informational, entertainment or educational purposes only and should not be construed as personal investment advice. While the information provided is believed to be accurate, it may include errors or inaccuracies.
I will not and cannot be held liable for any actions you take as a result of anything you read here.
Conduct your own due diligence, or consult a licensed financial advisor or broker before making any and all investment decisions. Any investments, trades, speculations, or decisions made on the basis of any information found on this channel, expressed or implied herein, are committed at your own risk, financial or otherwise.

USDJPY descending only to fetch more buyers.The USDJPY bearish mode might be short-lived if it could show any reversal pattern on a shown orderblock!

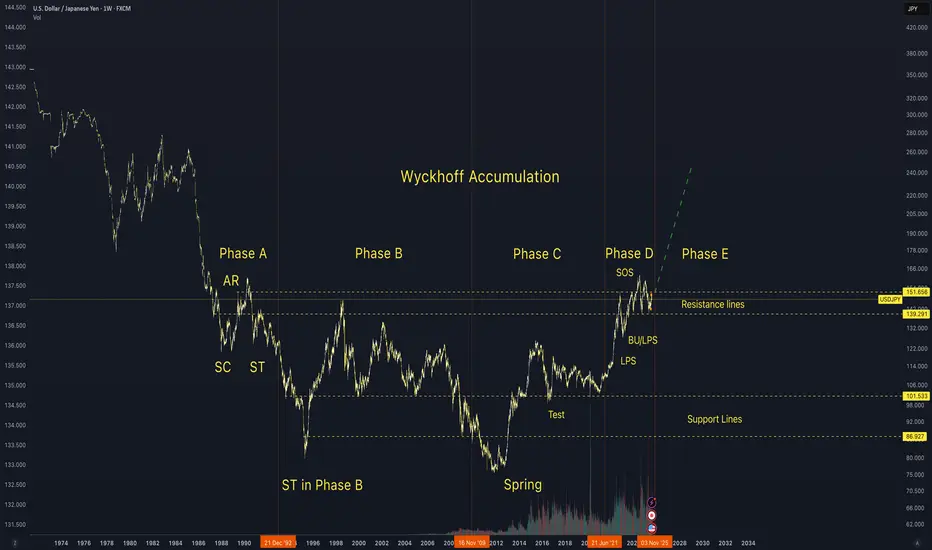
USD/JPY Wyckhoff Accumulation on weekly Chart Looks like a fairly textbook Wyckhoff accumulation on the USD/JPY Pair and looking ready to move up and to the right soon.
USDJPY POTENTIAL CONTINUATION AFTER A PULLBACKPrice has returned to the recent demand zone after a BOS and is now showing signs of rejection following a pullback (retracement). The mitigation of the DEMAND zone suggests that institutions may have filled their buy orders and are now ready to push price higher.
📉 Execution Plan:
• Entry: On the demand zone
• SL: Just below the demand zone (allow breathing room).
• TP: Next supply zone or based on structure (e.g., swing high, imbalance fill).

USDJPY long at current market priceDaily candle USDJPY closed at strong bullish.
we observed healthy retracement during Asian session.
I'm expecting the price will bounce from here.
Calculate your own risk & reward.
Good Luck

USD/JPYThis is a trade setup for USD/JPY, based on volume and trend analysis.
Entry Price: 150.360
Stop-Loss (SL): 150.740
Take-Profit (TP): 149.963
The trade is intended to be executed instantly at the mentioned price, in alignment with both volume behavior and the current trend direction.
Disclaimer: This setup is shared purely for backtesting purposes and to document trade ideas. It is not financial advice. Always perform your own analysis before making any trading decisions.

DeGRAM | USDJPY fixed above the descending channel📊 Technical Analysis
● Dollar-yen has punched through the 16-month descending channel top and twice retested it as support (false-break tags), carving a rising trend line that now guides price away from 144.90.
● Inside the break zone a smaller pennant is forming; a 4 h close above 147.18 completes the pattern and activates the channel-height target at 150.80 near the November swing cap.
💡 Fundamental Analysis
● US 2-yr yields pushed to a three-month high after hotter CPI core-services and Barkin’s “inflation progress has stalled”, while the BoJ July minutes flagged only “gradual” QT—widening the policy gap and reviving carry demand for yen shorts.
✨ Summary
Long 145.2-146.2; pennant break >147.18 targets 150.80. Bias void on a 4 h close below 142.80.
-------------------
Share your opinion in the comments and support the idea with like. Thanks for your support!

USDJPY POTENTIAL CONTINUATION AFTER A PULLBACK Price has returned to a higher time frame supply zone after a change in structure and is now showing signs of rejection following a pullback (retracement). The mitigation of the supply zone suggests that institutions may have filled their sell orders and are now ready to push price lower.
📉 Execution Plan:
• Entry: On lower timeframe BOS/CHOCH or strong bearish reaction after mitigation.
• SL: Just above the supply zone (allow breathing room).
• TP: Next demand zone or based on structure (e.g., swing low, imbalance fill).
• RR: Minimum 1:3, ideally 1:5 depending on refinement and volatility.

Bearish - but first up then downBearish - but first up then down Bearish - We’re currently seeing a deceptive move: price is pushing upward into a supply zone or imbalance, likely to lure late buyers. The bigger picture remains bearish — structure is still respecting lower highs.
Play:
Expect a short-term move up to mitigate imbalances or tap supply (liquidity grab), followed by a strong rejection and continuation down in line with higher timeframe bearish structure.
Watching for a sharp CHoCH or bearish engulfing in key zones to reinforce the sell.
Let me know if you want this in a more coded style just for your trading group.

What we looking at heeeeeeeeeeere? My meaningful description is Im looking at this USDJPY pair and drawing magic lines, follow me for more meaningful insights.
TLDR possible long term down trend incoming, if confirmed, plentiful continuation shorts will be available to all.


USDJPY Setup: Prime Buy Zone with a Clear Target!Good morning my friends,
I've prepared a fresh USDJPY analysis just for you.
Currently, the most logical buy zone sits at 147.170. If price reaches this level and performs a retest, it’s likely to target the 149.185 level.
I'll personally be entering at 147.170 and waiting for my target: 149.000.
This setup is based on the 4-hour timeframe, so it may take some time to reach the target.
Every single like you give is a major source of motivation for me to keep sharing these analyses.
Thanks so much to everyone supporting with a like!

USD_JPY RESISTANCE AHEAD|SHORT|
✅USD_JPY is going up now
But a strong resistance level is ahead at 151.232
Thus I am expecting a pullback
And a move down towards the target of 150.368
SHORT🔥
✅Like and subscribe to never miss a new idea!✅
Disclosure: I am part of Trade Nation's Influencer program and receive a monthly fee for using their TradingView charts in my analysis.

USD/JPY BEARS ARE GAINING STRENGTH|SHORT
USD/JPY SIGNAL
Trade Direction: short
Entry Level: 147.871
Target Level: 145.815
Stop Loss: 149.230
RISK PROFILE
Risk level: medium
Suggested risk: 1%
Timeframe: 1D
Disclosure: I am part of Trade Nation's Influencer program and receive a monthly fee for using their TradingView charts in my analysis.
✅LIKE AND COMMENT MY IDEAS✅
