USDJPYDate:
July 30,2025
Session:
Asia and Sydney Session
Pair:
USDJPY
Bias:
Long
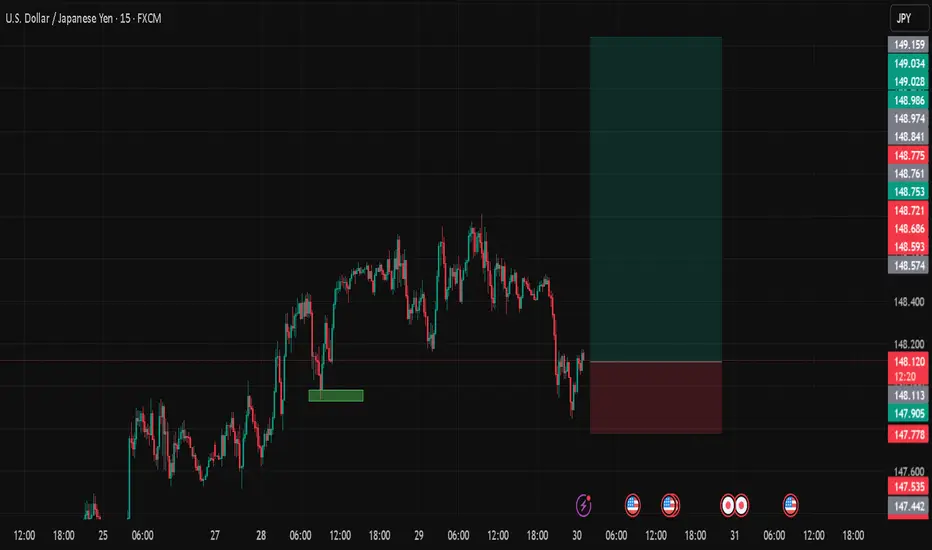
Liquid from Mondays New york open swept now price wants to follow trend
Entry: 148.108
Stop Loss: 147.778
Target: 149.640
RR: 4.57
JPYUSD trade ideas
USDJPY 4H Analysis : Curve Breakout & Retest Completed + Bullish"Momentum Building Above Retested Demand – Will Bulls Take Control?"
📊 Market Structure Overview:
USDJPY has shown a clean bullish structure in recent sessions, supported by a strong demand retest and a steady parabolic curve formation (Black Mind Curve Line). The pair has successfully broken above a major resistance, retested it, and is now holding higher ground—suggesting potential for continued upside if current structure holds.
🧱 Detailed Technical Breakdown:
🔹 1. Demand & Retesting Behavior
The chart highlights a key demand zone (green box) that was previously used after a bullish move.
Price recently returned to this zone for a clean retest, validating its role as a strong support.
This type of retesting behavior is critical in smart money analysis, confirming that accumulation has occurred and sellers have been absorbed.
🔹 2. Major Breakout Confirmation
The previous major structure level has been decisively broken to the upside.
This level now acts as support, increasing the probability that the bullish move will sustain.
🔹 3. Black Mind Curve Line (Parabolic Structure)
A parabolic curved trendline supports the current price action, showing how bulls are gradually gaining momentum.
This curve represents buyer interest increasing over time, which often leads to an aggressive breakout when paired with retest confirmation.
📍 Key Price Zones:
Type Price Level (Approx.) Description
🔹 Retesting Zone ~148.800 – 149.100 Support zone after major breakout
🔺 Resistance Target (1) ~150.500 Bullish breakout target (short-term)
🔻 Downside Risk (2) ~147.000 – 146.500 Bearish invalidation zone if demand fails
🔹 Full Supply Area ~145.000 – 145.500 Historical supply zone if price fails completely
🔮 Trade Scenarios:
✅ Scenario 1 – Bullish Continuation (Primary Bias)
Retest is complete, and price is holding above the curve and demand zone.
If bullish momentum continues:
📈 Target 1: 150.50 – Near-term resistance and liquidity area
📈 Target 2: 151.20+ – Extension target if buyers dominate
Bullish Confirmation:
Price must stay above ~149.00 and continue forming higher highs.
Entry ideas: Wait for minor consolidation above current price or bullish breakout from mini range.
⚠️ Scenario 2 – Bearish Rejection
If price rejects from current level and breaks below the curve and demand zone (~148.80):
📉 First downside target: 147.00 (minor support)
📉 Final bearish target: 145.50 (full supply zone)
Bearish Confirmation:
Breakdown of curve support and close below the retesting zone with momentum.
Such a move would suggest buyers failed, and market may rotate lower.
🧠 Market Sentiment & Psychology:
Smart Money Behavior: Demand was filled cleanly and retested, indicating possible institutional interest at that level.
Momentum Curve: As shown by the black curve, momentum is rising gradually—this reflects confidence building among buyers.
However, price is near psychological resistance (150.00–150.50 zone), where heavy sell orders might be placed.
The market is in a decision zone, where confirmation of strength or failure will dictate the next 200–300 pip move.
🎯 Summary:
USDJPY is showing a bullish structure supported by:
A valid retest of demand
A clean breakout of major resistance
An ascending parabolic curve
If bulls defend the current zone, we may see a powerful continuation toward 150.50+. If price fails to hold above the retest zone, downside risks open toward 147.00 and potentially the full supply at 145.00.
📌 Trade Smart: Wait for price confirmation, manage risk with stop placement below the demand zone or structure lows, and avoid chasing the move.

USDJPY 60/15 Pullback LongOverall up trend. Yesterday session a 'b' market profile. Aways from POC. looking for up continuous. Now is in pullback, montior for long oppoturnity.
If break and stay below market shift, then no go.

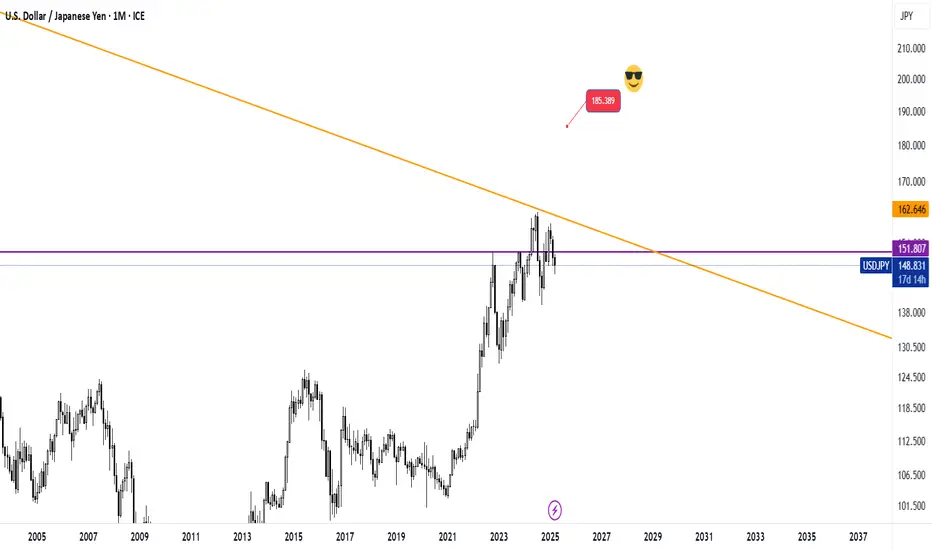
Increasing chances of bullish volatility in JPYThe fluctuations formed since May 2024 indicate a strengthening of the possibility of upward fluctuations in the currency pair, and in the long term, there is news of price targets in the range of 185 units!
Be careful, we will face numerous upward and downward fluctuations until the desired price target is reached!
Good luck
MJ.REZAEI
USDJPY AnalysisThis analysis is based on the 4-hour timeframe, reversal trading, and trend formation. I' looking for buys in this market and I explained why in the video. I will post updates on this analysis soon!

USDJPY – Liquidity Grab Before Continuation Down
**📉 USDJPY – Liquidity Grab Before Continuation Down**
📍 *Update to previous publication*
Following further technical analysis, the current price action suggests a **short-term bullish move** on USDJPY — likely acting as a **liquidity grab over previous session highs**.
This corrective movement is expected **before price resumes its broader bearish direction**.
🔍 Key observations:
* Price may seek short-term buy-side liquidity above recent highs.
* Liquidity engineering likely, especially around the **148.800 zone**.
* My **bias remains bearish**, but only **after liquidity is taken** and structure confirms a reversal.
Waiting for signs of exhaustion or confirmation around the upper FVG to align with the primary short thesis.
---DO NOT USE AS SIGNAL OR ANY OF A KIND--
EMERSON MASSAWE
COO | FINANCIAL MARKET ANALYST 6+

USD-JPY Will Keep Growing! Buy!
Hello,Traders!
USD-JPY keep growing and
The pair made a bullish breakout
Of the key horizontal level
Of 149.181 and the pair is
Already retesting the new
Support and we will be
Expecting a further
Bullish move up
Sell!
Comment and subscribe to help us grow!
Check out other forecasts below too!
Disclosure: I am part of Trade Nation's Influencer program and receive a monthly fee for using their TradingView charts in my analysis.

USD/JPY) Bullish Trend Read The captionSMC Trading point update
Technical analysis of USD/JPY on the 4-hour timeframe, with a focus on a support-resistance structure and trend
---
Technical Breakdown:
1. Market Structure:
Price is moving in a clear uptrend, making higher highs and higher lows.
A recent pullback into a support zone suggests potential for a bullish continuation.
2. Key Zones:
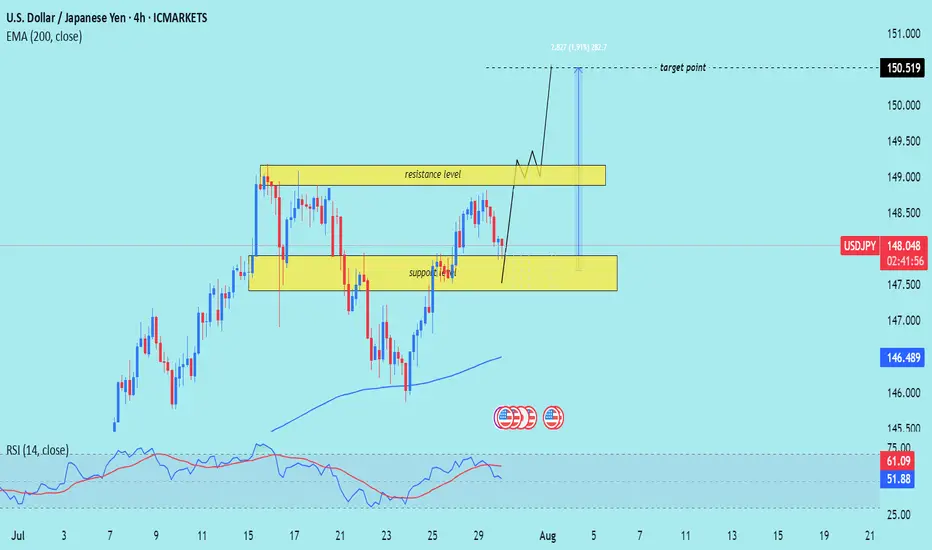
Support Zone: Around 147.00–147.50, highlighted in yellow — the area where price recently bounced.
Resistance Zone: Around 148.800–149.300, which price is expected to break through.
Target Point: Clearly marked at 150.519, aligning with the prior high and a projected bullish extension.
3. EMA (200):
The 200 EMA (blue) is at 146.489, far below current price — signaling strong bullish momentum.
4. RSI (14):
RSI is at 61.14, showing bullish momentum without being overbought — supportive of further upside.
No divergence is noted, which supports trend continuation.
5. Projection (Drawn Path):
The chart suggests price may bounce from support, break through resistance, and rally toward 150.519, possibly after a retest of the resistance-turned-support.
Mr SMC Trading point
---
Trade Idea Summary:
Bias: Bullish
Entry Zone: Near 147.00–147.50 (support)
Confirmation: Bullish candlestick pattern or strong bounce
Target: 150.519
Invalidation: Break and close below 146.489 (200 EMA) or sustained move below support zone
---
Please support boost 🚀 this analysis)
USDJPY Short from ResistanceHello Traders
In This Chart USDJPY HOURLY Forex Forecast By FOREX PLANET
today USDJPY analysis 👆
🟢This Chart includes_ (USDJPY market update)
🟢What is The Next Opportunity on USDJPY Market
🟢how to Enter to the Valid Entry With Assurance Profit
This CHART is For Trader's that Want to Improve Their Technical Analysis Skills and Their Trading By Understanding How To Analyze The Market Using Multiple Timeframes and Understanding The Bigger Picture on the Charts

USDJPY A Fall Expected! SELL!
My dear subscribers,
My technical analysis for USDJPY is below:
The price is coiling around a solid key level - 148.71
Bias - Bearish
Technical Indicators: Pivot Points Low anticipates a potential price reversal.
Super trend shows a clear sell, giving a perfect indicators' convergence.
Goal - 147.93
About Used Indicators:
By the very nature of the supertrend indicator, it offers firm support and resistance levels for traders to enter and exit trades. Additionally, it also provides signals for setting stop losses
Disclosure: I am part of Trade Nation's Influencer program and receive a monthly fee for using their TradingView charts in my analysis.
———————————
WISH YOU ALL LUCK

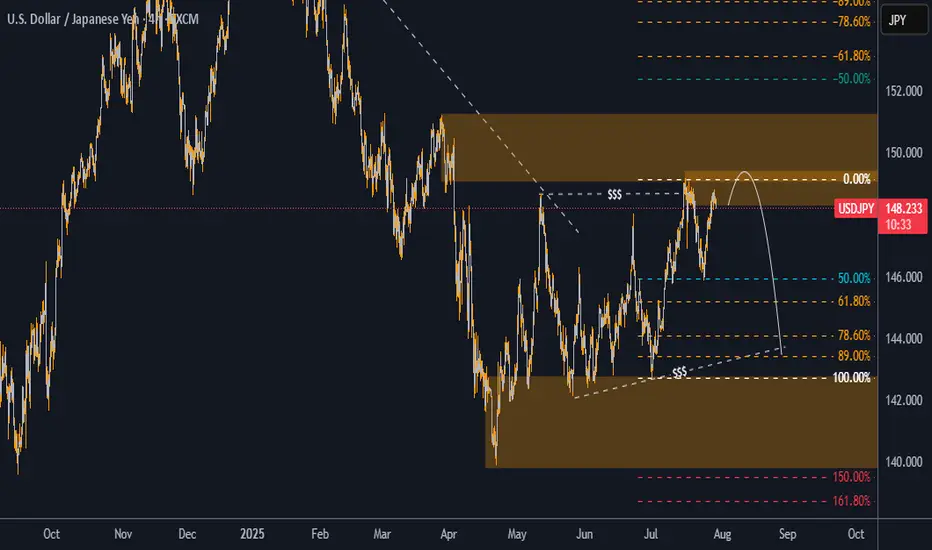
USD/JPY Technical Analysis – Bearish Outlook from Key Supply ZonThe USD/JPY pair is currently presenting a strong bearish opportunity and price action structure. As of the latest 4H chart analysis, the price has reached a well-defined supply zone around the 148.80–149.70 area. This zone aligns with a previous institutional level where price showed significant reaction, marking it as a valid area of interest for sellers.
Liquidity Grab & Rejection
The market structure remains bearish overall. Recently, price took out a cluster of liquidity above the previous highs. This liquidity sweep suggests that smart money may have accumulated short positions, preparing for a move lower.
High-Probability Sell Zone
The price is currently reacting to a premium zone near the 0% Fibonacci retracement level, drawn from the recent swing high to swing low. This zone also coincides with a previous area of imbalance and supply, reinforcing the bearish setup.
Key Bearish Targets
First Target: 145.89 — this aligns with the 50% Fibonacci retracement level and a previous structural support.
Second Target: 142.56 — this deeper target sits near the 89% Fibonacci level, close to an old demand zone where price may look to rebalance.
Summary
With trend direction biased to the downside, the pair is showing strong signs of rejection from a key supply zone after sweeping liquidity. If momentum continues, we expect USD/JPY to drop toward 145.89 initially, with an extended move possibly reaching 142.56.
Traders should monitor price action closely for further confirmations and maintain proper risk management, especially with upcoming economic catalysts that may affect the JPY.
USDJPY broke the trendline support likely to go fib 0.5 levelUSDJPY was trading in uptrend and recently has broken the Support and is likely to have a correction till the fib 0.5 level.
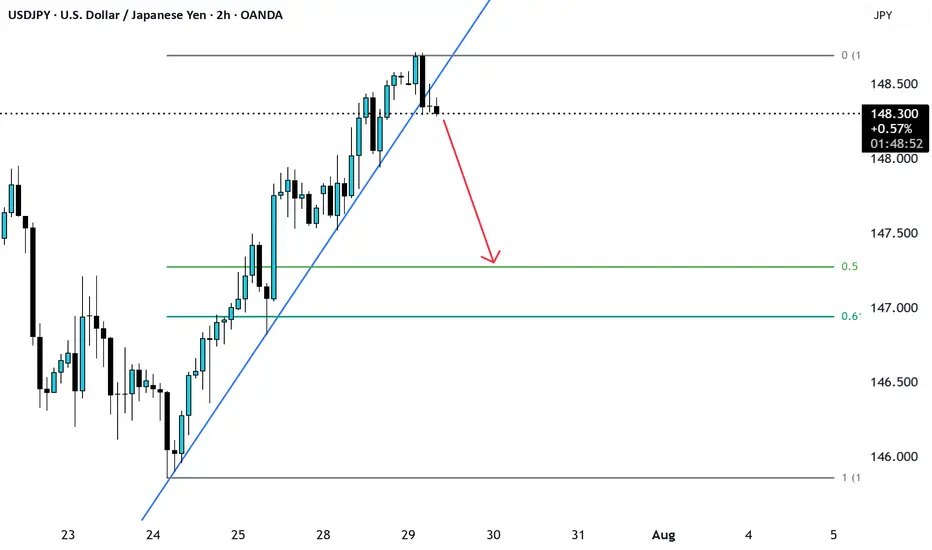
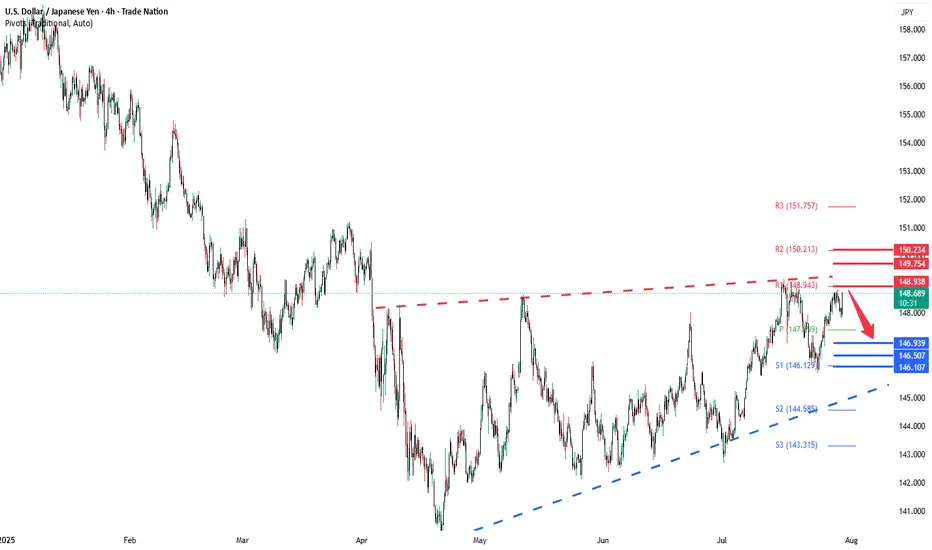
USDJPY rising wedge capped at 148,90The USDJPY pair is currently trading with a bearish bias, aligned with the broader downward trend. Recent price action shows a retest of the falling resistance, suggesting a temporary relief rally within the downtrend.
Key resistance is located at 149.90, a prior consolidation zone. This level will be critical in determining the next directional move.
A bearish rejection from 148.90 could confirm the resumption of the downtrend, targeting the next support levels at 146.93, followed by 146.50 and 146.10 over a longer timeframe.
Conversely, a decisive breakout and daily close above 148.93 would invalidate the current bearish setup, shifting sentiment to bullish and potentially triggering a move towards 149.75, then 150.20.
Conclusion:
The short-term outlook remains bearish unless the pair breaks and holds above 148.90. Traders should watch for price action signals around this key level to confirm direction. A rejection favours fresh downside continuation, while a breakout signals a potential trend reversal or deeper correction.
This communication is for informational purposes only and should not be viewed as any form of recommendation as to a particular course of action or as investment advice. It is not intended as an offer or solicitation for the purchase or sale of any financial instrument or as an official confirmation of any transaction. Opinions, estimates and assumptions expressed herein are made as of the date of this communication and are subject to change without notice. This communication has been prepared based upon information, including market prices, data and other information, believed to be reliable; however, Trade Nation does not warrant its completeness or accuracy. All market prices and market data contained in or attached to this communication are indicative and subject to change without notice.
USDJPY - 30/7/25 - BoS to a bearish pull backI dont normally trade USDJPY but i see a setup based on my strategy. The price was climbing to take out a previous high on the 4H and Daily TF. But on the hourly there is a clear BoS which suggests that there may be a pull back even though the HTF bias is still bullish.
+ve:
1. there is a BoS on the 1 hour chart
2. Equal low liquidity just below which will draw price to this zone
3. Big imbalance below the equal low liquidity
-ve:
1. Fed news today may push the market against my trade idea

USDJPY – Bearish Pressure Builds Near Channel TopUSDJPY is approaching strong resistance around 149.900, a level that has repeatedly triggered price rejections. The ABCD structure suggests the current bullish correction may be nearing completion. If price fails to break above this zone, selling pressure could emerge.
On the news front, Japan’s core inflation remains elevated, reinforcing expectations that the BOJ will maintain its current stance. Meanwhile, the U.S. dollar is losing momentum after a series of mixed economic data releases.
Strategy: Consider SELL opportunities if clear reversal signals appear near 149.900. A short-term target lies around the 148.200 support zone. A confirmed break below this level could signal the start of a deeper bearish move.

USDJPY Forming Bullish Reversal | MMC Analysis + Target🧠 Chart Overview (2H Timeframe)
🔸 1. Head and Shoulders Inverse Pattern – MMC Bullish Blueprint
The chart beautifully shows an Inverse Head & Shoulders pattern, one of the most powerful reversal signals under MMC logic:
Left Shoulder: Formed after the initial drop and quick recovery.
Head : Deep liquidity grab and reversal from the lowest point (demand zone).
Right Shoulder: Higher low structure, indicating reduced selling pressure and shift in momentum.
This pattern is forming around a previous liquidity zone, which makes it more valid and aligned with smart money behavior.
🔸 2. Retesting Zone – Critical MMC Demand Area
Price is now retesting a highlighted demand zone, which acted as the springboard for the previous bullish move:
Bullish Pattern marked aligns with MMC’s concept of “Return to Origin”.
This zone also sits just above the right shoulder, confirming that buyers are defending aggressively.
If this level holds, we may see a strong continuation move to the upside.
🔸 3. Previous Reversal Zone (Supply) – Next Target Area
Marked in light green, this area is the next critical resistance:
Acts as liquidity target for institutions if price rallies.
Historically acted as a major reversal point.
Price is likely to show reactions or profit-taking behavior here.
Once broken and retested, it becomes a new support for further upside continuation (as marked on the chart).
🔸 4. Dual Scenarios – Bullish vs Bearish Pathways
Your chart correctly outlines two strategic possibilities:
✅ Bullish Scenario:
Price respects demand zone.
Breaks above previous reversal zone (149.000+).
Bullish continuation toward 149.800–150.500 range.
MMC tip: “If it goes bullish, use previous demand or double it” = Add confluence or stack demand zones for scale-in entries.
❌ Bearish Scenario:
If price breaks below retesting zone, bullish invalidation triggers.
Look to the previous all supply zone (Zone Pattern Must) for next reaction.
This scenario reflects smart money rejection of upside continuation.
🗂️ MMC Structural Elements Identified:
Zone/Pattern Role in Analysis
Inverse H&S Trend reversal signal
Retesting Zone Demand/entry area
Previous Reversal Zone First key resistance / next liquidity pool
Supply Zone Below Target in case of downside breakdown
MMC Logic Follow price structure, fakeouts, demand/supply traps
📈 Summary Outlook:
USDJPY is showing a technical bullish structure backed by MMC-based price psychology. The current pullback into a demand zone gives traders an excellent R:R opportunity for long positions, targeting higher zones upon breakout confirmation.
🟩 If bullish, breakout >149.000 will likely lead toward 150.000+
🟥 If bearish, breakdown <147.600 opens doors to deeper drop toward 146.000 zone (watch for reversal pattern).
🔑 Key Levels to Watch:
Type Level Range Notes
Support 147.600–147.800 Current retesting demand
Resistance 148.800–149.300 Previous Reversal Zone (Profit booking area)
Higher Resistance 150.500+ Final upside objective
Breakdown Zone <147.500 Flip to bearish scenario

USDJPY – DAILY FORECAST Q3 | W31 | D30 | Y25📊 USDJPY – DAILY FORECAST
Q3 | W31 | D30 | Y25
Daily Forecast 🔍📅
Here’s a short diagnosis of the current chart setup 🧠📈
Higher time frame order blocks have been identified — these are our patient points of interest 🎯🧭.
It’s crucial to wait for a confirmed break of structure 🧱✅ before forming a directional bias.
This keeps us disciplined and aligned with what price action is truly telling us.
📈 Risk Management Protocols
🔑 Core principles:
Max 1% risk per trade
Only execute at pre-identified levels
Use alerts, not emotion
Stick to your RR plan — minimum 1:2
🧠 You’re not paid for how many trades you take, you’re paid for how well you manage risk.
🧠 Weekly FRGNT Insight
"Trade what the market gives, not what your ego wants."
Stay mechanical. Stay focused. Let the probabilities work.
FX:USDJPY

USDJPY | H4 Bullish bounce offBased on the H4 chart analysis, the price is falling towards the buy entry, which is an overlap support that aligns with the 61.8% Fibonacci retracement and could bounce from this level and rise higher.
Buy entry is at 147.08, which is an overlap support that lines up with the 61.8% Fibonacci retracement.
Stop loss is at 145.82, which is a multi-swing low support.
Take profit is at 148.72, which is pullback resistance.
High Risk Investment Warning
Trading Forex/CFDs on margin carries a high level of risk and may not be suitable for all investors. Leverage can work against you.
Stratos Markets Limited (tradu.com ):
CFDs are complex instruments and come with a high risk of losing money rapidly due to leverage. 65% of retail investor accounts lose money when trading CFDs with this provider. You should consider whether you understand how CFDs work and whether you can afford to take the high risk of losing your money.
Stratos Europe Ltd (tradu.com):
CFDs are complex instruments and come with a high risk of losing money rapidly due to leverage. 66% of retail investor accounts lose money when trading CFDs with this provider. You should consider whether you understand how CFDs work and whether you can afford to take the high risk of losing your money.
Stratos Global LLC (tradu.com ):
Losses can exceed deposits.
Please be advised that the information presented on TradingView is provided to Tradu (‘Company’, ‘we’) by a third-party provider (‘TFA Global Pte Ltd’). Please be reminded that you are solely responsible for the trading decisions on your account. There is a very high degree of risk involved in trading. Any information and/or content is intended entirely for research, educational and informational purposes only and does not constitute investment or consultation advice or investment strategy. The information is not tailored to the investment needs of any specific person and therefore does not involve a consideration of any of the investment objectives, financial situation or needs of any viewer that may receive it. Kindly also note that past performance is not a reliable indicator of future results. Actual results may differ materially from those anticipated in forward-looking or past performance statements. We assume no liability as to the accuracy or completeness of any of the information and/or content provided herein and the Company cannot be held responsible for any omission, mistake nor for any loss or damage including without limitation to any loss of profit which may arise from reliance on any information supplied by TFA Global Pte Ltd.
The speaker(s) is neither an employee, agent nor representative of Tradu and is therefore acting independently. The opinions given are their own, constitute general market commentary, and do not constitute the opinion or advice of Tradu or any form of personal or investment advice. Tradu neither endorses nor guarantees offerings of third-party speakers, nor is Tradu responsible for the content, veracity or opinions of third-party speakers, presenters or participants.

Key Observations 1. Rectangle + Double Top (“Top 2”) Formation (left side):
• Price ranged between ~147.5 and ~149.5.
• A double top inside the rectangle signaled resistance and potential reversal.
• Breakdown from the rectangle zone occurred, confirming bearish momentum.
2. Rising Wedge Pattern (right side, green zone):
• A bearish pattern forming higher highs and higher lows.
• The red arrow indicates an expected breakdown from the wedge.
3. Bearish Price Projection (blue arrows):
• The chart projects a sharp drop following the wedge breakdown.
• Multiple target levels are marked:
• First Target: ~147.0 zone.
• Final Target: Near 144.0, aligning with the measured move from previous breakdown.
4. Confluence of Bearish Signals:
• Rectangle breakdown + rising wedge.
• Bearish candle rejection near 149 resistance.
• Pattern-based technical targets drawn using past behavior.

USDJPY short movePrice is currently at a support level and if there should be a break then i will be expecting more downward movement in price.


USDJPY SELL OPPORTUNITY Price is tending to drop from the current market price of 147.730 as price breaks a local trend line. From the Technical standpoint , A sell opportunity is envisaged from the current market price. Also, we saw USD weakness across the board. Our Target profit is 146.970
