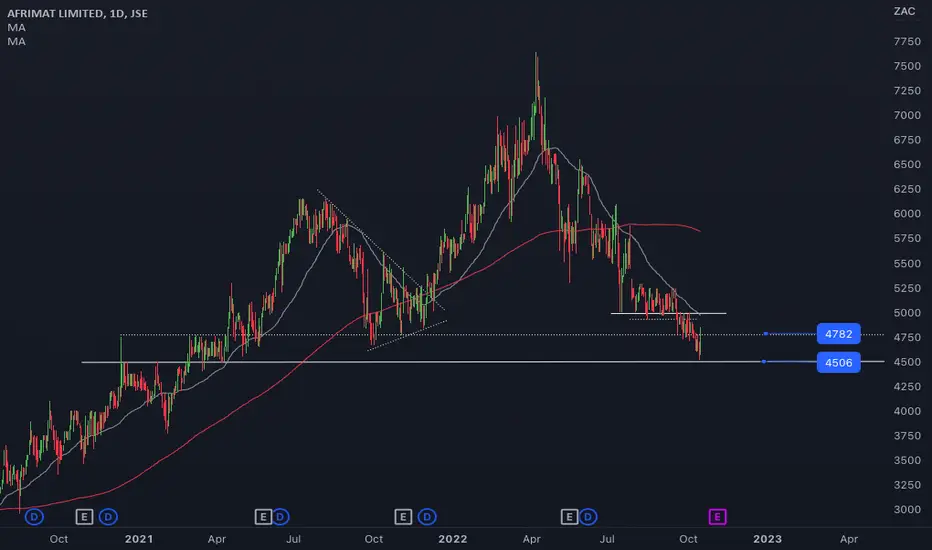
$JSEAFT - Afrimat Ltd: Stock Fades Weak Trading UpdateAfrimat has held steadily above the critical level of 4366 as per my previous analysis, link below.
On Tuesday 18 April, Afrimat released a voluntary trading update for the FYE'2023 and cautioned that:
EPS is expected to be between 448.6 cents and 476.6 cents, representing a decrease of between 15% and 20% and
HEPS is expected to be between 445.2 cents and 472.3 cents, representing a decrease of between 13% and 18%.
The stock closed the day 3% down but yesterday was up 4.12% and looks to be building upside momentum.
The near-term critical level to watch is 4650 and can be used as a stop-loss level for aggressive traders but 4366 remains the invalidation level for the bullish continuation outlook.
AFT trade ideas

AFRIMAT - ObservationI will be cautious to the long side until bulls reclaim R50-R52 zone else the risk of big R42-45 level remains high.
Failure here triggers a very bearish head & shoulders pattern.
Alternatively, a larger symmetrical triangle could develop on this market favourite.

$JSEAFT - Afrimat: Can Bulls Defend 4366?Afrimat had a good run after the update I did on the 13th of December 2022, link below.
For a company that has recently been classified under General Mining on the JSE, we know how cyclical commodity stocks can be so it's good to take profit and update charts regularly.
The move from 4366 to 6066 is labelled as a five wave advance.
The correction from 6066 has thus far unfolded in three waves, as to be expected, but it is too early to call a bottom.
For the bullish sequence to remain valid, the bulls will have to defend 4366.
FY2023 ended at the end of February so be on the lookout for trading updates and statements.


Afrimat retesting Cup and Handle - Target R68.55 7>21 SMA - Bullish
Price >200SMA - Bullish - Green background
Cup and Handle has formed and the price has recently retested the Brim Level.
RSI >50 (Green background) - and is showing higher lows - Bullish
First target is R68.55
This also is showing upside as the local resource market continues to move up in 2023.
General Info
Afrimat is an acronym for "African Material Supplies", which is where the company got its name from. The name is reflective of the company's focus on providing industrial minerals and construction materials to customers throughout Africa.
It specialises in mining and supply of industrial minerals, including construction materials such as aggregate, sand, and granite. It operates in certain places in South Africa like Western and Eastern Cape, KwaZulu-Natal, and the Free State.

$JSEAFT - Afrimat Ltd: Technicals Are Screaming Buy!The last time I covered Afrimat was on October 13 when the share was still in a strong downtrend and approaching a significant trendline.
At that stage, I was neutral and called for patience and wait for the right signals, I believe we have enough signals now to go long.
The share has broken out of a falling wedge pattern, there is strong price/MACD convergence and the MACD has broken above the zero-line and is looking bullish.
buy: @ market
stop-loss: aggressive @ 4555 zac
conservative @ 4366 zac
Take profit: use own discretion

AFRIMAT falling on the floor Afrimat has formed another unusual and rare breakout pattern - Reverse Inv Cup and Handle.
This is where the handle is on the left and the cup is on the right...
The fact that the price has broken below the brim level and the RSI is making lower highs and is below 50, means there is further downside to come.
Looks like R22.00 is on the cards for the stock.

AfrimatThe share consolidated briefly in a range between R50 - R52, but eventually broke to the downside on further market weakness and weaker iron ore price. Currently testing horizontal support failing which, we could see a quick move towards R42. I would like go see a close above R52 to initiate a long position again.
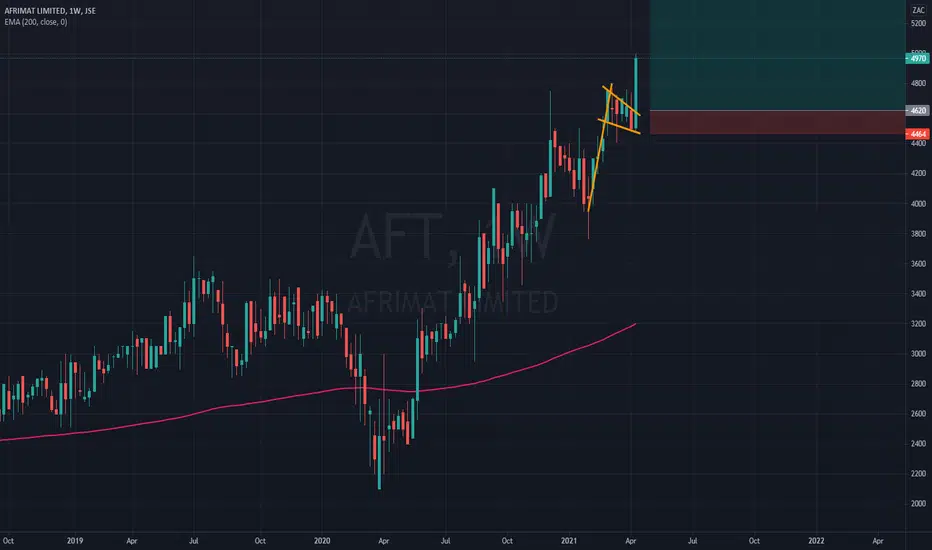
$JSEAFT-Afrimat: Sloping Trendline To The Rescue?Afrimat had a strong run from March 2020 to peak at a new all time high at R76,47.
Afrimat's share price trend is not easy to breakdown using Elliott Wave analysis but good old support, resistance and trendlines might just do.
I am not a fan of sloping trendlines as support and resistance but seeing that this one has four touches makes it a good area of value to look for buying opportunities.
It's all about patience and waiting for the right signals.

Afrimat (AFT): long ideaI am looking at taking this company long at the anticipated levels, this company has been performing well, their acquisitions have been outstanding and i love them.


AfrimatMy Predicted retracement is complete, looking forward to the upside from here
LONG-TERM INVESTMENT IDEAS
#NotFinancialAdvice
#DYOR


AFRIMAT - 200 Day Moving Average- Afrimat pulled back to the 200 day moving average
- Great area to accumulate more stock or open a position if you believe the trend will continue. (Trend is your friend)
- Oscillators are also oversold
-- MANAGE YOUR RISK - -
Disclaimer: All ideas are my opinion and should not be taken as financial advice.

AFRIMAT -- SOLID UPTREND - Afrimat continues to perform well and this is reflected in the solid uptrend of the chart
- Nothing else to do but add to position on any pullbacks
- Recent breakout is very bullish and targets R54.10
-- MANAGE YOUR RISK - -
Disclaimer: All ideas are my opinion and should not be taken as financial advice.

Afrimat analysisAfrimat was able to break a significant resistance with good bullish force. In my personal opinion buying high prices is not a good idea even if one is only investing and not trading the stock, a good entry strategy is to allow the market to confirm that broken resistance by turning it into support , then i would pick up some shares

Long idea on $AFTAFT has been in this strong uptrend for an extended period. Nice bull flag here in AFT. There have been a number of great buying opportunities with the pullbacks in this ticker. I am long while bullish sentiment remains in our market.
AFT - 1D - OVERBOUGHTAfrimat is overbought at this stage, and i will wait for Fibonaci retrace, trendline and 200 MA to converge before entering a trade. Fundamentally i think Afrimat has a lot of upward potential, but is going to give us a breather first

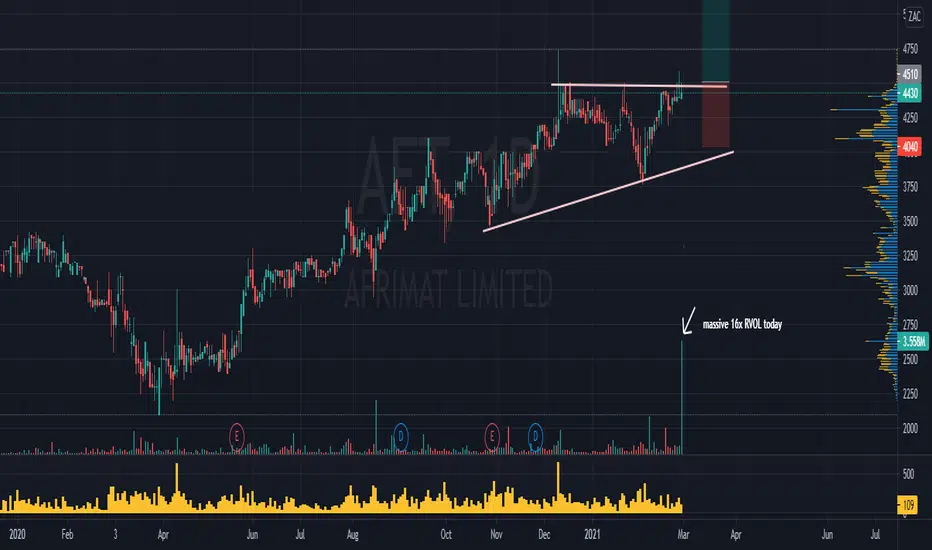
AFT Daily, massive 16x RVOL AFT did a massive 16x RVOL today,
Expecting a breakout to follow in the coming days
JSE:AFT Afrimat DistributionIt looks like Afrimat is being distributed. Following the Wyckoff logic, we have likely seen an upthrust of distribution (UTAD), a test to the UTAD and am now looking for the markdown in phase D. The distribution started after a throw over of the overbought line forming a buying climax (BC), automatic reaction (AR), secondary test (ST) in phase A. Some volume of the highs and divergence on the volume RSI gives some indication that this is distribution. Looking for a break of the upward stride to go short.

AFT250-day moving average @ R29.50 could provide support. RSI now at oversold levels. Afrimat should report its interim results in October/November.

$JSEAFT Bigger pictureLooking at a long term short opportunity
- Currently seeing retest of long term trendline
- .786 fib retracement level reached
- rising wedge forming as well
