APN - Possible Weekly Reversal We may derive the following from the Weekly APN chart:
1. Price has been on a rapid decline.
2. We are therefore looking for potential buy opportunities.
3. If we price breaks the red resistance line, we may consider a small buy.
4. As always - maintain your risk. Especially considering the massive downtrend APN is in.
Note: The views provided herein do not constitute financial advice.
APN trade ideas

Aspen - Time to build a solid position The Aspen share price has set a solid base around the R 100.00 levels.
I'm getting excited about the futures price prospects and anticipate a strong recovery toward R 120.00
Furthermore, the stochastic's confirms my view of a strong recovery!
Time to build a solid position

$JSEAPN Aspen. ConsolidatingAspen is consolidating in a 11300, 9100 range. Buy the bottom, sell the top, till it breaks.

JSE:APN | Testing 9000 floorPrice has made its way down from the monthly highs near 11300 and is a trading just above the lows we saw in mid-April.
Given the strong downtrend that this share finds itself in, we have no reason to look for longs as yet - only a close above 11300 would interest this trader in a counter-trend buy.
I'd like to see a close below 8860 - this would open the way up for a retest of the early March dip down to 7000.

ASPEN PHARMACARE (APN) DAILY TIMERAME BUYI am expecting a bullish momentum as we complete a correction pattern, before further downside. Targets should be at the top of the flag pattern and position size small, as we are in a downtrend.

#JSEAPN Aspen Flat top triangle in the makingWatch for a break of 11050. Once that resistance level is broken it will open the path to targets 12700, 13650. Take consideration of current weak market conditions in determining position size.

Looks set for next move higher RSI divergence, flattening 50day, trading above 50day = bullish. R169 target

We excited about Aspen Aspen time to go long !
After the sell-off early October 2018, Aspen’s share price has been building a sold base for several months.
Most recently the R 140.00- R 145.00 base is in play…
I'm loving the positive momentum and a move towards R 200.00 is sensible ...go go go go !

There goes Aspen!Price breaking below the critical R140 support area on the 4 hour chart.
More downside? I bet so, especially if we close below that R140 area.


$JSE-APNJSE:APN
After big drop it consolidates in down sloping channel. Tested top of the channel late in January.
Support at 13800. If it breaks bellow it will probably go and back test bottom of the channel that is currently around 11500/12000 area.

Aspen Pharmacare - Bull Flag Build-UpThe technical setup and trading action for Aspen Pharmacare is signaling that it is willing to make further price advances. Yesterday, we received additional confirmation of this as the share traded in the low R140s before closing the session at 146.20 (+1.18%). The R139 to R141 level has been a fairly strong support zone while the share is also currently making another attempt to regain it's 50-day moving (MA). This MA is starting to stabilize on the downside, signaling a slowdown of the bearish momentum and a potential for a medium bullish move. We also note the formation of a bull flag pattern - where the share is currently breaking to the upside. On an intraday basis we may see the price make small pullbacks toward the 144/143 level however traders should monitor these zones to determine whether there is strong buying support. In addition, the short term 20-day moving average is also being challenged which could add to the short and medium term bull case. On the upside, the targets are R152 and R157 (top of bull flag) while R163 could be reached should the aforementioned levels be eclipsed. On the downside, a stop-loss of R137.70 must be applied. Preferred accumulation levels: R144.30/144.80.
JSE:APN

$JSEAPN LONGLooking at a retracement range between the following 2 values:
- .618 fib retracement
- 1:1 extension of a-b to b-c (C = length of A)
Potential long opportunity when those ranges are met.


$JSEAPN Neckline retest after inverted head and shoulders breakNeckline retest after inverted head and shoulders break. Hope it holds. Stick to stop losses if it doesn't.

Are ASPEN's Woes Nearly Over?Aspen is a global supplier and manufacturer of branded and generic pharmaceutical products as well as infant nutritionals and consumer healthcare products in selected territories.
ASPEN has been under the microscope over the past few years with various negative rumors and investigations driving the share price lower and lower. I believe that we haven't quite seen the bottom yet but that there is a possibility of strength to come soon. Perhaps a take over is what they need?
Technicals
The corrective structure has seen a break of the 61.8% Fib retracement level and is currently trading below it. I am expecting to see wave 3 end at the 78.6% level. In my opinion, it is likely that there will be a rally from that point onwards and that the structure will break to the upside. A larger retracement than that would indicate serious repercussions for ASPEN and I am certain that they will do everything in their power to avert a further decline in share price.

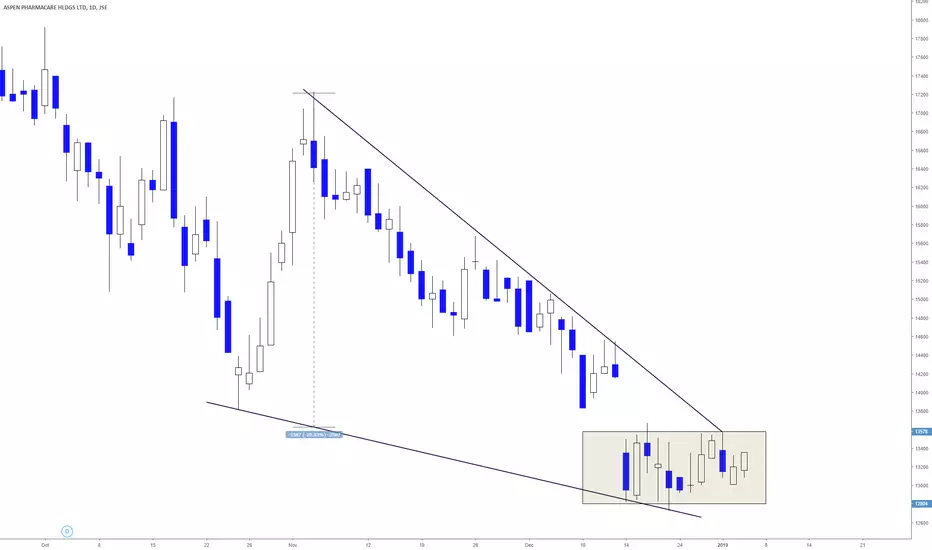
$JSEAPNJSE:APN
Broke falling wedge few days ago as well as sideways consolidation.
Back tested breakout point and made solid support at 13700/50 area.
So far hourly making big engulfing bar.
Trade idea long around this level on bar close (if it stays the same)
SL=13600
FT=15700 for RR=2.29
ST=17000 for RR=4.52

Aspen : Bullish price action Aspen had an incredibly difficult 2018, with the stock losing over half of its value in only a few months.
The sale of Aspen’s infant milk business (a price below market expectations) together with the elevated debt levels are seen as major catalysts leading to the decline in Aspen’s share price from R 260.00 to below R 130.00.
Reviewing the time series, we note signs of positive momentum indicators, this after building a solid base around the R 132.00 / R 135.00 levels.
Stock is starting to re-act to most recent broker upgrades and can possibly recover to the R 200.00 - R 220.00 over the medium term.
One to watch!

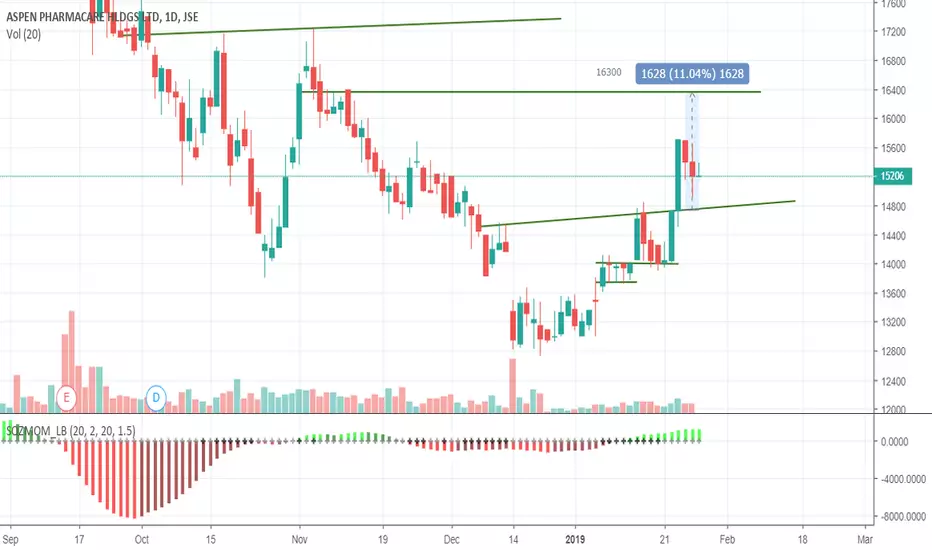
Nice run by $JSEAPN, but up against some resistance nowThis could the the start of a right shoulder of an inverted head and shoulders with a 16300 price target. I would wait for the neckline break.

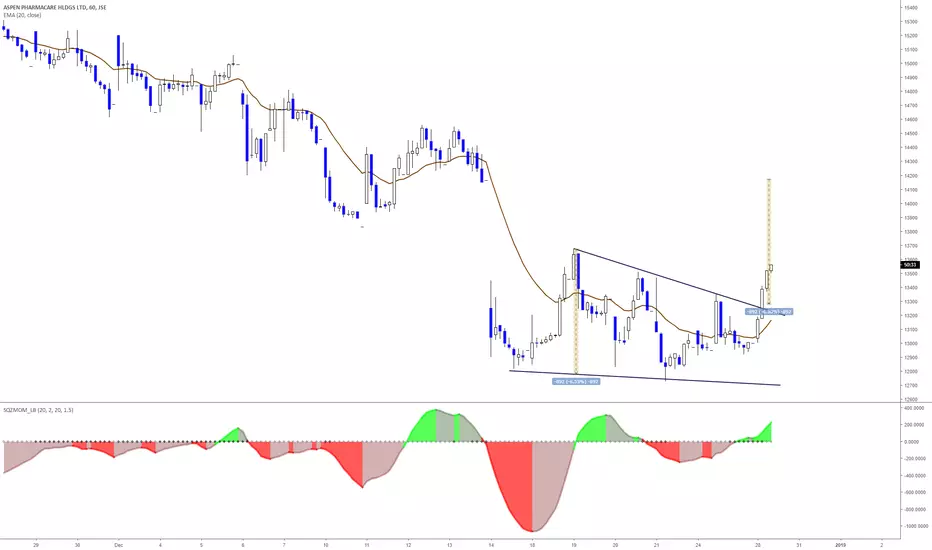
$JSEAPNJSE:APN
Making falling wedge but after last gap down consolidates in the box.
Break of the box can be traded
APN - Double BottomJSE:APN has formed a bullish harami on a double bottom which means it should be good for a long position.
