APN trade ideas


Supply and Demand Based Technical analysis on Aspen PharmaThe Stock has begun a bullish trend post entering a Major Demand Zone! Secondly its been announced as as the Pharma to Produce the Vaccine..

JSE:APN Aspen still looking for a test of R200Aspen has been in a downtrend but after going oversold (see below) we have been following the recovery to the top of the channel. Some negative divergence points toward a continuation of the smaller uptrend that has been formed.

APN | JSE - ASPEN PHARMACARE HLDGS LTDCup & Handle forming on ASPEN PHARMACARE HLDGS LTD. Potential long

Aspen trade plan long termAspen looking very promising. Before the great news published today Aspen has had very good steady recovery over the months making this a good stock to hold long term. It’s currently met resistance at R 155 but off the foot of the coved breakthrough there’s a good chance we will have another very positive open tomorrow. If we open at a negative we can expect a rebound not so far from current price at R 150.

APNThis chart forms part of a larger research note. None of the information posted here (TV) should be considered financial advice.
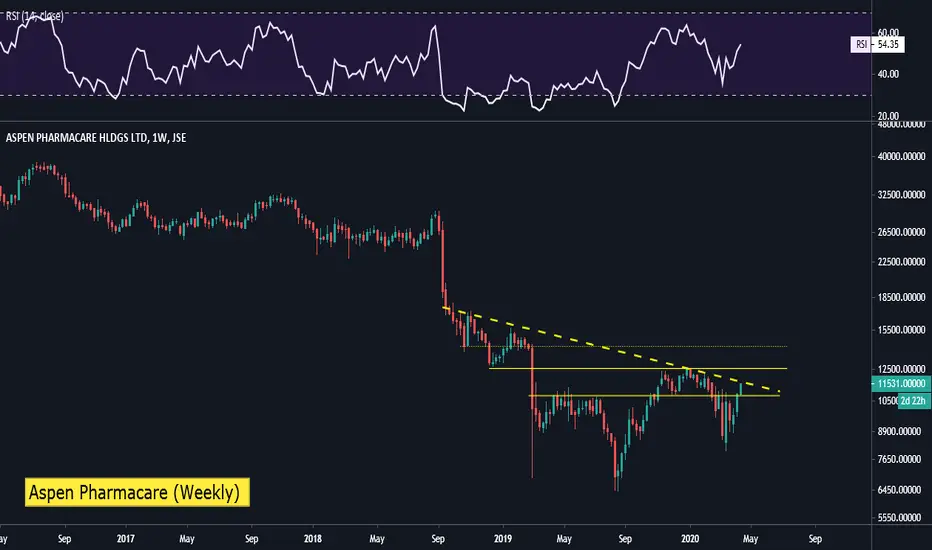
Our last long on APN was at 11400c. The price ran up into 15511c and has since breached the incline support. Now below the 8-EMA, I’m expecting some continued short term pressure. My model says medium term and long term strength, so instead of suggesting a ‘sell/short’ I’d wait for a pullback into 12000c-12300c for a fresh accumulation. This is another ‘breakdown and back-test’ chat play. Short term money flow is declining while RSI is rolling over.

Aspen close to breakoutUpdate from 20 May Aspen post, I indicated that Aspen looks enticing for a further move higher. My view remains. Today Aspen closed above the 20 MA on current resistance of +/-14060. It probably will first move lower tomorrow to support before attempting to break resistance early next week. This is key resistance of the neckline of an inverse head and shoulder formation that started on 7 March.
Target 1 : 15733 | Target 2 : 17219
Stop at 12300.
Longer term target should share trade above 50 day EMA , possibly 28063. Nice gap fill from Target 2.
Disclaimer: My analysis should not be construed as financial advise. Share trading is risky and unpredictable at best. I'm just sharing what I see.

JSE:APN Aspen at Important PointAspen is at an important decision point. It is a level of previous volume at R140 where selling occurred. We have been following the stock signs of strength (see posts below). The relative strength is good and volume is increasing as price increases. However, the volume push is declining. The stock still looks strong but we may see a pause at this level. However, a clean break could result in a quick move higher.

Aspen enticing long for longer term?Aspen (APN) met some resistance at 14075 the past 3 sessions. Breaking this resistance, I will be looking at entry between 14500 and 15000.
Target 1 : 15733 | Target 2 : 17219
Stop at 12300.
Longer term target should share trade above 50 day EMA, possibly 28063. Nice gap fill from Target 2.
Disclaimer: My analysis should not be construed as financial advise. Share trading is risky and unpredictable at best. I'm just sharing what I see.

JSE:APN Aspen Ready for MarkupAfter a break the trading range and a pullback on declining volume, we are now looking for a markup to start.

JSE:APN Aspen Breaking OutAspen has been showing strength but after a spring and signs of strength (SOS) price is now breaking out.

ASPEN - Up against trendline- Price has recovered from its recent lows of R80
- Its currently consolidating and we have had 2 inside bars that have formed within the range R108.79 - R115.60
- Stochastics overbought
- I will be looking to trade the break of the range, in either direction (daily close) .
-- MANAGE YOUR RISK - -
Disclaimer: All ideas are my opinion and should not be taken as financial advice.
JSE:APN

Technical Flash Note: Aspen Pharmacare APN Technical Flash Note: Aspen Pharmacare APN
For those waiting on the Aspen Pharmacare to make a meaningful move, the wait has been frustrating to say the least. After spending 3 months between mid-November 2019 and mid-February 2020 trading in a tight range between 10800c and 12500c, we saw the share price roll over to take a hit along with the rest of the market as fears of the Coronavirus gripped global markets. From a low of exactly 8000c, we have seen the share price make a recovery to regain the 10800c level - one that has acted as both support and resistance over the medium term.
Adopting a longer term horizon, the price looks poised to break out of a sideways to downward trending base and above the downward trend line which has capped upside over the last 18 months. For bulls to remain active, we would like to see 11000c remain support. On a higher time interval, a break and close above 12563c opens the road to 14178c and 15343c. As per the weekly chart, the RSI trading with a bullish bias at a 54 print, which is also pointing higher. A review of the monthly chart also sees a positive development with the RSI breaking the downward trend line resistance going back to January 2015.
Attached: APN Weekly

$JSE-APNJSE:APN
Down 12% today with market been up all day.
Stopped at support around 8500
If that breaks next support is around 6300.
And if cup plays out target is at ZERO.

$JSE-APNJSE:APN
Publishing results after close today. There are small head and shoulders in place with moving averages getting red.
On the other hand it is holding very well today with all selling on our markets.
What is interesting all market action is contained in daily bar on 19 March 2019 and very bad results published.

$JSEAPN Aspen. Watch for a fake break on AspenI will add if we see a fake break today. First we need to see a break of current resistance on a daily close. Will add to current position when we do.

$JSEAPN Aspen. Breaking supportClose below 100 and stop loss will be triggered. You win some, you lose some.

$JSEAPNJSE:APN
Made small head and shoulders with neck line been broken today.
Target around 9200/9300 area.

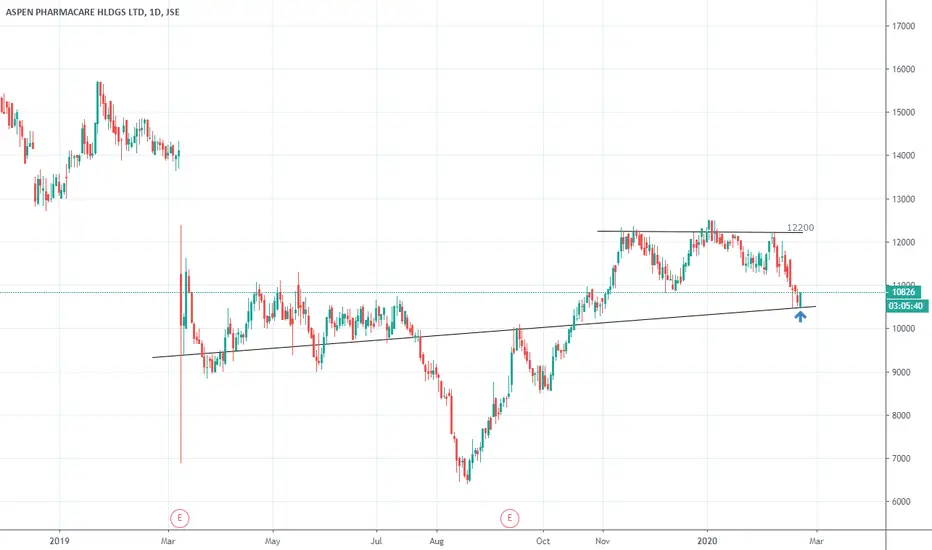
$JSEAPN Aspen. Finding some supportPossible target for this bounce is 12200. Break and daily close below support line will trigger a stop loss.
AspenWas previously bullish this stock; but it looks to be developing a bearish triple top pattern, which will be confirmed by a break of the R109/R110 support area.
Measured target around R96.
