Bidcorp - Area of InterestBidcorp has been one of the stronger names on our market with the target 1 zone being reached (R408) since we took the breakout at R336 .
Price is up against strong resistance here and so we will likely see some consolidation or a deeper pullback to the 50dma. If bulls are able to push R408, one can target R450.
BID trade ideas

$JSEBID - BID Corp: Finally Catches A Bid And Then Some...Bidcorp stock has been underwhelming since listing, generally moving sideways in choppy fashion and as a result has not been in my watchlist, until now.
From September 2022, the share price started to rally in an impulsive manner and on the 1st of February 2023 released a positive trading statement expecting HEPS and EPS to increase between 43% to 49%.
The market loved the news and the share continued its rally.
What is clear from an Elliott Wave point of view though is that from the September 2022 low of 27500 zac, the stock has traced a five wave impulse and is therefore due a pullback in three waves.
With the release of its results for the half year ended December 31st 2022 on or about February 22nd 2023, I will sit on my hands and not chase momentum until i see a clear three wave pullback before joining the bulls.

BIDCORP: ShhortFirst of all...How does this price even make sense? But besides that, we now have a bearish reversal candle (long upper tail, failed high) at over-bought levels as well as a potential double top scenario. We may be betting against the trend here (which we are) but surely sanity must prevail. I am of the opinion that we are beginning to see the start of some profit taking and I wouldn't be surprised if we saw a retracement to at least 330.00 where it was just the other day (27th December). We have shorted today's close and looking to make about R19.00 on the trade.

Bidcorporation still in the Twilight-zoneIt definitely can seem tempting to buy (go long) a stock like Bidcorp as by theory it's broken above the Cup and Handle pattern and the moving averages look great 7>21 >200.
However, it's also good to look at the broader picture of price action. Bidcorp has been moving in a sideways rectangle formation since February 2021...
I think only above R30.00 will give me some semblance of hope of a new bull run... Until then, I'm hesitant to go long.

BID - ShortA bearish harami formed on JSE:BID two days ago. It came very close to triggering our order yesterday, but just missed it. Once triggered, we aim for a target at the 27800 support area.

BID Trade Idea UpdateBID Corp - Trade Idea Update (Buy/Long, 03 October - see attached)
Now trading +15% (ungeared) with massive upside follow-through on the back of this morning's capital markets trading update.
Going forward, two levels to monitor:
1. The 61.8% FIB - thus far, the market has pushed the price through this zone.
2. Approaching 2x standard deviation over 200 days (upper boundary). This is around 32700c-33000c.
Initial buy was at 2x to 2.5x std deviation on the downside
If still long, one could use the strength to bank/take profit.

BID - LongIt has taken a while, but finally all 3 of the indicators have crossed on JSE:BID . We are looking to ride the move upwards all the way up to the resistance level at around 319.

BIDPotential setup depending on subsequent price action. See chart. Near oversold and trading more than 2x standard deviation over 200 days.
Additional notes on chart.

BID - ShortWe have entered a short on JSE:BID based on the downward crossing of the Stochastic, MACD and now the two EMA's.

BID Corporation - LongJSE:BID has broken out of a sideways consolidation that it has been trading in since mid June. If it continues upwards, I will enter a long position.

BID Corp– Rising wedge formation
– Breaking below monthly and quarterly pivots
– Breaking below 8 21 50 EMAs (all of which are starting to turn lower).
– Sell on rebounds into the 31400c to 31800c range or on a breach of the trend line at higher levels
– Stop-loss: 32530c
– Target: 29000c
– Current: ~31200c

BIDCORP - Observation Weekly- Bidcorp is trading within a broadening formation and sideways consolidation
- Price is still well off the covid lows / PE:27.4 / Dividend Yield 2.2%
-No real longer term trade setup here until a key level breaks below R303 or above R336
-- MANAGE YOUR RISK - -
Disclaimer: All ideas are my opinion and should not be taken as financial advice.

BID: downside potential?Crossed below its 200-day simple moving average.
Below 32100 supports a bearish trend direction. Crossing above this level will negate the bearish stance.
Fading upside price momentum also supports a bearish trend direction.
RSI leaves enough room for further downside price potential.
Trend strength also indicates a weak likelihood that a trend might be developing.


BID - Long on Momentum StrategyAll 3 momentum indicators have crossed on JSE:BID - looking good for a long position.

Bid CorpBid Corp (31958c) - Potential re-entry. 3 Technical Factors Required To Set Up A Swing Buy/Long.
1. Needs to hold incline support with strong candle structure.
2. Clear and hold R320.
3. Clear the downward trend line extending back to the peak of 34399c on 19 October.
Temporary failure below 31470c

BID CORP.Attempting to break resistance for a possible move higher!
JP Morgan calling it a 385 stock this morning.


BIDCORP - Swing Idea- Chart is setting up a bull flag on the daily and is in a constructive uptrend
- Looking for a move to test the swing high and a possible breakout to the upside
-- MANAGE YOUR RISK - -
Disclaimer: All ideas are my opinion and should not be taken as financial advice.

BID CorpAn extract from my research note for Monday, 26 July.
Bid Corp (BID, 31702c)| At the top of last week we highlighted the 50-day EMA as a provisional buying zone, which was tested and held for 1300c upside (Monday through Thursday). As the price continues to recover, we think the 31989-32321c (the 50/61.8% FIB) level offers an area to re-sell on the expectation that the downward trend line continues in the short term.

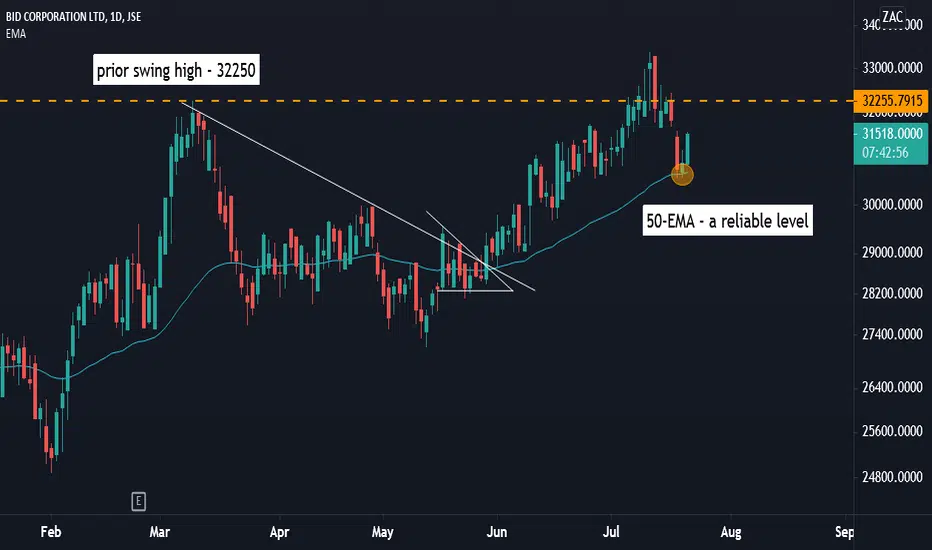
BID Corp: A +900c Cash Flow TradeDid you manage to get your hands on some BID Corp? My pre-market plan (published on Sunday 18/07) highlighted BID as a buy at the 50-EMA, with comment as follows:
Bid Corp (BID, 31833c) | Coming into last week we considered the potential for an overshoot followed by a retracement. The share has since retraced moderately, with the 8-EMA losing upside momentum while the 21-EMA continues to trend higher (minor support). The candle structure is weakening however we consider the 50-EMA (now ~30648c) as a provisional ‘next accumulation zone’. This is also in line with the 50% Fibonacci Retracement.
On Monday & Tuesday we saw the share rebound off this level, withe follow-through on Wednesday to above 31500c for a +900c gain.
Note, the price also exceeded our most recent short target range of 313-316.
Our clients have access to these and other opportunities. Get in touch today.
BID possible shortWith today's price action so far, JSE:BID seems to be showing some good downward momentum. Based off of the EMA's crossing today as well as the stochastic and MACD moving downwards it looks like a downward move is on the cards. I predict that it could move down to the 28000 support level which would coincide with the support level around the 200SMA.

BID CorpProvisional plan going into next week.
The share has surpassed our buy/long target range of 31200c to 32000c from the suggested entry of 29300c, having tested it's highest level since February 2020. While the price remains in an active sequence above a rising 8 and 21 day EMA, the 7-day RSI is strong but nearing 'near overbought' territory. Having advanced from a low of 27169c on 13 May to Friday's high, we question whether the short term trend is becoming overextended and whether there is an opportunity for tactical short sellers to generate cash flow? Consider the following (only applicable early in next week): the share may trade above Friday's high however, if the high does not hold then it may create a tactical short/sell down to the 31300c/31600c range.
It may continue higher so I'll be monitoring in real-time (for clients) for the best entry (no 'short' tag added to this idea as yet).
Price at time of publication: 32743c
