BVTClear seller at 21950-22100c. I mentioned this level on the group on 02 June (at the 1st red arrow), which has been a range to sell into for ST cash flow. Today, we are also seeing the price slicing through the EMA's with force. Should the share break and close below 21050c, it could trade 19800-20000c. Upside risk above 22240c.
BVT trade ideas

Bidvest - shortJSE:BVT is looking good for a short position. I will enter if it continues down today.

Short on BVTAn evening star pattern formed late last week on JSE:BVT . This is a top reversal sign which means we could see a downward move. Today's price movement so far is confirming this downward turn.

JSE:BVT Possible Long opps Price breaking out above SR level at 22400. Tertiary trend is up. Decent spot to acquire risk here. Manage your risk

Bidvest LTDA zigzag correction has been completed on this stock and is set to rise further as wave 3 is in motion.

Bidvest breakout level retestIt seems like JSE:BVT has pulled back to the breakout level. Wait for a follow through, or pull a trigger here?

Bidvest. Further Update: Now Trading +3000cFurther update
Intraday, the strong move has continued, with the price now up +3000c or +15% from our level (19000c to 22000c).
For more real-time insights and trade ideas, or if you're considering an alternative trading services provider, get in touch today.
Original idea and 1st update attached.

BVT looking better.BVT breaking the downtrend resistance and also making some higher lows.
A break above R195 can be bullish and first target can be R200 and second target R205.
Keep in mind BVT can release an earnings report soon.
Trade ideas are my own and not financial advice.

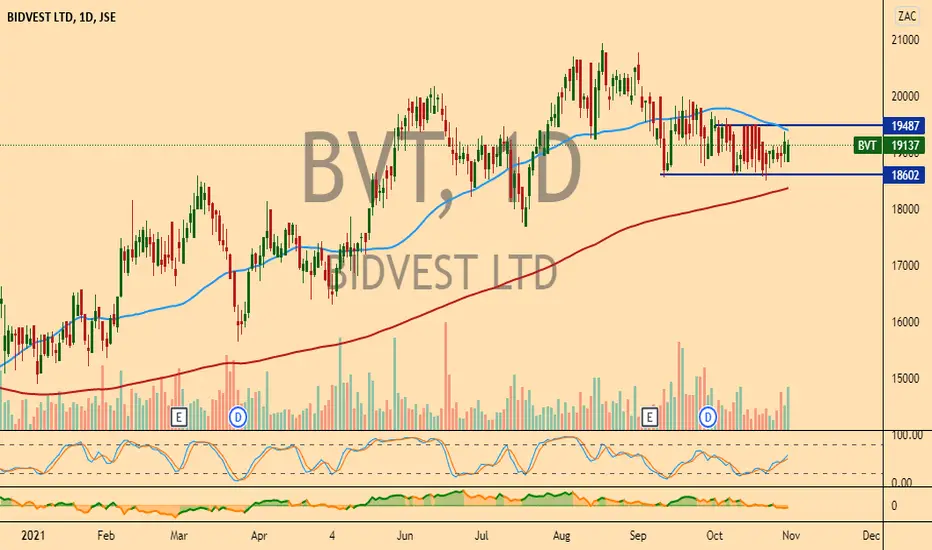
Bidvest's Descending Trend Line On WatchAn extract from this morning's pre-market client commentary:
"Bidvest (BVT, 19004c) | The share printed a impressive/strong reversal candle which saw the pivot being held. I continue to highlight the descending channel in place since the peak on 18 August 2021. What we need to see now is the strong candle structure being sustained and eventually the descending trend line being cleared to trigger a buy/long."

BVT: further downside potential?Starting to break key support.
Bearish trend is applicable below 19500.
Downside price momentum supports the bearish trend direction.
The price action might test its 200-day simple moving average - might act as major support.
MACD bearish crossover is also applicable - see the lower panel.

BIDVEST - Long Idea #theStrat- Break of last week's high R188.13 will open a long trade targeting R195.57 (TP1) and then R200.58 (TP2)
- Below R180.40 breaks the weekly candle to the downside and negates the trade. Better risk/reward entries can be found intraday if your bias is to the long
side with the opportunity to add when to a position once the weekly high is broken.
-- MANAGE YOUR RISK - -
Disclaimer: All ideas are my opinion and should not be taken as financial advice.

BVT rangeBVT trading in a small range between R186 and R195. Preference will be on the long side. A close above R195 can target R200.
Trade ideas are my own and not financial advice.
LONG IDEA ON BVTPrice has formed a bull flag setup and has found a level of support at 18600 and bounced. It would be nice to see a bounce with some higher volumes for a higher probability outcome but such as it is the LT trend is up. If you use indicators then the MACD and Stochastic have just made bullish crossovers.The trend is your friend. Always manage your risk

bidvestR292.52 VERY POSSIBLE
I have three situations.
an expensive one
a cheaper one
then the best cheapest one with greater reward and risk

BIDVEST - Upward Channel with Upward MomentumJSE:BVT has been trading in a nice upward channel since November last year. It is currently trading just below the middle of the channel and seems to be on its way up. It is also showing some good signs of upward momentum based on the stochastic, MACD and the two EMAs that are crossing based on today's price action so far. If the momentum continues, I think we could see a move up to the top of the channel which also coincides with the strong resistance level at around the 22000 level.

Update: BidvestIn recent months, 2 out of 3 for this name.
Short Idea Update: We saw the price drop 400c following the publication however has since continued higher. Now trading close to the stop-loss and still looking strong. If you took it, you could close here as the stop is most likely going to be tested.
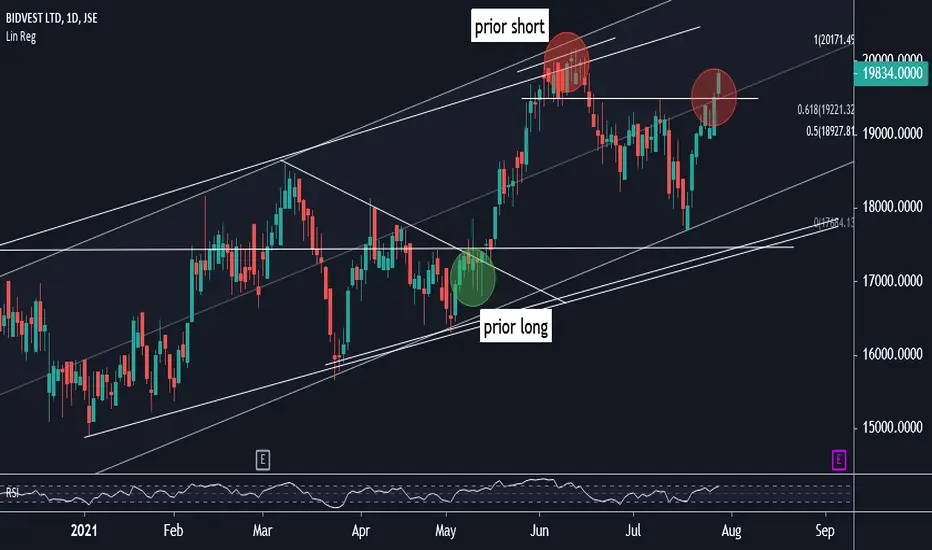
Trade Setup: BidvestOver the last few months, Bidvest has been a profitable counter, benefiting clients on both the long and short side (see related). Today, we consider another sell, with the key drivers as follows:
- Following a rapid move off the lows of week, the price trades in the 50/61.8% Fibonacci retracement zone
- Trades at prior swing high and prior breakdown level, which has acted as a resistance area
Trade Levels:
Sell/Short at current levels (19387c) or higher. Preferred range: 19387c up to 19560c
Stop-loss: 19960c
Target Range: 18400c-18600c

BVT - LongJSE:BVT is sticking with the upward trend and has, once again, made a bounce off the upward trend line. Along with this, the stochastic, MACD and EMAs are all showing signs of upward momentum. I think we could see a move up to the previous resistance level at around the 22000 area.

Bidvest - Target Range Tested. Idea Closed.BVT trading in our target range 18900c/18700c, from the suggested short entry above 19758c. Currently printing 18895c. Would look to close the trade here.
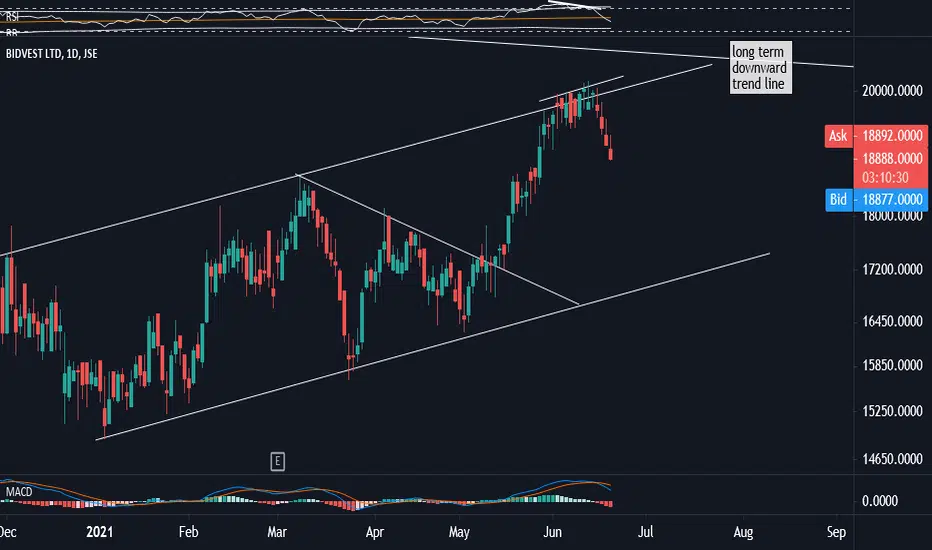
Bidvest LtdOver a period of one month, BVT has performed well for clients who participated, appreciating from 17338c to today's high of 20133 (+16%) - see related.
The current data suggests the share becoming extended to the upside, with the following being noted:
- Price at channel resistance.
- Daily candle thus far failing to holding the highs, developing a reversal candle.
- Negative divergence as per the RSI.
- A pending MACD crossover
In addition, the price trades near the upper boundary of the linear regression channel.
After trading sharply higher since 13 May, the price appears to have little room for extensive upside, and based on the aforementioned technical factors, I am considering a short/sell with the following levels:
Sell/Short at the current levels of 19764c (or higher, up to 19970c)
Stop-loss: 20450c
Target Range: 18900c, down to 18700c
Time Frame: Short Term


Bidvest: Target Exceeded, Close Position. Bidvest: Strong move today. Target Exceeded (high of 19430) . Close your position.
Originally idea attached below.
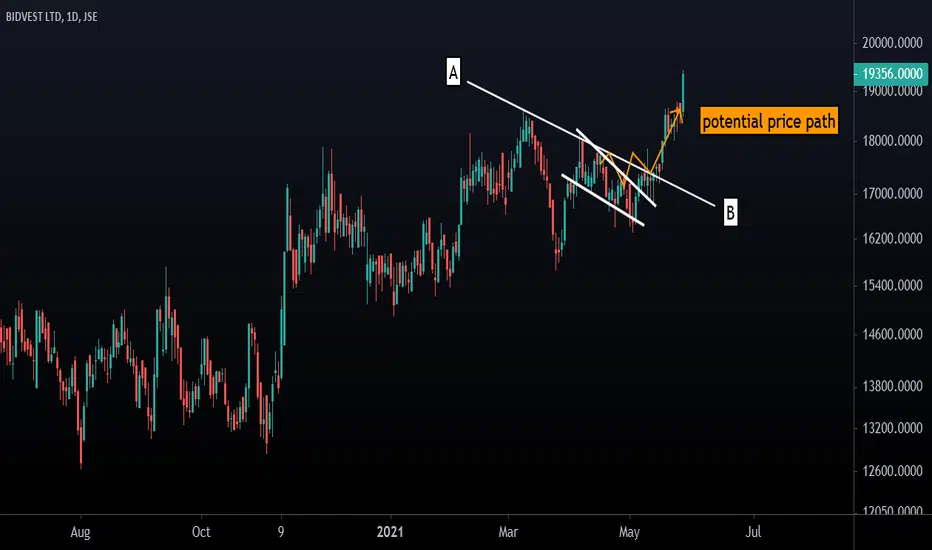
Bidvest - Moving Faster Than Expected- Moving Faster Than Expected
My 'potential price path' (around 12 May) called for a gradual move along the channel before an eventual moving up. Today we closed up 3.27% on elevated volume.
