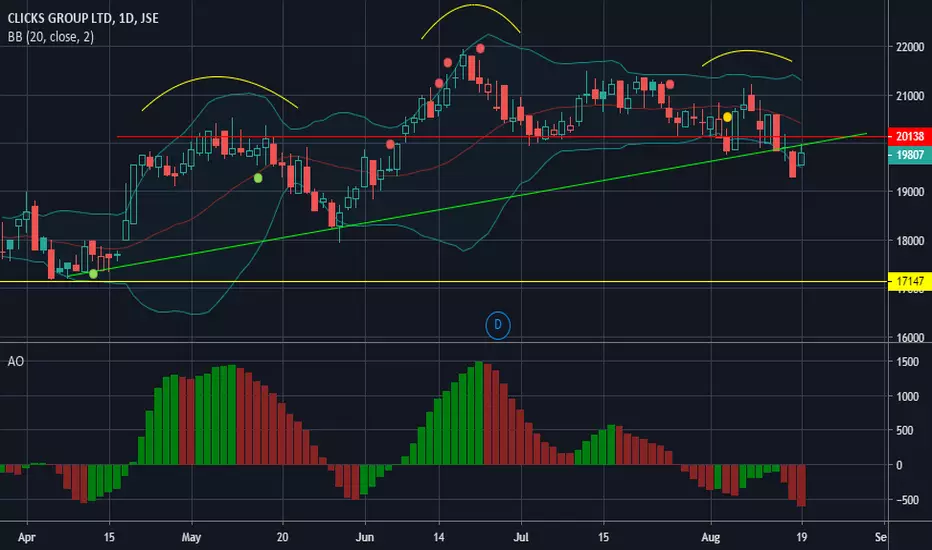
Rain on Clicks Group...We might continue to see rain drops on clicks as it continues to go up and up
CLS trade ideas


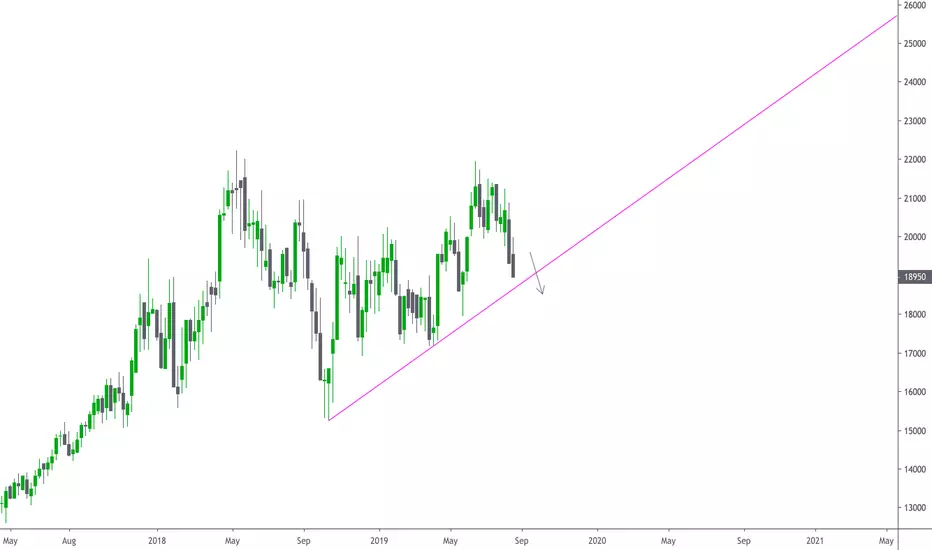
CLS at possible turning pointJSE:CLS is trading at a significant resistance level at the moment. It will most likely not break through this level. The stochastic indicator is looking like a turn downwards is imminent as well.
If this level is broken and a higher high is confirmed, we could continue with the strong momentum in an upward direction.
We will just have to wait and see which direction is chosen

You Could Pay Less At ClicksShort/Sell at current levels 21725c or higher
Stop-loss: 22200c
Take Profit Target: 21000c
Key Technical Drivers: In upward trend for 16 sessions; Trading near resistance; Rand/Oil Price higher which is negative for retailers.


CLS - Downward We may derive the following from the Weekly CLS chart:
1. Price has dropped as previously determined. (See linked idea).
2. Currently anticipating a further break of the support trend (pink line).
3. Monitor price action and watch for further shorting potential.
4. As always - maintain your risk.
Note: The views provided herein do not constitute financial advice.


CLS - Bulls Under PressureWe may derive the following from the Weekly CLS chart:
1. Price formed a double top, but didn't test the ATH.
2. The Weekly bear candles are usually engulfing.
3. Price i.m.o should continue to drop further, with a potential to first test the ATH one more time.
4. As always - maintain your risk.
Note: The views provided herein do not constitute financial advice.

CLS - Bearish EngulfingJSE:CLS formed a bearish engulfing pattern which seems to be playing out. We will wait for a close below the low of the engulfing candle before entering a short position.


Clicks - Possible ReversalJSE:CLS has formed a bearish harami which is a reversal signal. The last harami didnt play out, so I will wait for a confirmation before possibly entering on Monday.


Short ClicksWaiting for the week to end here we looking like distribution
Failure to close above the resistance with declining volume looks like a good short
Better to wait for retest if it breaks down from here
A close above R1 invalidates the trade

$JSE-CLSJSE:CLS
Another big move after results.
Breaking above long consolidation,
FT 20000
ST 20500

CLS-The Clicks Group-Price at incline resistancePrice approaching incline resistance on the Daily Chart chart. I'm bearish at current levels (R191/R192) for a TP target around R180.

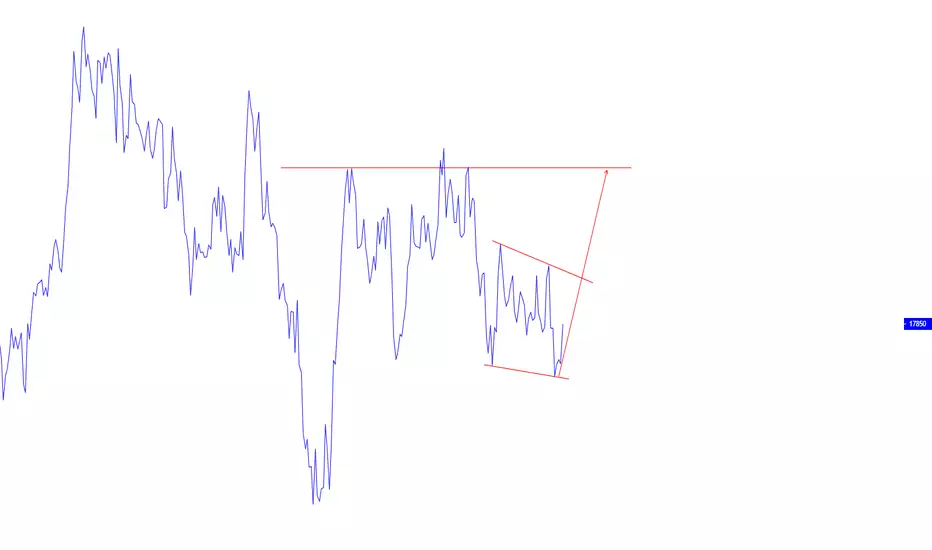
Clicks holding off the bottom of this broadening wedge patternClicks has had a horrible last two days. However, looks like we are starting to base off the bottom of this broadening wedge pattern. Also interesting to note is that volume has started to pick up off this base which would indicate interest by the so called "smart money" and capitulation by the weak hands. Looking for Clicks to close the two higher gaps @ R184.61 and R192.00 respectively.

Technical Trade Idea: Clicks GroupBack in August I became cautious on the valuation of beauty and pharma retailer Clicks, suggesting that it was possible to "pay less". Since then we have seen the price tick lower, with a recent bounce back near the year-to-date highs.
Looking at the bigger picture we may potentially be developing a head and shoulder formation, while the price also approaches an overhead resistance level. At a price-to-earnings ratio of 31 times, CLS remains richly priced in an economic environment that has largely remained stagnant over the medium to long term. On that basis, traders could look to short/sell as the share once again tests elevated levels.
These are the trade levels:
Short/Sell CLS R196.72 (Current) or higher
Stop-loss: R204.00
Take Profit Target: R180.00


CLS - Swing ShortShort for the CLSJ group
Levels:
SL 20140
TP1 19730
TP2 18670
Additional considerations:
TPs flexible based on (a) touch of 50 EMA, uptrend been consistent with that. (b) 24. October earnings. EPS FC ~302 (up 13% from April). (c) keep eyes on peers DCPJ and AIPJ.

CLS Short- going to short
- will close this out before `EOD and/or if price trades above the fib level
