DSY trade ideas

JSE:DSY Discovery Test of Previous Support CompleteFollowing the markdown of Discovery since 2019 (See posts listed below) we have now seen a retest of the previous support now become resistance. We can now expect a test of the lows around R60 and then watch for a further break lower.


$JSEDSY once again battling at its 200dmaKeep an eye on this one- if history repeats, the 200dma which has acted as strong resistance on any snap-back rally should be a very decent level to enter a short position with a fairly tight stop loss.

DSY Discovery Holdings - from my research note (Sunday 10 May 2020)
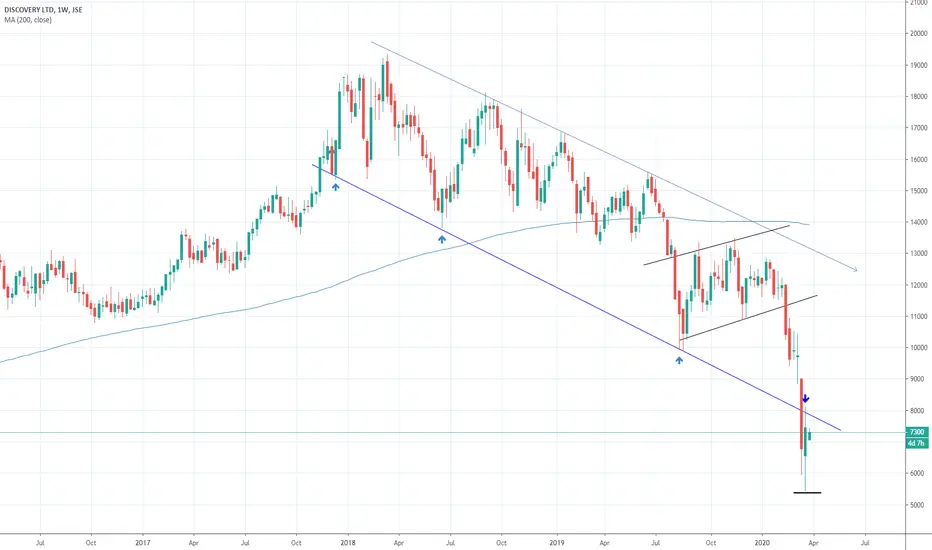
DSY is one of the names we strongly recommended at the 18 – 19 March lows, in which we argued that “Red Equals Opportunity, 18 March 2020′. From 7200c at the time, to 9772 at it’s last close, the share is now approaching three levels of interest: (1) prior breakdown level (2) downward trend line resistance (3) 0.618% Fibonacci retracement. In addition, the share is approaching the ’round number’ R100 which is often a psychological price target. Also keep in mind a push into the downward trend line and failure for the opportunity to potentially get short.


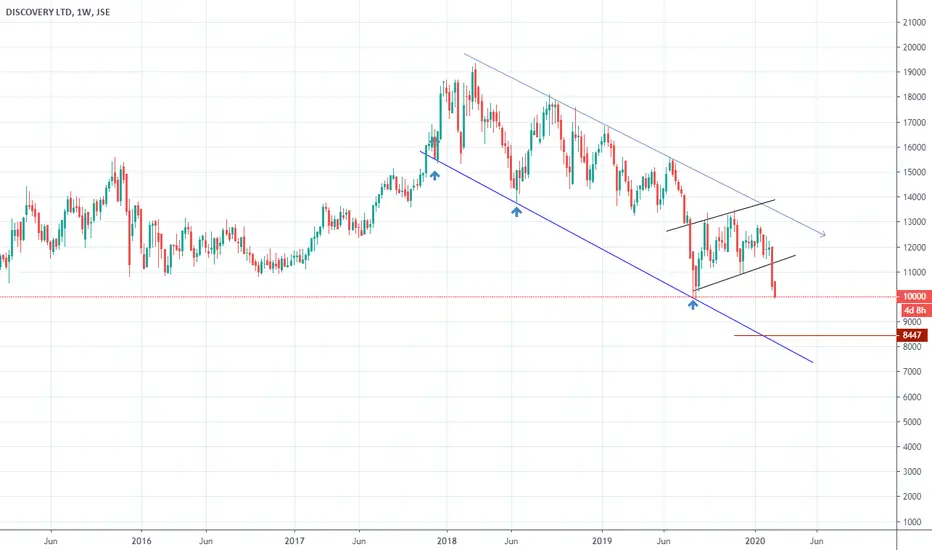
$JSEDSY Discovery. Channel break and retest - ShortDiscovery broke a multi month channel and recently tested the breakout level and held. This one could potentially go down to test the recent lows again - 5400. A break back into the channel will trigger a stop loss.
DSYDiscovery Holdings
Strong rebound off the 5500c lows last week.
Price needs to maintain 7250c as support for short term buyers to remain interested.
As per the monthly chart, the lower highs, followed by the ‘waterfall’ formation sees a share that appears technically damaged over the medium term.
RSI prints 27, which is in the bear zone.
- Please note, the share has been a long time sell from 16100c.

Weekly game plan 8 March 2020 - DSY - requestedWe see a potential bearish break from a rather large range on the weekly chart for DSY. It was very close, but did not trigger at last week's close. Something to keep an eye on the coming week.

Discovery failed to break support levelJSE:DSY has failed to make lower lows on a support level formed in August last year. The Stochastic is confirming a possible change of trend as well, so I will consider entering a long position if confirmed with today's movement.

DISCOVERY LTDBearish impulse complete, looking forward to get in with the buyers as we are on Demand Zone targeting the resistance on top.

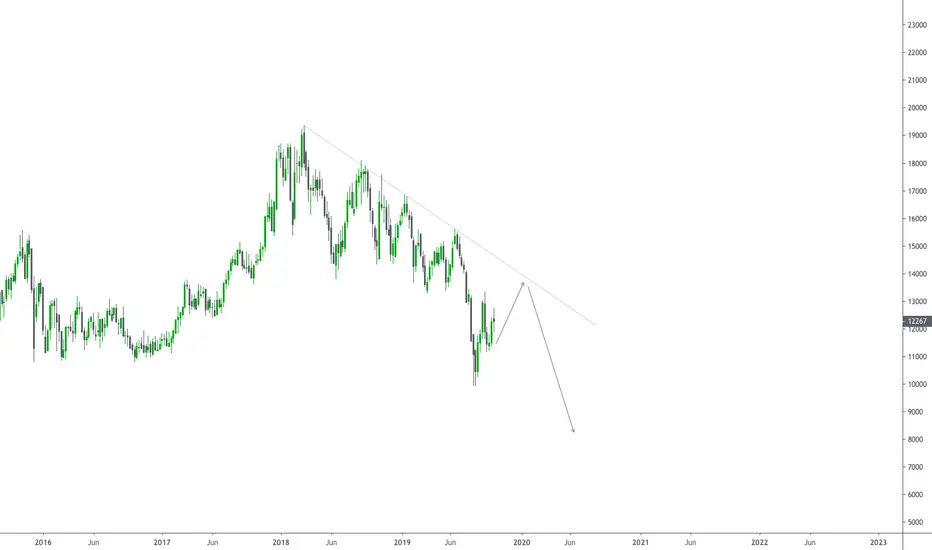
$JSEDSY Discovery. Downtrend to continueDiscovery has been in a clear downtrend since Mar 2018. The weekly chart looks rather bearish and a possible target looks like 8500 in coming weeks/months.
JSE:DSY Discovery MarkdownFollowing the distribution of Discovery (See post below) it seems that it is ready for the markdown. Divergences in the RSI, declining relative strength, failed test of the 200sma and failed test of the yearly pivot point all point towards the continuation of the markdown.


DSY possible shortDSY break of flat bottom Triangle and closure below today will trigger
further downside movement.
wait for confirmation
for the more aggressive investor nibble some

JSE:DSY Discovery Markdown Starting After a good markup phase, Discovery has undergone distribution. After a breakout of the distribution trading range (TR) price has backed up (BU) to the TR and is now pushing lower which could be the start of the markdown phase. Volume has declined on the BU and divergence with the volume RSI indicates a continuation of the decline.

$JSEDSY DAILY50Discovery DAILY is heading for DAILY RESISTANCE around R132.65 RSI is pointing up showing the momentum is in favor of this move. If resistance is broken the next TARGET will be the DOWN trend resistance around R142.50

DSY - Still BearishWe may derive the following from the Weekly DSY chart:
1. Price has been slowly correcting over the past few weeks.
2. It is probable that price will test the trend resistance line and then continue further down.
3. Monitor price action and be patient before trading.
4. As always - maintain your risk.
Note: The views provided herein do not constitute financial advice.
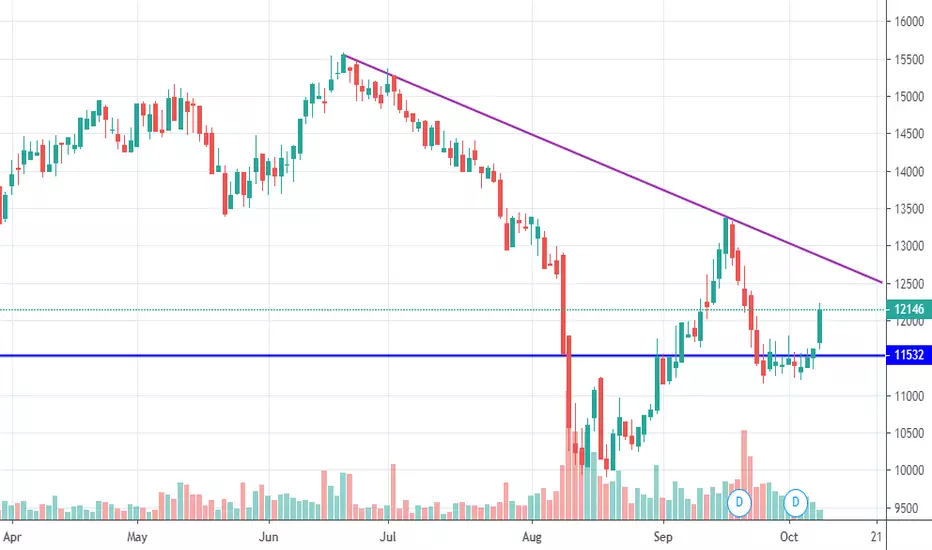
$JSEDSY DAILYDiscovery DAILY has broken out of its short term DAILY range and is now heading towards the over head down trend RESISTANCE around R128


DSY possible shortIf confirmed, we can possibly be looking at a short move on JSE:DSY as it is at quite a strong resistance level, and might fail to break through it.
