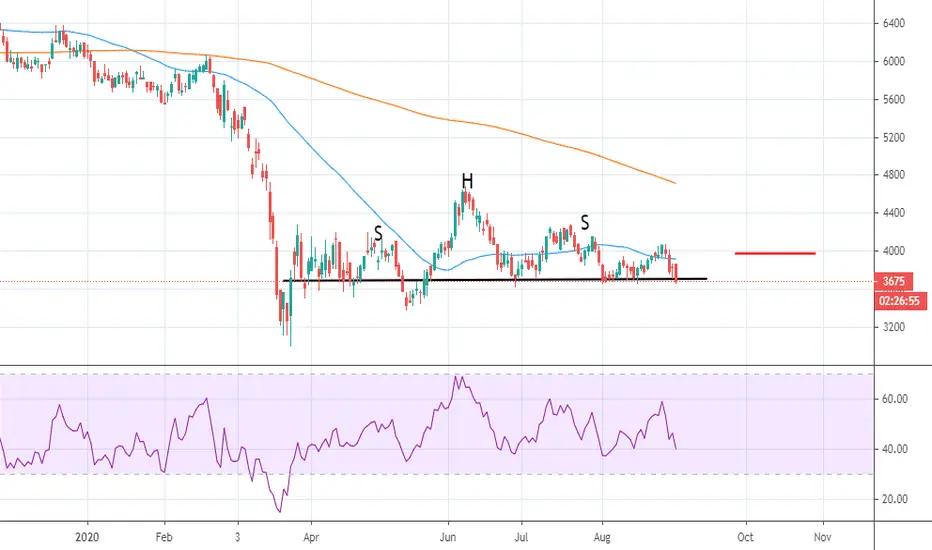
FSR - Head and ShoulderFSR is forming a H&S with a close below 49.50 triggering the short idea. Stop loss above R51 while first target is R47 and full target at R42
FSR trade ideas

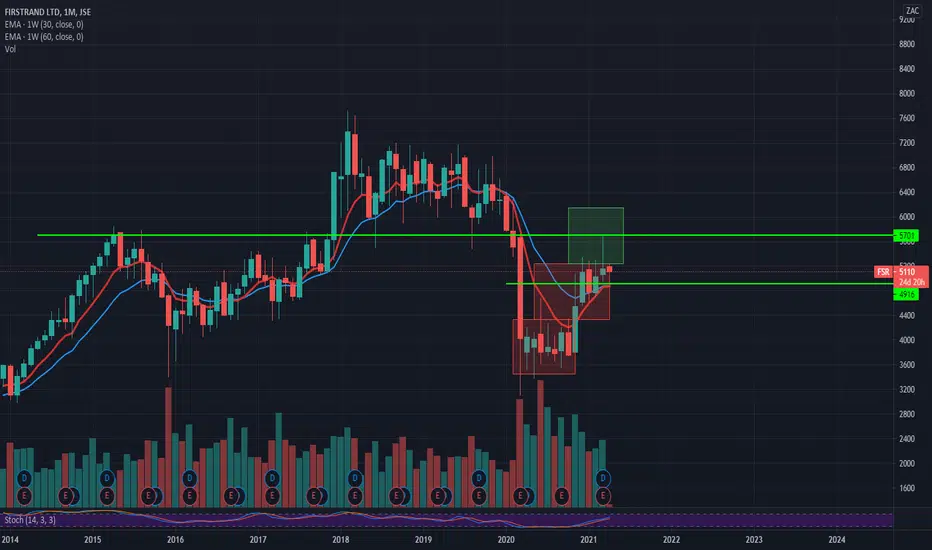
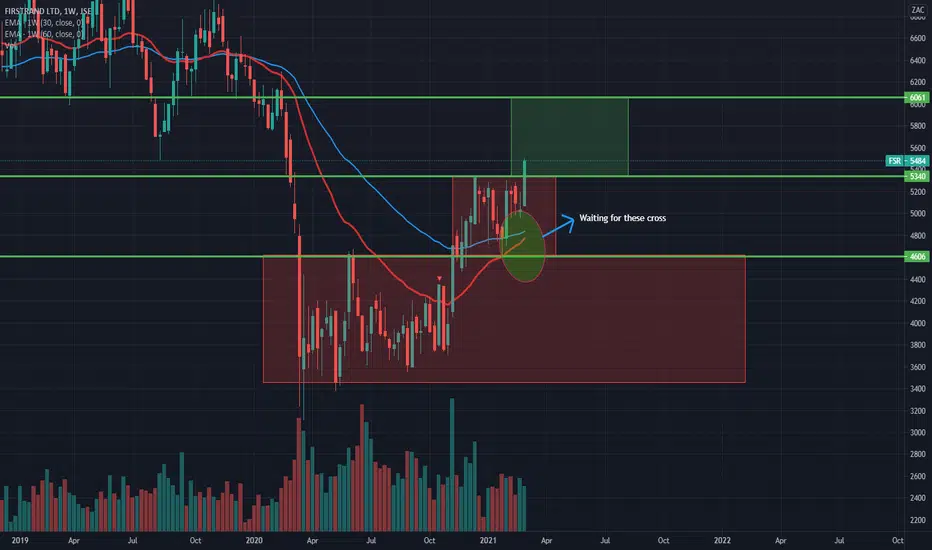
Firstrand looking bullishFirstrand (FSR)
Our financials have been a the bottom of the “K” shape recovery. However the index (J212) is looking rather bullish breaking into higher boxes. Last week we had a nice doji candle as the 50w and 60w EMAs held as support. That was followed by a higher close.
Firstrand seems to be amongst the leaders of the pack. The stock broke into a higher box, but turned back to the lower box.. The 30w EMA is only 8 points from crossing the 60w EMA. I’m looking for a close above the last high close of 5564c on the daily chart. Last time we closed above this level was back in March 2020. I will put my stop at 4900c.
There’s a fairly strong long term support/resistance. At 5700c. If we get a close above 5700c. We have a bull market on Firstrand.
FSR Head & Shoulder PatternBeen stalking this topping formation on FirstRand chart. If the neck gives way there is some 12% to be harvested. When target is met then view changes to bullish for upwards of 20%.
FSR - SupportFSR finding support at R49.60. Long Idea looks strong above R51.35. R50 been a key psychological levels has held for the past 3 sessions. 1st target at R54. Stop loss below R49.60

FSR bull flagFSR pulled back to support in the form of a bull flag. Tight stop at close below R49.50 and target R54 to R55.

Can it hold the line?Bad week for FNB, but still holding to the channel, lets see what this week brings.


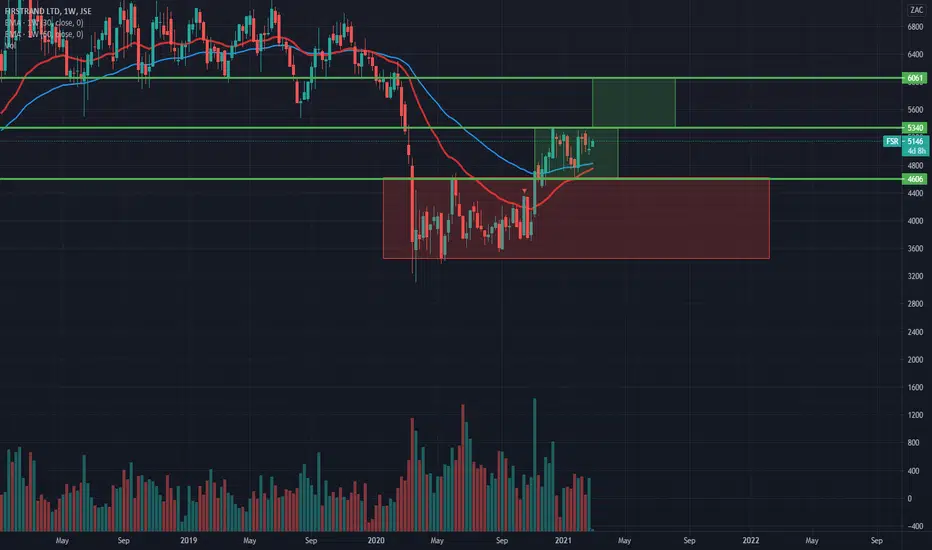
Firstrand looking bullish, moving to a higher boxMoves to a new box, but the 30w EMA is still below the 60w EMA. The two are quite close from crossing.
FirstRand looking lively againThe banks are looking like they’re recovering. Firstrand is looking quite good at the moment. Currently trading within the R46 - R53 box. If the stock breaks to the R53 - R60 and the 30 EMA crosses the 60w EMA. I will buy the stock.
Descending triangle in the makingFRS is making a descending triangle. A close below R49.60 would trigger a short towards R46.40.


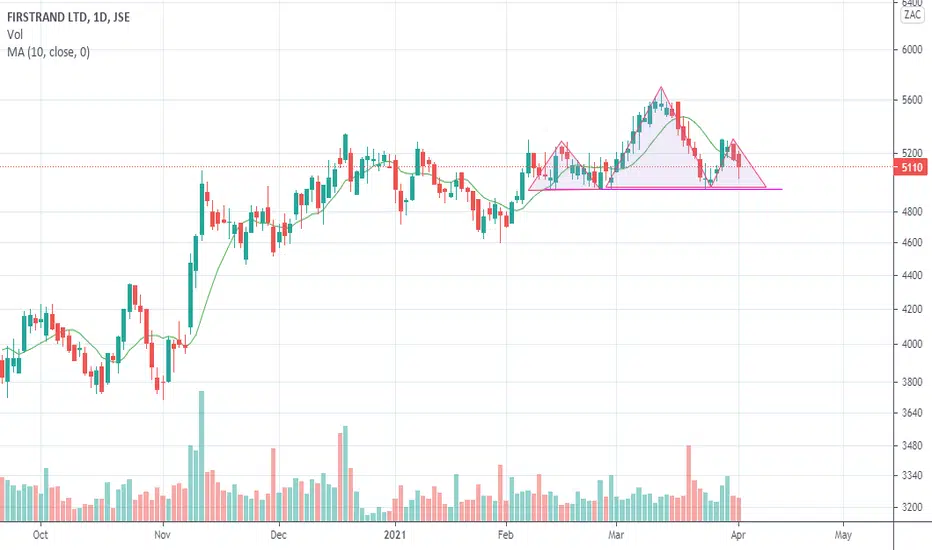
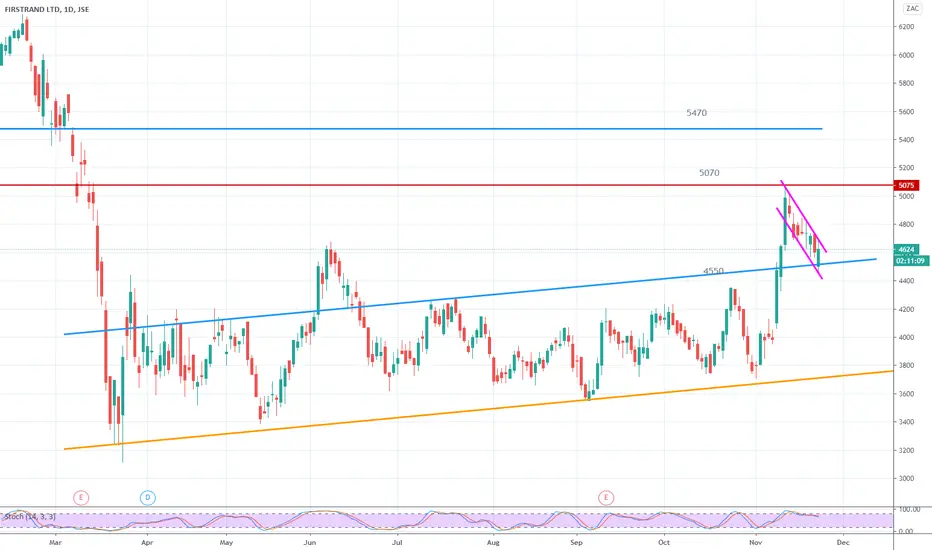
$JSEFSR Firstrand Consolidation FSR reached consolidation support on the upper band of the up channel it broke a few weeks ago. First target was reached at 5070, before consolidation started settling in. Second target 5470 remains in the pipeline unless it breaks back into the channel and the upper band of the channel then becomes resistance once again.
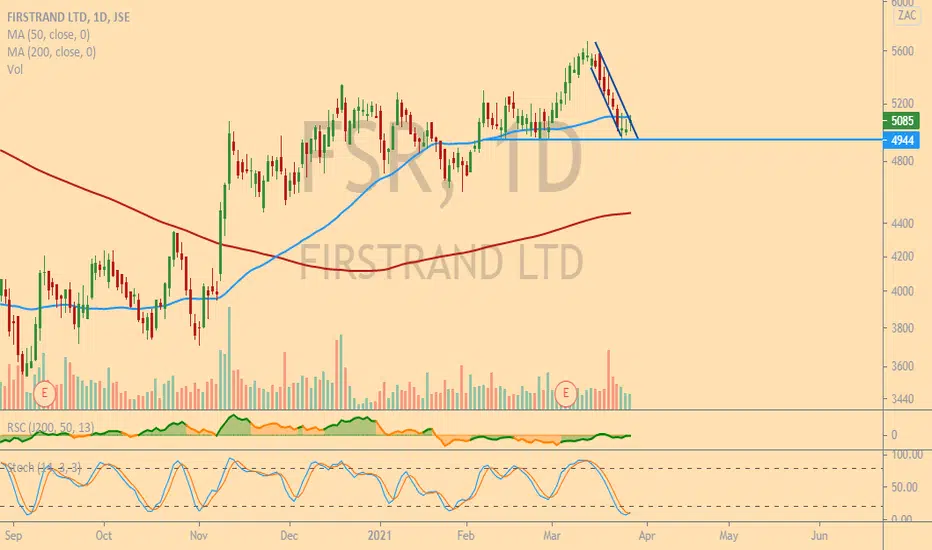
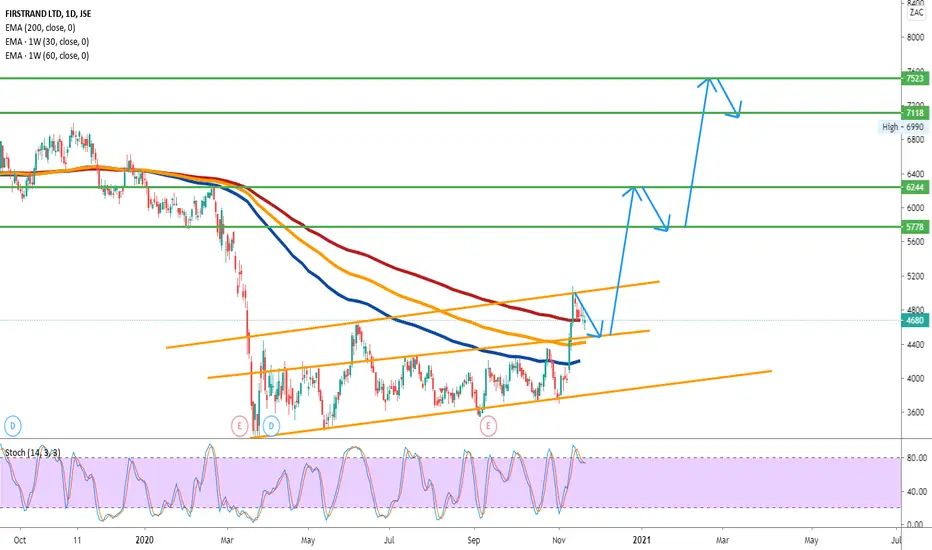
Firstrand looking bullishFirstrand looking bullish at the minute. The share making higher lows and higher highs. Broke through its 200d EMA. However, 30w EMA is still below the 60w EMA so I will wait for now
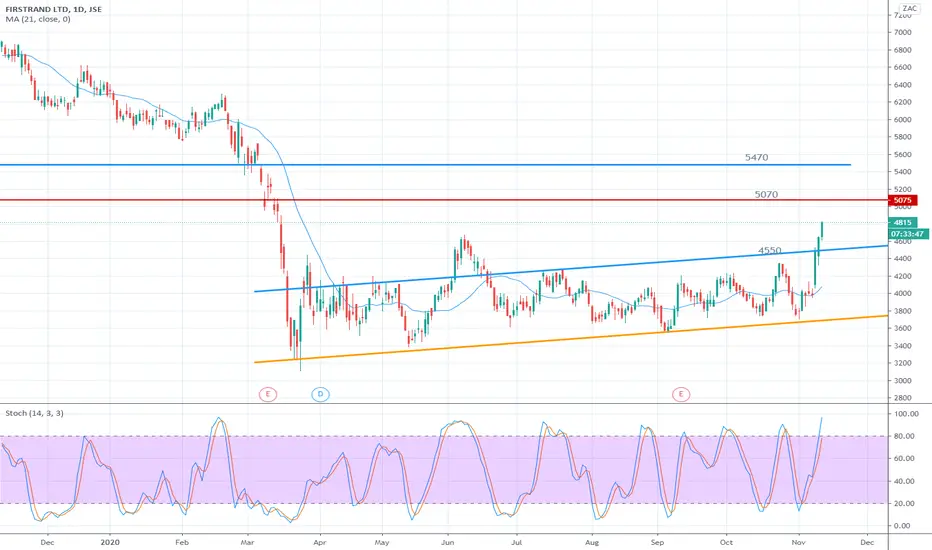
$JSEFNB First National Bank. Channel consolidationWatch for a channel break of around 4550 for two possible targets to open up - 5070 & 5470. Banking sector has been in a consolidation channel since March. Wait for the break.


FSR - symmetrical triangle breakoutJSE:FSR has broken out of a symmetrical triangle pattern and seems to be moving in an upward direction. If it confirms above the highs of early October, I will consider entering long.

Bearish flag on FirstrandFirstrand
We have a nice bearish flag on the share. The previous week’s bearish engulfing candle looks to be playing out. We also had a golden cross in the early stages of the flag formation. If we break below the R34 level, we could see some further pressure on the share. R29, 25, and R14 levels are potential targets. We might see some reactions at those levels. As they were support back in 2013-2014.
Weekly game plan: villagetrader.co.za


FSRPrice currently flirting with neckline support of a H&S technical chart pattern on the daily chart, if confirmed measured target is R28-R30.