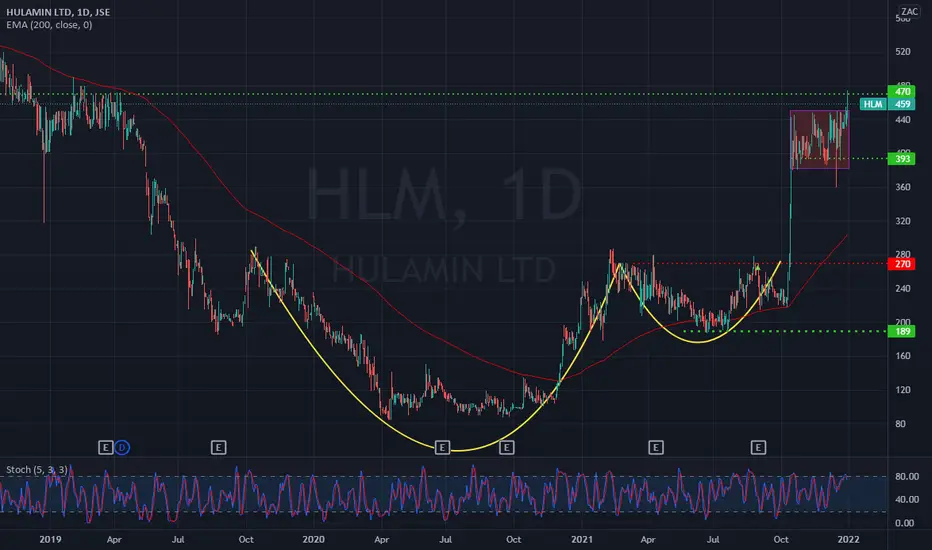
UPDATE: Hulamin hit target at R3.91 heading to R4.40After a long wait once the price broke above the W Formation.
Then moved sideways and crossed above with the Cup and Handle.
The first target of Hulamin hit at R3.91.
The momentum is still strong and on the up. And we can easily see further upside to come.
So, the next target with similar momentum will be to R4.40.
HLM trade ideas

UPDATE Hulamin showing strong upside after it's break upto R3.91We were very close to the analysis being null and void.
But then, we had a change of wind and the market bounced off the lows heading back to the range.
It then broke up and is now on the way to the next target at R3.91
Looks good still.

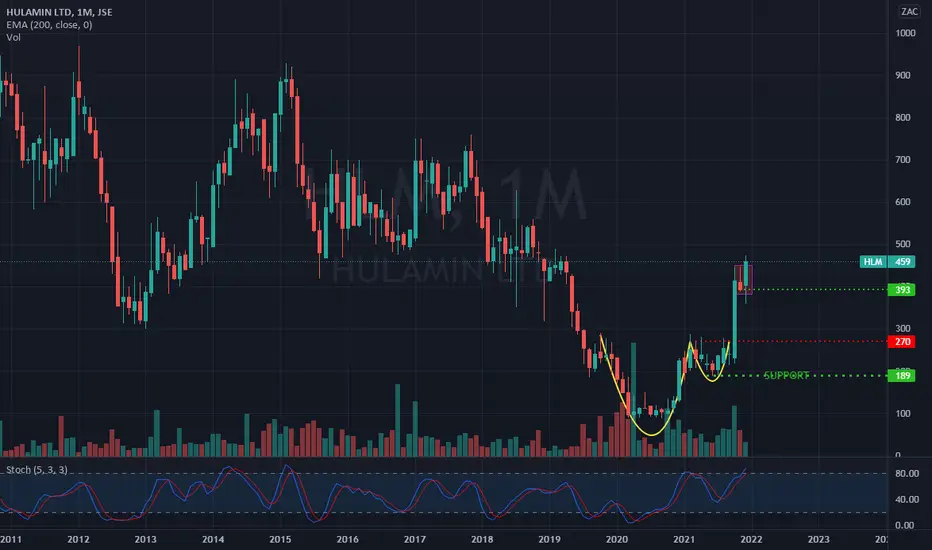
$JSEHLM - Hulamin: The Consolidation ContinuesSee link below for previous analysis.
Little has changed with Hulamin since the last analysis, 6 months ago.
If anything, price is consolidating further in a Contracting Triangle; a contracting triangle is a neutral pattern and as price consolidates towards the apex, the breakout tends to be more violent.
I remain neutral until we get a clear breakout.

Hulamin poised for great upside in 2024Cup and handle has formed on Hulamin since 10 May 2023.
With these Penny STocks and less liquid markets, they can take a long time to form patterns and formations.
But when they breakout, they can rocket in the direction of the breakout.
I like that it's restested the support and brim level, and is showing that the buying is accumulating.
And that that price is above the 200MA.
These are always risky markets to dabble into, but they're fun nevertheless.
Target R3.91
FUNDAMENTAL ANALYSIS:
Growth in the Can Market:
Hulamin has been focusing on expanding its presence in the lucrative can market. This strategic move likely increased investor confidence in the company's growth prospects and operational focus.
Aluminium Prices:
The price of aluminium has been testing a 13-year high, which positively impacts Hulamin's valuation and profitability, as it is an aluminium products group.
Stock Movement and Company Talks:
The company's stock has seen significant movement, with its value almost doubling in a week. This surge is partly due to Hulamin being in talks that may affect its stock, though details of these discussions were not disclosed.

$JSEHLM - Hulamin: Still ConsolidatingSee link below for previous update.
Hulamin did not kick on from the previous analysis and price is clearly in a consolidation phase.
I am seeing a triangle pattern forming which can break out on either side so I am now taking a neutral stance.

Hulamin Asc Triangle and Bearish FVG showing up signs to R5.40Ascending Triangle has formed since 13 June 2022 on Hulamin.
There are higher lows and same highs.
This means, momentum is pushing on up.
Other indicators include:
7>21 >200
RSI<50 - Higher lows
Target R3.59 and then R5.40
SMART MONEY CONCEPTS:
Now with Smart Money Concepts, we have something interesting.
A LARGE Bearish FVG (Fair Value Gap) has formed on the weekly chart.
What is a Bearish FVG?
A 3 candle structure with a down impulse candle that indicates and creates an imbalance or an inefficiency in the market.
Between candle 1 and 3, do NOT show common prices.
The price needs to move back up to rebalance and fill the gap.
During this process, it will rebalance and head on up to R3.59. Also the resistance will be broken, which will give way for the price to move to the next target of R5.40.

$JSEHLM - Hulamin: Bulls Re-emerge On Good FY22 ResultsI last covered Hulamin on the 26th of September 2022.
I have linked the previous analysis.
Earlier this week, on the 6th of March, Hulamin released its full year results for the year ended 31 December 2022 with the following salient results:
Turnover increased by 22% to R16bn on group sales volumes of 211 328 tons
Normalised headline earnings per share up 28% to 105 cents per share
Local sales up 7% to 94 651 tons with richer product mix
Normalised EBITDA increased by 339% to R667 million
From an Elliott Wave perspective, the bear from 545 to 205 unfolded in a three wave zigzag.
What has unfolded from 205 to 319 to 240 is a wave 1-2 sequence and price looks to be in the early stages of wave 3, with the latest results providing tailwinds.
Long position can be opened at current levels with a stop-loss for traders below 240.

Hulamin just gave an awesome buy signal to R3.59W FORMATION formed on Hulamin which broke above the neckline today.
Tomorrow if the price opens above the Neckline the signal will be solidified.
7>21 - Bullish
Price<200 - Mixed
RSI <50 and bearish divergence
Target R3.59
FUNDAMENTALS
Hulamin Limited is a leading aluminum semi-fabricator and fabricator based in South Africa.
Hulamin produces a wide range of high-quality aluminum products, including rolled products, extrusions, and aluminum cans.
Hulamin's rolled products include aluminum plates, sheets, and coils, which are used in the transportation, packaging, and construction industries, among others.
The company's extrusions are used in a variety of applications, including building and construction, transportation, and engineering.
Hulamin is looking bullish which is curious considering the resources on the JSE is showing downside to come.
This is probbaly because there is high demand for aluminium than precious metals at the moment.

Hulamin downside update to R2.25M Formation formed on Hulamin and we saw bearish signs
The market then broke below and has stayed below the neckline but is creating a somewhat Rectangle.
They buyers and investors seem to be holding the level and supporting it as much as they can.
Once catalyst and the stock will drop dramatically
200 >21> 7 - Bearish
RSI <50 and bearish divergence
Target R2.25
ABOUT:
Hulamin is an aluminium semi-fabricator business located in South Africa supplying customers across Africa and the world with an extensive range of quality products.
Supported by a sales office in South Africa and a network of international agents, the company sells to leading manufacturers and distributors across many industries around the world.

Hulamin just got a sell signal to R2.25!M Formation has formed on Daily.
Things have been looking very bad for Hulmain for the last year now.
200 >21> 7 - Bearish
RSI <50 and bearish divergence
Target R2.25
General info:
Hulamin (est. 1935) is a South African aluminium rolled products manufacturer and distributor, listed on the Johannesburg Stock Exchange (JSE).
They produce a wide range of aluminium products, including plate, sheet, and foil products.
The company has a strong focus on innovation and has developed a number of unique and patented aluminium products.
There seems to be trouble in the Aluminium space. Either there is an overcapacity, lower demand, better alternatives and higher competition or there is a shift taking place where consumers are turning more and more to renewable sources. This is going to hamper the prices further with these companies.

Hulamin broken above Ascending Triangle target R3.80BULLISHness on good old Hulamin has struck.
We see the price breakout above the Ascending Triangle as price is also above >200MA
Target 1 - R3.80
Let's see how this one plays out as the price is meandering around the sideways levels. We need a strong catalyst for upside...

HulaminHulamin with another attempt to break out of its 'base'. Previous attempts have been met with selling pressure. Will it successfully break this time? Only time will tell!

Hulamin looking strongBULLISH
Ascending Triangle formed on 4 hour
We are just waiting for a break above R2.98
Price >200MA
Target 1 - R3.80
Concern is that the previous trend is down and the uptrend could very well fizzle but the bias is still bullish.

HULAMIN Looking good for upside October 2022BULLISH
Ascending Triangle formed on 4 hour
We are just waiting for a break above R2.98
Price >200MA
Target 1 - R3.80
Concern is that the previous trend is down and the uptrend could very well fizzle but the bias is still bullish.

$JSEHLM - HULAMIN - No Buyout, Will Bulls Re-emerge?Take a look at the fundamentals before diving into this one on technicals.
Recent developments include:
1) potential major buyer/investor pulls out of the deal which led to the big share price crash.
2) Interim results showed good growth on HEPS, Revenue and Operating Profit.
3) CEO to retire at the end of September 2022.
Technically, a long-term bottom seems to be in place at 85 zac.
The rise to 545 zac appears to be a five wave impulse (1) to (5) for a higher degree wave I.
As long as the current correction trades above 85 zac, i will maintain a bullish stance and label the correction as wave II in anticipation for wave III which tends to be the strongest wave in a five wave sequence.
There is not enough evidence that a bottom is in yet but 205 zac is the key level to monitor in the short-term.

HulaminNice base formed on Hulamin in the form of a Cup & Handle technical formation; a break of which may target 370c next.

Neckline retestThe stock is retesting the neckline of the inverse head and shoulders pattern. It is also filling the liquidity void created during the break of the neckline.

HulaminA bullish breakout on Hulamin 2 days ago. The stock has been consolidating for at least the past 6 months.
But given we are in an era were breakouts are failing, it remains to be seen if this one will hold!

HulaminReceived a query on the name, so I thought I'd also update it here:
Hulamin HLM - it's had a strong run over the 15-17 months and the weekly momentum looks to be in tact. Moderate resistance around this 490c level which is the prior support and breakdown level. If the share clears and holds above 495c then we could see 610 to 620c over the medium to long term. With it being a less liquid name, a smaller position would apply.
You may recall most recently (04 August 2021) we presented a buy/long at 231c, citing a medium term bull flag. See original view inserted on the current (weekly) chart.
Original Idea and Recent Follow Up Attached

Possible long opp on $HLMPrice has broken out of this rectangle setup tested the SR level at 474. Stock is a bit illiquid at the moment. A long position can be initiated when price closes above 475. As always manage your risk.
Long opp on $HLMPrice has broken out of this rectangle setup tested the SR level at 474. Stock is a bit illiquid at the moment. A long position can be initiated when price closes above 475. As always manage your risk.
hulaminSupply and Demand
Demand R3.11
Supply R7.91
180% increase just waiting for 5 years.
Cheap Stocks

Hulamin. "Cheap" Fundamentals Suggested Buy. Now +80%. Reduce. Original Idea Attached (28 July).
Technically, gave us a bull flag while the fundamentals were appealing. As I noted on 28 July:
Share price -93% off all-time highs.
Trading at discount to book value.
Turnaround efforts started in 2019 largely concluded.
Order books healthy.
Mkt Cap R758m vs Revenue of R8.6bn (down 20% in 2020).
Cost reductions implemented however cost reductions obscured by firmer ZAR.
Shares outstanding lower vs 5 years ago (~328m vs ~300m)
Revenue earned from SA roughly the same as that from Europe - ZAR hedge characteristics.
Con: For FY 2020, no dividend declared due to uncertain outlook.
Technical Structure: Emerging from bullish flag , rebounding off back-test of 200-day for commencement of upward trend.
For more real-time insights and trade ideas, get in touch today.
