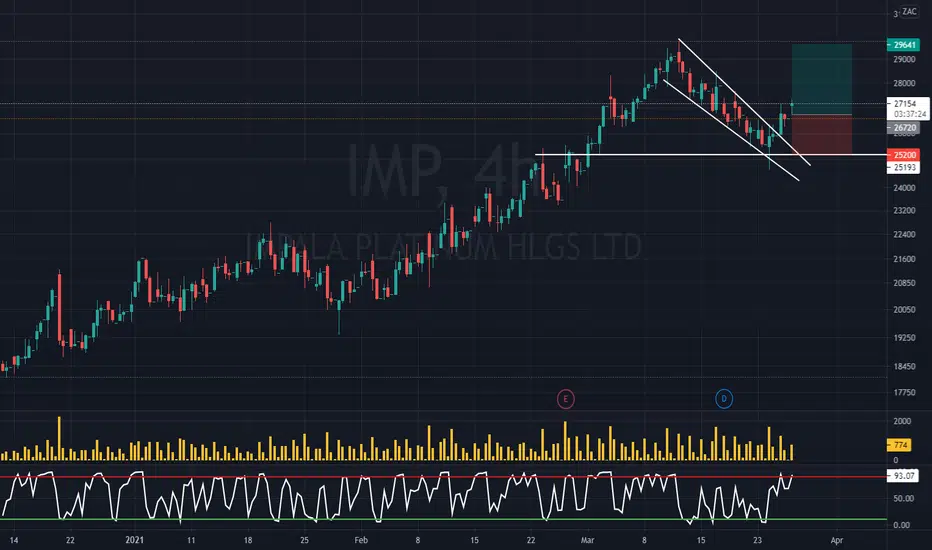
IMP "Accumulate Near Prior Congestion; Short Back-Test of Breakdown"
Over the last few weeks, we have highlighted the PGM sector as vulnerable to downside, with both IMP and AMS flagged as having the potential for downside risk. Last week we presented our perspective on IMP’s monthly chart risk while the previous the daily chart was flagged with the potential price path from mid-April following our expected trajectory (highlighted on chart), and now having breached two incline support levels.
On the buy/long side, we would look to accumulate (provisional) at the prior congestion zone, which is between 21300c and 21700c.
On the sell/short side, the next rebound into the 26500c to 27200c range is a provisional distribution zone.
IMP trade ideas

IMP - Bull flagA close above R270 triggers the long idea with a target at R290 while a close below R260 is the stop loss.

IMP - 1D - CAUTION, TIME TO TAKE SOME PROFITThe instrument is nearing all time high zone, although stochastics daily are oversold i would wait and buy closer to the lower green zone which matches with the 200day ma. there are also a bunch of Bearish engulfing candles, which together with the weekly stochastic still overbought points to a further fall in this instrument. Will reconsider buying closer to the 200 day ma.

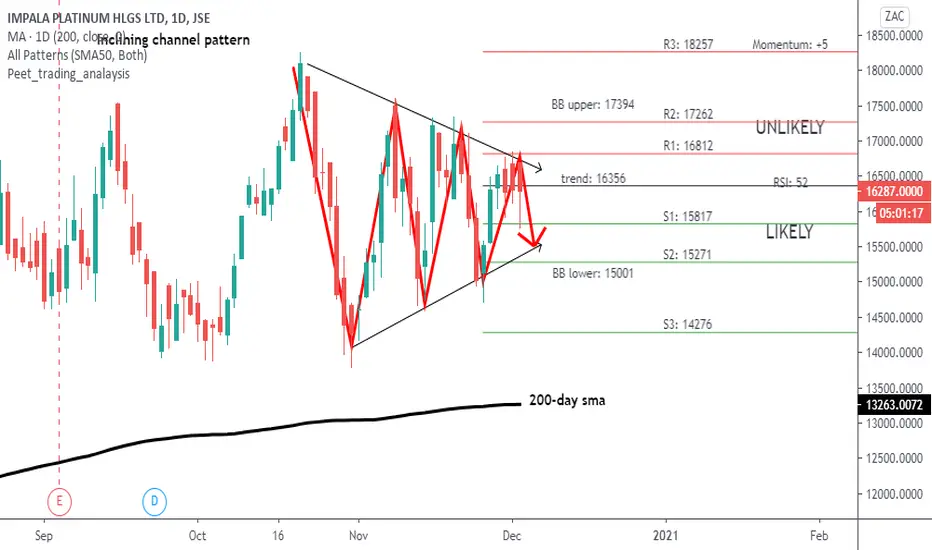
Impala Platinum - Long Term CautionOne of the shares I will be highlighting in the upcoming week's research note(s):
- Long Term Holders: Caution; Test of Prior Multi-Year Breakdown Level and Fibonacci extension.
- Reviewing the monthly chart, it’s important to note the share trading at it’s prior multi-year peak, with the currently pullback being in line with the same breakdown level of July 2008.
- This level also coincides with the 4.236 Fibonacci extension.
- Also note the bearish divergence as per the monthly chart.
- As noted in our prior research note dated 23/03 at R2115, it’s peer Anglo American Platinum traded at a multi-year peak, created an opportunity for long term holder to reduce their positions at attractive levels. As of Friday’s close AMS traded R345 lower to R1770.
- As they say: ‘Sell when you can, not when you’re forced to!’

Impala found support on the 50EMAThis JSE:IMP bounce on the 50EMA has the potential to be a 1:3 risk to reward swing trade.

Impala Platinum breakout of the ascending triangleImpala breakout from through the resistance that formed an ascending triangle pattern. I've added to my breakout trade. and have updated my initial stop loss to slightly above break even

IMP Long position On the daily there are clear HH AND HL and clearly indicating a uptrend .
From the Fib on those certain points marked check for a candle stick pattern on the lower time frame


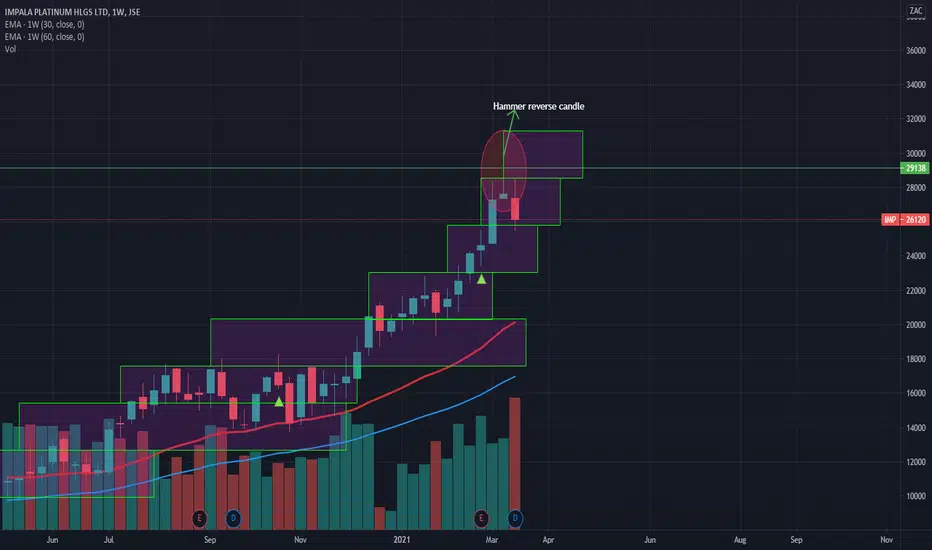
Worrying reversal candle, but I remain bullish on IMPThere’s a classic hammer reversal candle on the weekly chart. Which was subsequently followed by a bearish candle. This is a typically bearish signal. However, I still believe we in a bull market. If indeed The hammer trade proves right and the stock falls I will be stopped out at 23202c . As the stock moves to a lower box. But if that trade doesn’t play out and the stock moves higher. I will add to my position if we get a close above 29138c. This would be a multi year high close. The last time this stock closed higher than 29138c was in July 2008.
Trade Summary 22 March 2021
Average entry: 21962c
Position size: 16.4
Stop loss: 23202c
Risk: +20336c
Risk%: +2.44%
Dividends received 13120c.
IMP - 1D - CHAPTER 2Sentiments remain the same as idea published 11 Feb. Heavy overbought positions. Will wait for Fibonacci retracement levels before entering a trade.


Bullish breakout for ImpalaNice little bullish breakout from the pennant chart pattern. According to Investopedia.com, "the price target for pennants is often established by applying the initial flagpole's height to the point at which the price breaks out from the pennant". This effectively means that Impala still got a lot of legs. This is concurred by the current Thomson Reuters consensus target price of R261 on Impala.
My long is a long-term call and with both the share price and the underlying platinum/palladium price which currently looks to be somewhat overbought according to their 14-day RSI's, one could try and wait for the share price to move closer to the 50-day moving average, before entering. Cards on the table - I'm already long.

IMP - 1D Good results and meaty gains through the promise of stimulus injection. I will be weary to buy at these levels as we are close to 2011 highs. There are also a multitude of bearish engulfing candles over the last few days. I will wait for a much needed pullback before considering entering a trade.


IMP - Odd Lot Offer Due to the company's strong performance, they have declared an odd lot offer where they will buy back shares at R172 from shareholders with 99 or less shares
At time of writing the share is trading at R143.45, yielding a zero risk return of approximately 20%
See their SENS for more info

IMPALA 1D - POTENTIAL DOUBLE BOTTOMStochastics are over bought. if double bottom pans out rewards are high. Then there is also the odd lot offer in play .I Buy at152.95 , stop at 152.70 and first target is 180.49

IMP - Double BottomJSE:IMP is showing signs of a reversal to the up side due to the double bottom that has formed. After a successful short position, it has bounced off of support and looks like it will be heading up towards resistance at around the 17500 level.

Double Top on ImpalaAfter a successful long position, JSE:IMP has bounced off resistance to form a double top. I think we can look forward to a downward move down to the support level around the 14200 level.

