INL trade ideas


Investec: The Zebra Keeps GallopingWhen managing your own money or that of clients, I'm sure there must be no better feeling than seeing a position continue to advance week after week, month after month. If you know me, you'd know that there isn't a more important question I'd ask than what your time horizon is. Over the last few years, it feels as if nearly every conversation has either started, or ended with the phrase, "it depends on your time horizon". You see, some guys are looking for 50c intraday on Firstrand while others are looking to catch the next R30 or R100 on Sasol. Both of these will happen over different time horizons, thus, the tools used to analyze the opportunity will be different.
What do I mean?
Well, you wouldn't really analyze a monthly chart if you're trading intraday nor would you analyze a 15-min chart if you expect to hold your position over many months or years.
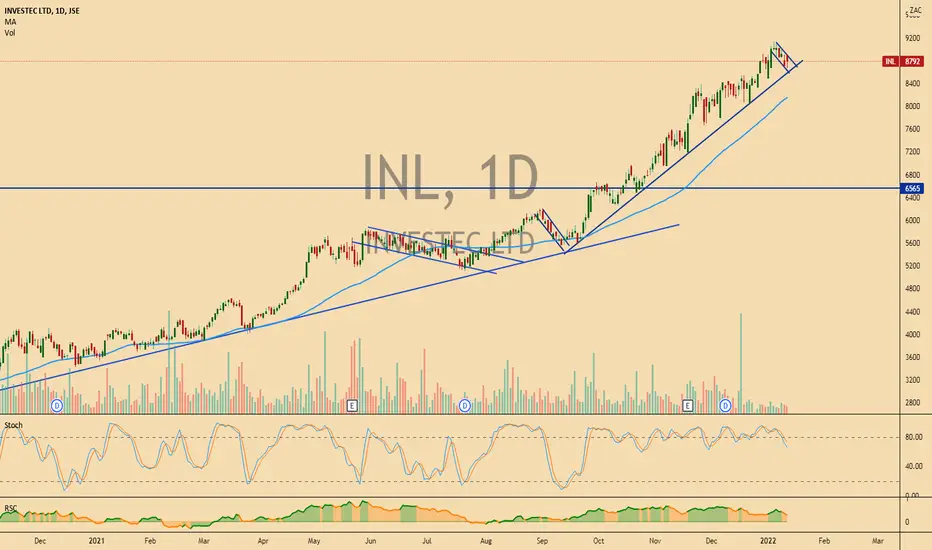
Take for example Investec (INL), an idea which I published in February 2021 at price of R41.09. Utilizing the weekly chart, I noted the price emerging from a multi-month base and testing overhead resistance (not a bad thing). What also motivated my call was the monthly RSI trading at 44 (not even bullish yet) while the weekly RSI trade around 57. Notice how the spread between the two is widening?
Using weekly and monthly indicators offer one: sustainability.
If I can avoid switching in and out of positions every third day and have my positions continue to act well, then I would rather have that.
For short term trading, one requires a different mindset than for medium to long term portfolio management.
Also, you have to ask yourself: Is this a mean reversion trade, or is it a momentum/trend following trade?
One rule? Stay with names above the 200-day moving average. Of course there are caveats to that and additional filters which I like to apply.
For more information on how to incorporate long term, momentum-driven strategies, get in touch today.

@VIllageTraderZA Demand comes back at the supply/demand areaDemand comes back at the supply/demand area. Buyers defending the price holding the 50 day EMA. The stock is well poised to break the 9000c resistance for a further rally

INL bull flagINL setting up a possible bull flag. If triggered first target will be recent highs and second target R95.
Trade ideas are my own and not financial advice.
INL: lurking downside potential?A bearish trend is applicable below 7600.
Overbought above 7600, which increases the likelihood of a throwback.
Correcting from the upper range of the Bollinger Bands.
RSI leaves enough room for further downside price potential.


Investec moving quite nicely into higher boxes
The stock broke and moved sharply subsequent to the break. I have moved my stop to profit. Now waiting for a close above R56.50 to add to the position
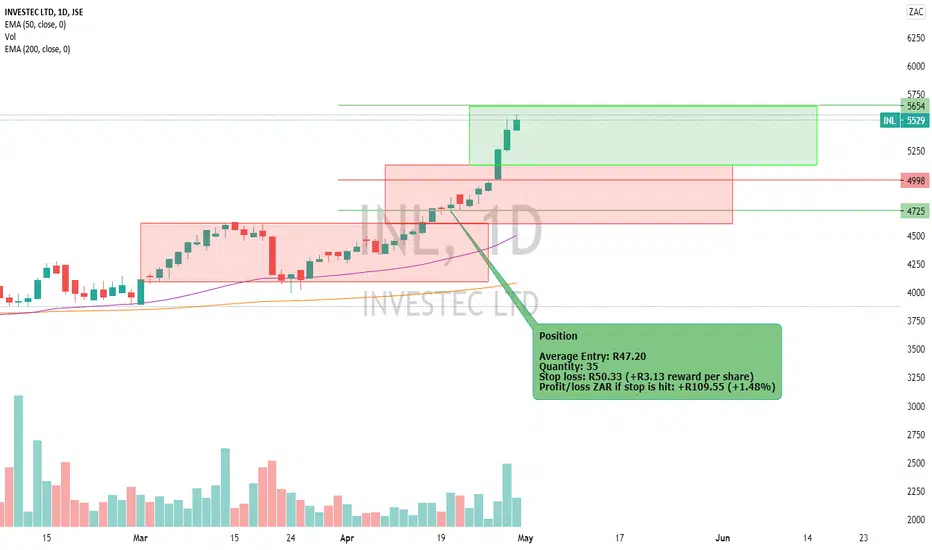
Position
Average Entry: R47.20
Quantity: 35
Stop loss: R50.33 (+R3.13 reward per share)
Profit/loss ZAR if stop is hit: +R109.55 (+1.48%)
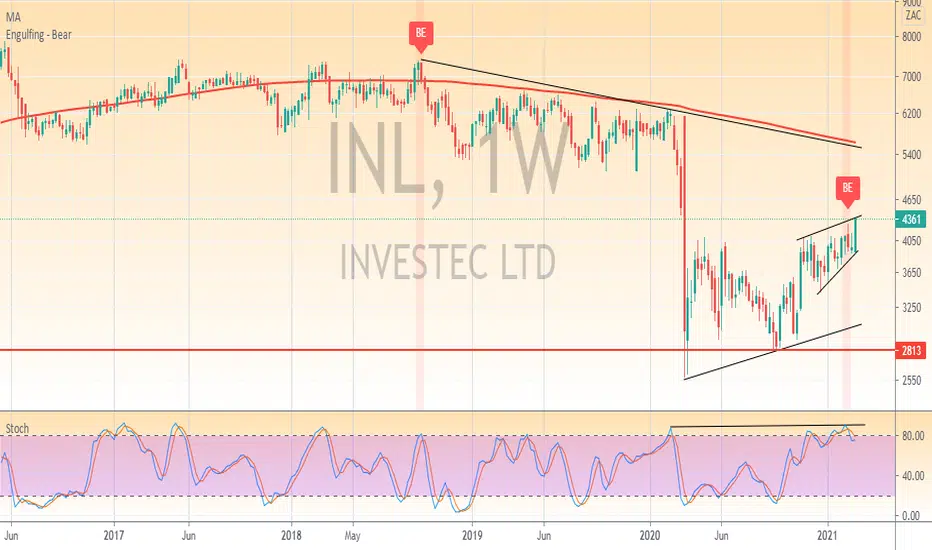
INL - -1W - ANALYSISThe chart is still below the 200 day MA this shows bearisnes, Stochastics are overbought on weekly and daily charts. The engulfing bearish candle at the top also gives me a warning sign. i would not buy this stock at this time. Also forgot to mention the rising wedge which is negative.

INL resistanceINL reversed a few times of that R41 level. Keep an eye on that level for a close above to go long.

INL: lurking downside potential?Bearish confluence of technical indicators supports downside potential.

Symmetrical triangle base re-test InvestecInvestec gives us a second bite of the symmetrical triangle short trade with an even more elegant entry. If you missed the first breakout. The market closed with a Hammer candlestick a bearish candle. and a decent risk-reward ratio


Pair trade: INL likely to outperform SBK?Pair or relative trade, a market neutral strategy
Simultaneously Long INL vs Short SBK.


INVESTEC Bull SetupMy set-up for Investec -things appearing very bullish. Price might rise to 3800 area, then reject down to 3400, and break away up in a bull trend.
Bullish interests.

a look on Investec PSG and Coronationthis video entails some of the large Assert Management Companies here in South Africa every week we are going to look at a specific sector on the JSE and try and break it down to find investment opportunities
im not a professional speaker but ill try to improve quality and analysis as time goes on


INL: time for a short?Price streak and momentum streak close being at the historic maximum.
In RSI overbought territory.
At resistance.
Time to exit: +/- 7 October 2019
