MCG Upward moveJSE:MCG is showing some good upward momentum at the moment and could do well for a long position. Although the MACD and Stochastic alerted quite a while ago, the EMA's are confirming the upward momentum.
MCG trade ideas

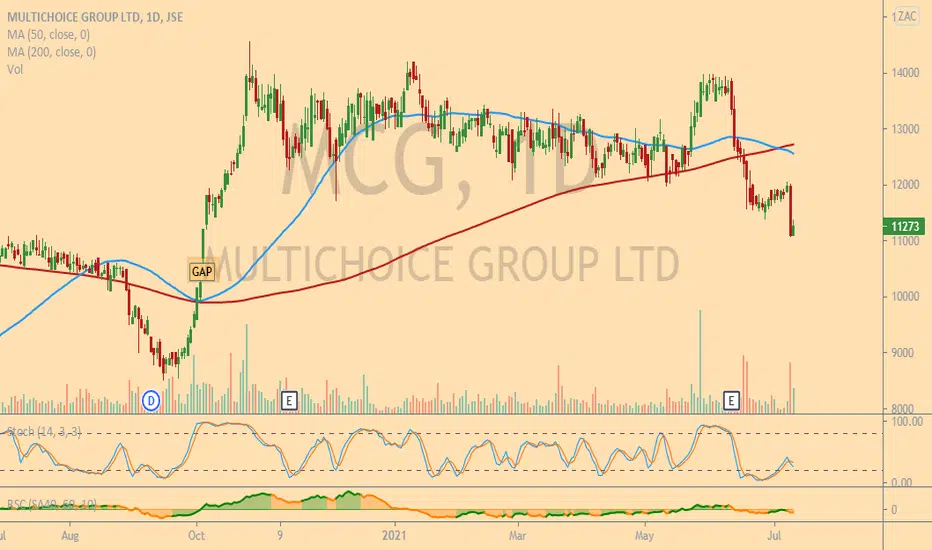
MCG moving lowerMCG had a good run from Sept 2020 and then started to trade in a range. It is losing momentum with the 50DMA crossing below its 200dma. It also got hit by tax news from Nigeria. I am not a big fan of shorting but if the tax situation is not getting resolved soon it might drift lower to close that gap at R103.
Trade ideas are my own and not financial advice.
MULTICHOICESome background :
JSE (listed) 27Feb19 as an unbundling from NASPERS.
Multichoice is mostly Subscription based so bulk guaranteed income every month from subscribers.
Is this the start of a possible takeover ? :
French media company Groupe Canal+ SA (“Groupe Canal+”) increases their stake in MCG to 6.5% and then top’s it up to 12% (on 5oct20 & 20oct20 respectively), and off-course the positivity
of this news creates a jump Of 35% in 21 days.
REVIEW:
A.) Trading statement on SENS 4jun21 : very good results posted.
B.) Financials on SENS 10jun21 : good financials & DIV declared.
Last day to trade (LDT) : 7sep21
Ex-div : 8sep21 (R5.65 payout).
C.) Technical review on MONTHLY CHART :
Aug19-> Mar20 : Distribution phase then a mark-down phase.
Bottoms at R72.28 (a low point in mar20 , after covid news spooked the planet)
Mar20> current : Clear Elliot wave 1 to 4. Currently looks like a low of wave 4.
D.) Technical review on DAILY CHART :
26oct21 -> 12jan21 , distribution and mark-down phase. Completes 12may21.
Nice impulse wave follows (Wave 1), and then the retracement (wave 2) down to Fibb 78%.
Sends its feelers (the negative part of the wick) to where Bulls don’t like it.
We re currently at the 78% Fibb low. It looks like it is bottoming out around this level and offcourse,
the US FED meeting and then the news making making a bit much of this than what it really is. Old news. Move on people!
E.) Intraday review : 17jun21
A buy volume of 3.8mil shares bought around 12h15pm (GMT+2) (average daily volume is around 1.7mil shares/ day), so something is brewing.
On 27may21 a total of 9.89mil shares changed hands which is an unusual spike.
Hopefully the brew is “WAVE 3”. Time will tell. The markets certainly are digesting US FED news and figuring out what to make of it.
SUMMARY (13h30 - 17/6/21)
50sma : R128.32 ; 65sma : R128.42 ; 200sma : R125.26
WAIT for a buy signal before committing. Like a break above the 50day MA (R128.32) and break above R132.15(previous high).
Currently the price is hovering just under the 200SMA (R124.57) so, wait to see what the market does in the next few days.
If it breaks above R129 (38fibb) , my first target is R132(62 fibb), R135(78fibb), then R145.00 then R156.00, then R165, then R175 all based on channel on trendlines.
How long it will take to get to +-R179. I’m not sure. I believe there will be some retraction from 1st week in sept21. (LDT = 7sep21)

Multichoice- entry triggeredA clean break out of bull flag, should suffice as entry trigger.
It's a R40 flag (measured), so I reckon R160 is a reasonable target.


Update: Multichoice - Stop-Loss BreachedA nasty pullback in the first 30 min of Wednesday's trading session has seen my idea's SL tested. If you haven't entered as yet, then It may be worth continuing to monitor the price action to see it the support holds and reverses upward.

MCG -1D- CANAAl+ MIGHT PROVIDE THE UMF.Update to my idea posted 5 Feb 2021. I am still holding position. Stochastics not yet reached over bought levels. Bullish engulfing candle on previous week positive. Will wait on turn around candle or confirmation from ATR before considering a sell.

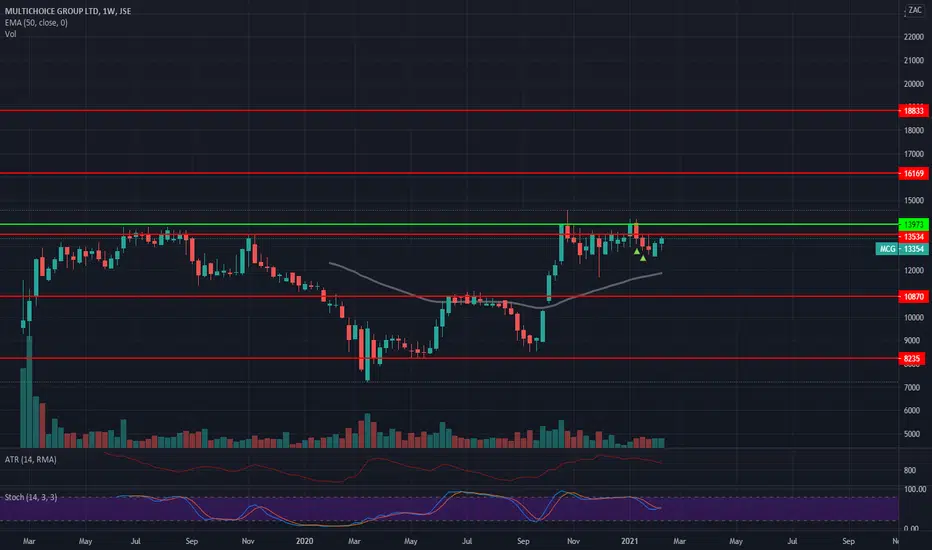
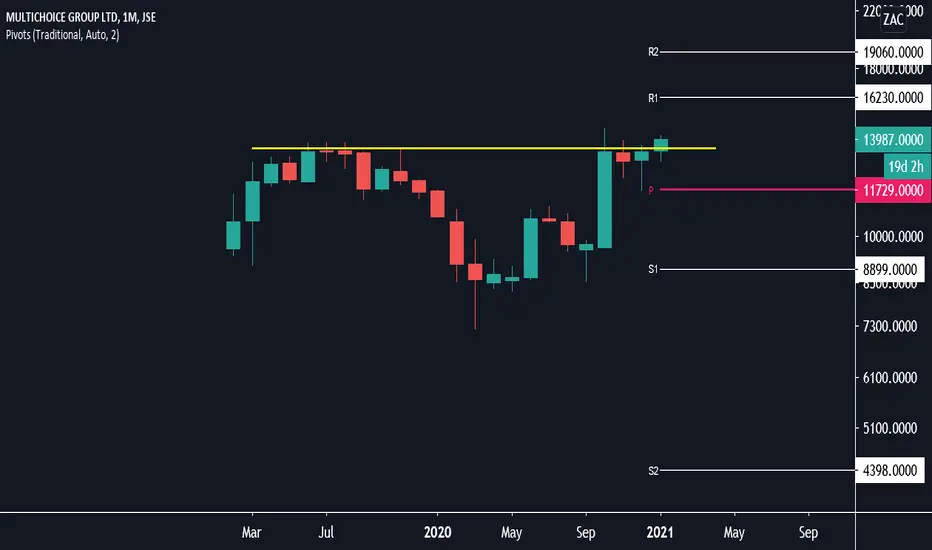
Multichoice looks good to break higher The stock looks quite strong at the moment. We had a nice bullish engulfing candle last week, and this week's close is higher than the engulfing candle. I’m looking for a break and close above 13900c. The share looks like it wants to move from 10800c - 13500c box to the 13500c - 16100c box.
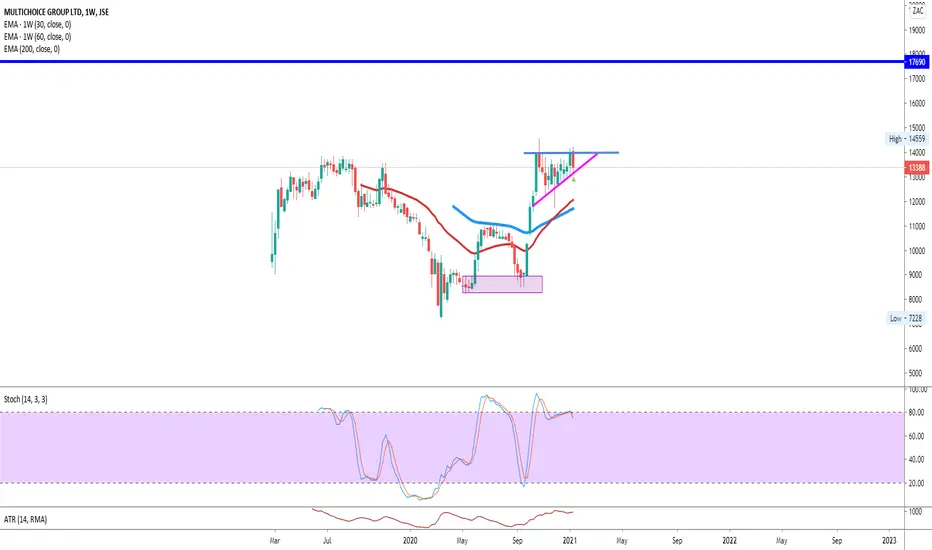
MCG -1D- CANAAl+ MIGHT PROVIDE THE UMF.MCG is forming a ascending triangle, and a horizontal bull flag. Stochastics are oversold on both the daily and weekly charts . ATR given buy signal on25 Jan. Would be good to breakout and target virgin space

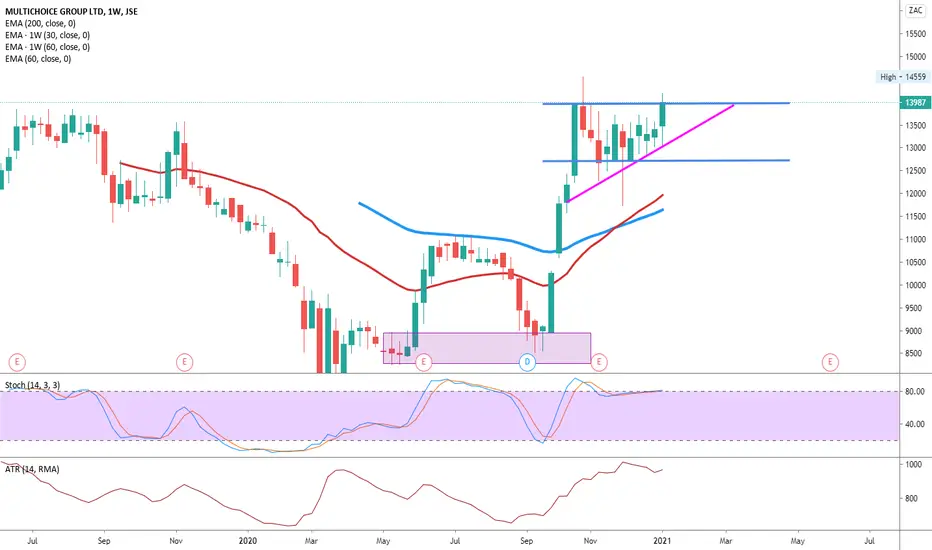
Ascending triangle continuation pattern.The stock has a nice looking ascending triangle pattern. This is a trade I’m in at the moment. If we break through the 14000c resistance level, I’m looking to add into the position. My target remains 17690.
Checkout the weekly game plan here
Horizontal bullish flag + Ascending triangleMultichoice MCG
We have a nice horizontal bullish flag on multichoice The share close on the other side of the resistance (R139.30) of the flag closing on Friday at at R139.87 A great opportunity to add into the bull flag trade I entered in December. For a new entry with a stop around R128. There’s a;sp an ascending triangle pattern. Looks like the long side has some wind at the back.
Read week 2 game plan - villagetrader.co.za
MCG Multichoice Group (MCG, 13987c) | During the second and third quarter of 2020, MCG provided opportunities on both the long and the short side however during the fourth quarter, the share remained without a directional bias as it hovered between a resistance of an average of 13750c and support of 12400c to 12700c. From the consolidation period which commenced on 22 October, we noted the candle structure reflecting a positive bias, with the ratio of green-to-red candles suggesting buyers remaining persistent at the multi-month overhead supply. Today's analysis on this share involved reviewing the monthly chart where we note the following: (1) the price continuing to test the overhead supply zone of 13500c to 13800c (a region that was also tested from June to November 2019). (2) the price has held above the most recent monthly chart pivot (3) We have seen a series of higher lows since May 2020 (4) the monthly RSI trades at 63, which is strong but not overbought meaning the share has room to advance over the long term.

Potential break in line of resistanceBased on the white trendline, MCG could breakout to make a new recent high.


JSE:MCG Multichoice Mark-up to continue after reaccumulationMultichoice has been strong. After a reaccumulation range and spring, we can expect the mark-up to continue.

Bullish flag breakout on MultichoiceWe have a nice breakout from the flag structure on MCG, using a stop loss of 12140c targeting the 18000c level

Multichoice (MCG) bullish flagMultichoice has been quite bullish, following the acquisition by Canal +. We now have a nice bullish flag on the share. Perhaps the launch of their new decoders which can stream Netflix and Showmax could be a catalyst to some further rally.


Possible down coming for Multichoice GroupJSE:MCG has been on a great bull run since mid-September but it looks like it might be turning down soon. It is currently consolidating at a previous resistance level. If it breaks lower out of the triangle pattern it is currently in, I will consider short.

MultiChoice- Double Top (What goes up, must come down...I'll be honest... I cannot for the life of me understand how this price got here neither can I understand why it shot up so quickly... Anyway, A close below 138.00 would signal a sell, So if you are long, I would be getting out. And a close below that level would be a nice shorting opportunity. The most significant support I can see at the moment is around R118.00...(What goes up must come down)
