$JSEMKR - Montauk Renewables: Bearish Engulfing Candle Is GloomySee link below for previous analysis.
Montauk is trading as forecasted. The bounce from 6120 to 10900 is for wave 4 but can still push higher. The bearish engulfing candle paints a gloomy picture though and could be the signal that the bear trend is resuming for wave 5.
I maintain my bearish stance even if price does push higher above 10900.
MKR trade ideas

MKR: bounce from bearish trend?A price action above 6700 supports a bullish trend direction.
Further bullish confirmation for a break above 7200.
The target price is set at 8000.
The stop-loss price is set at 5900.
Remains every risky trade.

$JSEMKR - Montauk Renewables: Down, Down, Down, She GoesSee link below for previous analysis.
Montauk recently released it FY'23 annual results and they were not pretty.
The renewable-energy company posted fiscal 2023 earnings of $14.9 million, or 11 cents a share, down from $35.2 million, or 25 cents a share, in the same quarter last year.
Analysts polled by FactSet were looking for earnings of $20 million, or 15 cents a year.
Revenue for 2023 was $174.9 million, down from last year's $205.6 million and below the $185 million analysts were expecting.
The company said lower prices for natural gas and renewable identification numbers, used to track renewable transportation fuels, resulted in lower revenue for the year.
For 2024, Montauk expects renewable natural gas revenue to be $195 million to $215 million, and expects RNG production volumes of 5.8 million to 6.1 million MMBtu, above this year's RNG production of 5.5 million MMBtu.
Technically, the big bear Elliott Wave pattern looks to be unfolding as a zig zag with the stock in wave 3 of (C).
I will maintain a bearish stance until the completion of wave 5 of (C).

Montauk Renewables - Bullish ConsolidationAfter moving upwards from around 130, MKR is now trading in a range between 168.50 and 190.00.
This looks like a bullish continuation pattern and should we see a breakout to the upside, potential targets are 220 and 230. Failure would be a close below 164.00.

Montauk Renewables IH&S Pattern.Montauk Renewables is Printing an Inverse Head & Shoulder Pattern as seen on this Graph.
The Chart shows the Trend Pattern.
I trust this Trend Pattern plays out for those Invested.
Any thoughts or comments are welcome.
Regards Graham.

MKR: rounding bottom pattern?A price action above 13300 supports a bullish trend direction.
Crossing above 14900 will act as further confirmation of the bullish trend direction.
The target price is set at 16200.
The stop-loss price is set at 12700.
It will appear that a rounding bottom pattern is starting to unfold.
Remains a risky trade.

Montauk Renewables - Looking for directionMKR has broken two areas of strong support. First it broke its uptrend - blue TL and then broke horizontal support at 141.40. Currently trading in a small range in 'no-mans land' looking for direction. Either we could see a move lower to around 93-95 or hopefully it reclaims support at 141.40.

$JSEMKR - Montauk Renewables: Consolidation Or Turnaround?Montauk had a good run since listing on the JSE in January 2021.
Since hitting an all time high at 36200, the share has lost almost 53% and could present good buying opportunity at current levels.
The technical structure is still unclear though there are early indications that the selling pressure is waning.
The MACD is moving strongly upwards towards the zero line and the share price action is forming a contracting triangle.
There is no clear signal yet but this is one to keep an eye on.

Can $MNTK continue to lead the Utilities sector?Notes:
* Recent IPO with steady up trend
* Not the best earnings in the recent quarters
* Basing for the past ~3 months
* While basing it bounced off of its IPO highs around the 13.8 area
* Recently breaking and holding above a pivot area between 16.65 and 16.9
* Daily and weekly volume seems to be indicating buyers coming in and the UD ratio seems to be indicating the same
Technicals:
Sector: Utilities - Utilities - Diversified
Relative Strength vs. Sector: 10.61
Relative Strength vs. SP500: 35.4
U/D Ratio: 0.96
Base Depth: 46.96%
Distance from breakout buy point: -15.4%
Volume 31.76% above its 15 day avg.
Trade Idea:
* You can enter now as the price is holding the 16.9 area as support
* If you're looking for a better entry you can wait to see if it retests the 16.9 area again.

MONTAUK RENEWABLESmontuk bull trend still intact a break of the range will push thee stock even higher

$MNTK #powerplayThere was lots of eyes on $MNTK the last few weeks and I was not interested (was not setup).
Its moving to my secondary watchlist for this week as the setup is progressing nicely so far.
Potential #PowerPlay
Watch for consolidation mid-rang to hold & breakout (Orange bars).

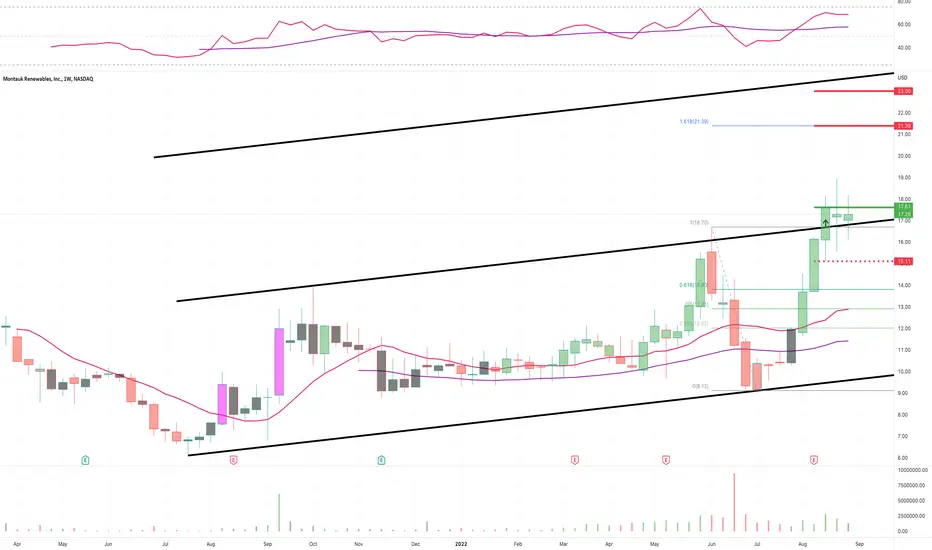
MNTK - Weekly Trade Idea for 9/5Montauk Renewables, Inc. {MNTK} is holding above its recent breakout trigger for the past several weeks.
I've identified 2 overhead targets for this trade idea. You could consider 1/2 & 1/2 to exit upon a test of.
OR you could sell 1/3, 1/3 and then leave the final 1/3 on if this continues to run.
That's ultimately up to you! Let me know if you find success in this setup!
$MNTK Energy is hot right now!$MNTK Montauk Renewables has seen some major upside recently. Yes we are late to the party but the lack of volume is off-putting. Today 9/15 there was a spike in volume on the final 30minutes. It was selling pressure after reaching a intraday high of 12.21
The daily chart shows clear defined levels we can play if the trend continues.
We are watching a break and hold past 12 and then a move to 13.50 (volume dependent)

$mntk BULL STRONG LONG pt is until 12,20$ $nasdaqabovr 21 and 10 MA after great news for my beloved stock!
lets go to 12$
great momentum

$mntk PT is 50$ Small free float
Ipo open price 13$
Looking for investors
Today from -5 +8%
Future Bio company innovative

PT is 50$IPO price is 8,50$ opening price is 13$
Small free float big vollatility ,lets go to be millioners all together!
Bio energy profitable sector with perspectives and the company looking for investors..
I bought today at 10.44$
I posted then to buy with me but the margin is ultra big there for unlti 50$ you can buy free!!
