MTN at 2008 support buy zoneMTN is trading at the support lows of 2008 at a price of R70-R72 , risk reward favours the upside imo.
MTN trade ideas


MTN - Time to fasten your seat-belt The bullish stochastics confirms this break above the R +/- 110 resistance level.
worth picking up a few ... get ready for the ride-> Target at R 120.00

MTN at strong resistanceJSE:MTN is currently at quite a strong resistance level and the expectation is that it will find resistance again. If it bounces off the resistance level, we will look to enter a short once it breaks through the fractal of 26th of July.
If it breaks through the resistance, we could possibly be looking at a potential long position.

MTN shortFalling in the top 5 most sold stocks by foreigners yesterday, MTN is also trading at a resistance zone at or near R110.00. I normally don't like trading these "zones" until I get confirmation but I have jumped in early this time. For this trade, I will use a break-out as my stop loss so a breach of overhead resistance will be my signal to exit the trade. The zone of R101.00/103.00 as support is where I aim to take profit.

JSE:MTN Markup ContinuesFollowing this accumulation range since November 2018 and the markup continues to play out with a series of stepping stone reaccumulation ranges.

Bearish divergence on MTNThe MTN share price has steadily improved since creating a low of R75.05 in February. The recent uptick has seen it touch a short-term high of R111.23. The upward momentum seems to be reducing however, and the stock has struggled to break above the R110.00 horizontal resistance.
This solid resistance could potentially form a turning point for MTN. Especially with the bullish run of the last few months running out of steam.
What interests me more though, is the bearish divergence on the MACD.
Have a look at the chart. MTN reached R106.47 in April and then R111.23 in June. In other words, the stock went higher, yet the MACD went lower. Now MTN is again near the high of June but the MACD is still going lower.
That is a classic bearish divergence and indicates we might see a change in trend from bullish to bearish. On top of that, the Slow Stochastic also shows MTN to be overbought at current levels. This is adding to the bearish sentiment.
Action: Place a Limit order to SELL at R110.00 or better with a Stop Loss set at R122.50. I will aim to take profit at R100.00 and R90.00 respectively.


MTN - Level to watchLooking at MTN, we may derive the following from the weekly chart:
1. Price is at a previous support level - now resistance.
2. It is important to watch this level and see how price reacts.
3. As always - maintain your risk management.
Let's see what happens.
Note: The views provided herein do not constitute financial advice.


Y'ello...look who's backMTN definitely back on the radar. After a few years of constant bad news, good news lately pushed the share price above its diagonal resistance line, which started in January 2018. Over the shorter term, the 14 day RSI are indicating that $JSEMTN are extremely overbought. Should the share price take a bit of a breather, a close below R92 would put the company back in the same downward trend. A breakthrough these levels could see MTN try and find support at its 200-day (R90.27) and 50-day (R88.95) averages.
It seems while NYSE:JMIA (MTN holds 29.7% of the company) is running 10% plus per day on average, support should remain favorable for MTN as well. The share price is also getting mighty close to a Golden Cross.
On the upside, next target on the company is R110, which places MTN on a forward PE (31 Dec 2020) of 14.5 times and a forward dividend yield of 5.52% (all according to Thomson Reuters).

JSE:MTN | #WeGotU... down to R71.00?OK, maybe I'm getting a bit ahead of myself.
However, let us consider the R108 level where price finds itself.
Price bounced off R108 in early 2016, late 2016 and mid-2017.
A year later, the bulls couldn't hold the level and down she tumbled.
Finally, more than 12 months later, we're back up against R108, now testing it from below.
And we don't know yet whether price will break through or not.
So how to trade this market?
A close below last weeks low would be good enough for me to look for the short...down to R71.00
Alternatively, a push higher and bounce off R108, turning resistance into support sets the bullish case.

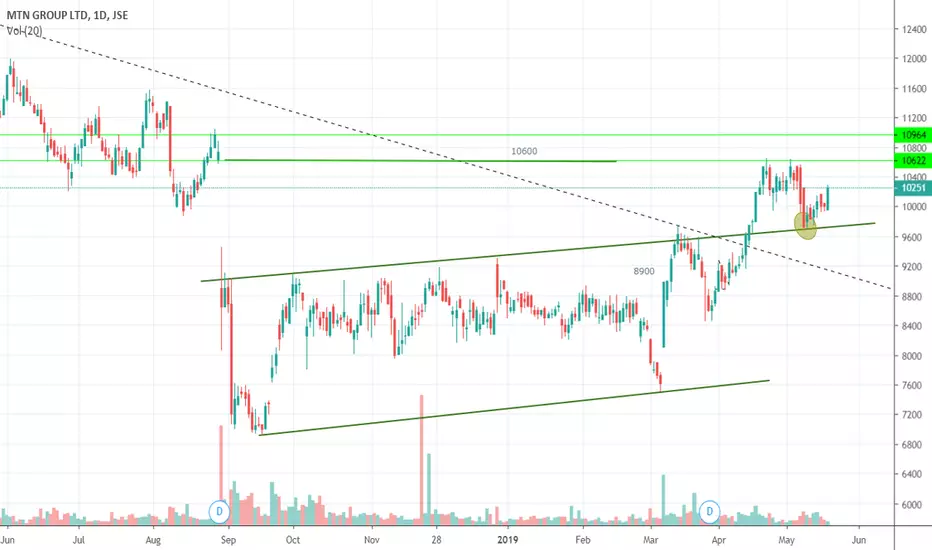
$JSE-MTNJSE:MTN
Currently pulling back to back test resistance now support around 10600 area.
Target still around 11800.
Clearly defined up channel made and will probably respect it for days to come.


$JSEMTN - Looking bullish. Could pause short term. MTN has successfully re-tested breakout and has also broken out from a small bull flag.


$JSE-MTNJSE:MTN
Trying to break 10600 level after consolidating in range for few weeks.
Break above 10600 will open target around 11600.

$JSEMTN Bull flag forming. Bull flag forming on MTN. A break could target 11500. Wait for the break.

MTN Symmetrical Triangle BreakoutJSE:MTN has broken out of a symmetrical triangle and is looking good for a short position. Personally, I would wait for a confirmation by it breaking through the fractal on the 13th of May before entering a short position.

MTN Just a gap fillMTN looks strong with a nice W bottom here
I would be a buyer in the green feels like someone is front running here time will tell
For now on shorter TFs this looks good

$JSEMTN has turned technically bullish on the dailyI don't want to use this chart to give targets but merely as an illustration of what a very strong technical chart looks like. Firstly as can be seen by the price action we have seen successive higher lows and higher highs on MTN which is very much a characteristic of bullish chart. Adding to that, we have also seen all the major moving averages cross upward and above the 200 day moving average. This chart has all the characteristics in place for further upside to present itself. I would be a buyer on any dips in the MTN share price. If the stock closes below the previous high/low level of R97.00 that would be my stop loss.

$JSEMTN Channel break, break retest and moving higherAfter a channel break and a retest of this channel, this one could make another run for 10600 and 10950