Ninety One - Observation - #JSEN91The weekly chart is looking solid for this stock and we could see R43.50 in a relatively short time.
The RSI is crossing 0.5 and Macd has crossed over. Decent volume pickup in last few weeks.
The daily chart shows a bullish close on the high yesterday. Longs can be initiated with any pull backs while R39.50-R40.00 is intact.
N91 trade ideas

N91: building a base on its 200-day?A surge in price beyond 3900 serves as a signal of an impending bullish trend.
Further support for this bullish trajectory comes if the price vaults above the 4100 marker.
A target price has been determined at 4300, which aligns with the 78.6% Fibonacci retracement level.
A stop-loss has been carefully positioned at 3900 to curb potential losses.
In addition, a climbing Coppock curve substantiates the positive trend forecast.

N91 Moving Towards Weekly Low PriceN91 has begun to put in lower highs and lower lows signaling that it is moving into a weekly low price point. The previous low weekly price is R34.58, we will watch to see if this breaks, however of most important is how price interacts with the median line of the Pitchfork, if we lose that support we can watch for a targeting of the pink support line or the 0.5 line of the Pitchfork. The swing low from that point on a weekly would confirm entry long, more risk accepting investors would enter on a daily swing low price point.
Turning bullish without breaking R34.58 means 17 October 2022 was the yearly low price. This idea would be updated as the cycle unfolds.

N91: some range trading?A price action above 4000 supports a bullish trend direction.
Further bullish confirmation for a break above 4100.
The target price is set at 4300, which is the upper range of the declining channel pattern.
The stop-loss price is set at 3800.
Remains close to its 200-day simple moving average, supporting some stability in the price action.
Remains a risky trade.

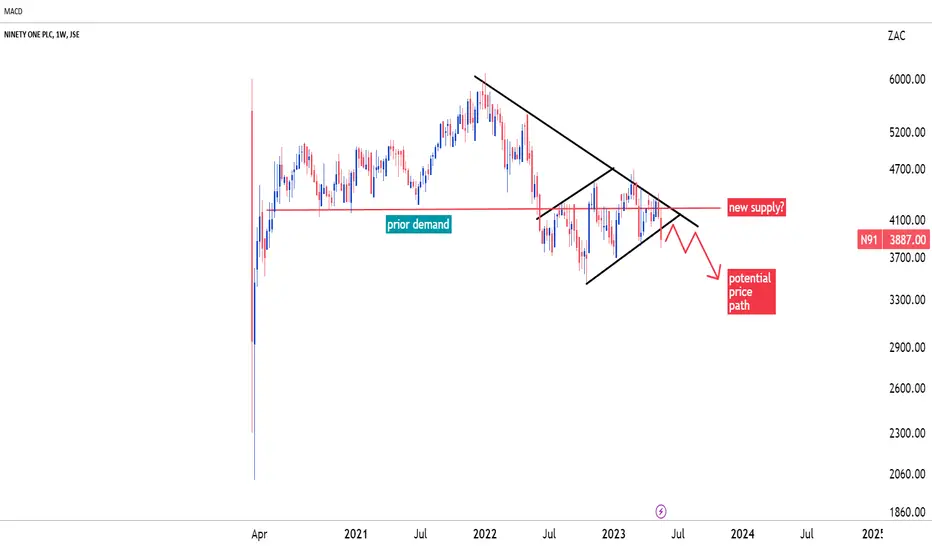
N91Support potentially turning to resistance with a bear flag structure on the weekly chart. Strong likelihood of lower levels over the medium term.
For more research insights, including trade ideas, get in touch today.
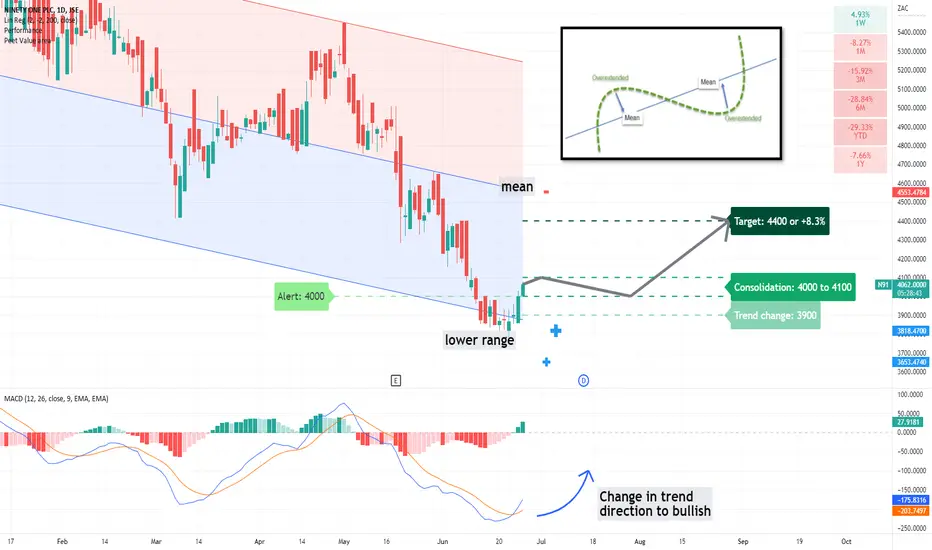
N91: mean reversion tradeA high likelihood of a mean reversion trade might be unfolding.
The price action is regarded as oversold.
A price action above 3900 supports a bullish trend direction.
Crossing below this level will negate the positive stance.
Further bullish trend confirmation for a price action above 4000.
Consolidation from 4000 to 4100. Crossing above 4100 might target 4400.
Crossing below 4000 will be the first sign of weakness.
MACD (lower panel) also confirmed a change in trend direction to bullish with the crossover.
Remains a risky trade as it is a countertrend trade.
N91Ninety One Plc
Bullish divergence (7-DAY RSI) with deep back-test of prior trend line breakout. Last two days candle structure improving. Down from +6000c (peak) to 4371c (last close) YTD.
Check fundamental valuation too (Price/AUM etc)
Interested in a buy/long on medium term basis.

Long idea on N91Price is moving nicely within these rectangles/boxes. Price has just broken out this rectangle setup and this is a good level for a buy.Be wary of the 5500 level as resistance. LT trend is up. Always manage your risk.

Long idea on N91Price has been range bound for a long period of time and has found support at 4600 and resistance at 5000. Price needs to close above 5100 and a breakout above this level can be bought with a limit of 5751. Price can always move way higher than the limit so manage your trade using your own risk management strategy.

N91 - 1D - GOING NOWHEREThis instrument is moving sideways and not doing much. I Will only give it some attention once it breaks out of that upper band and turns it into a support. For a short term trader you can make some profit with some swing trading if you feel the urge.


N91This chart forms part of a larger research note. None of the information posted here (TV) should be considered financial advice.
In the short term, the 4526c – 4582c range are key levels for the share. The chart structure has developed a rising wedge-like formation while the RSI has made lower highs, signaling bearish divergence. A break below the incline support trend line puts the share at risk of a break lower. The 4312c level is one to watch, followed by 4130c and 3952c. Should we see strong support here, then we may have another breakdown and back-test opportunity.
