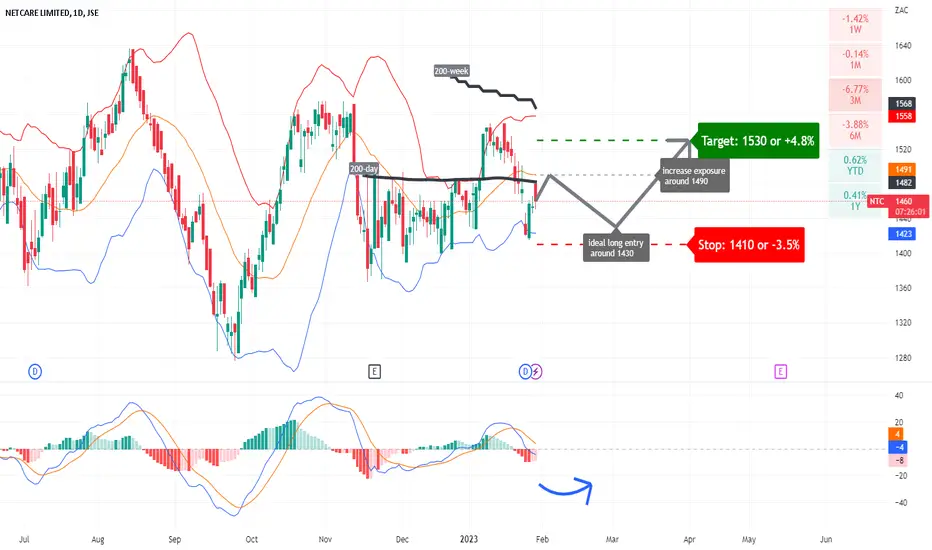
NTC: testing its 200-dayA bullish trend is applicable and the ideal entry range is around 1430.
Increase exposure for a break above 1490.
Target is set at 1530.
Stop-loss is set at 1410.
Fading downside price momentum supports the bullish trend.
Time exit +/- 20 February 2023.
NTC trade ideas

$JSENTC - Netcare: What Goes Down, Must Come UpThe hospital sector has found the going tough over the last 7 years.
Even covid did not bring much in terms of good fortunate as in other sectors.
Fundamentals are always critical but technical and cyclical analysis paints a bullish picture for the stock.
The decline from the 2015 all time high has unfolded in a textbook (A)(B)(C) zigzag pattern with both the (A) and (C) waves being complex impulses.
The critical level to hold is R11,30 and should be the stop-loss level used for long positions opened at current levels.

Netcare looking healthy right nowNetcare showing a bull market as it broke above the medium term downtrend since August - September... It's now testing the support (which was the resistance) and is forming a potential Cup and Handle which is setting its next target to R15.16.

NTCPublished in the last few minutes to our client platform.
"Speculative trading opportunity with the price trading at the bottom it's year-to-date range while also testing the lower boundary of it's 40-day Bollinger Band. The 7 and 14-day RSI is at 10 and 26 respectively (extremely oversold in the ultra short term). Preferred at current levels or slightly lower. Expecting support around current levels with base to potentially develop, before a short term reversal."
TRADING LEVELS:
Entry: 1408c
Target: 1496c
Stop-loss: 1364c
For more research, including trade ideas, get in touch today.

NetcareNetcare building a good base on the weekly; looks like a Cup & handle chart pattern. 17ish is the area to break to confirm it!

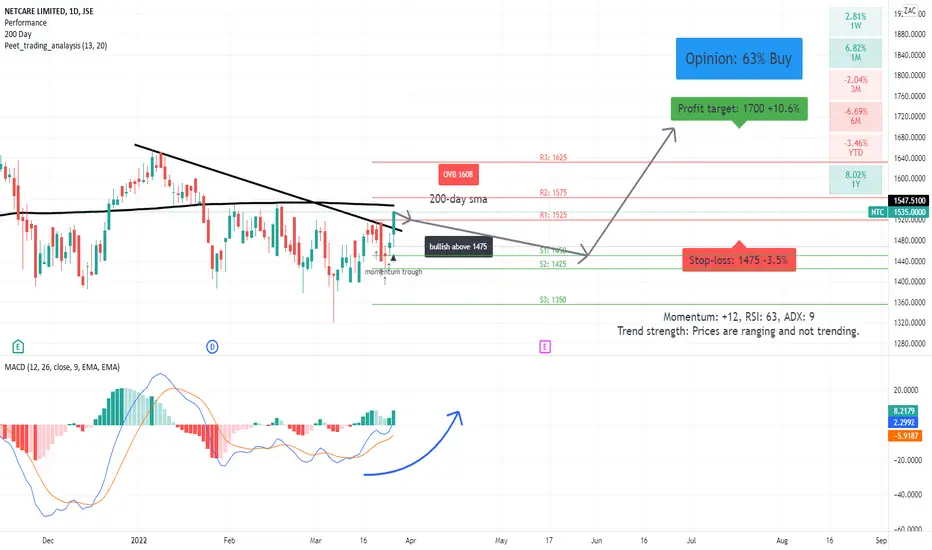
NTC - breaking above key resistanceA bullish price action is applicable above 1475.
Crossing below this level will negate the trade idea.
Upward price momentum supports the bullish trend direction.
RSI leaves enough room for further upside price potential.
Breaking above its 200-day will act as further upside potential.
Pairs Trade Idea: Buy NTC/Sell LHCTime Frame: Ultra short Term - looking for a reversion to the mean.
- Has retraced more than 0.618% of it's recent upward move, from upper boundary of Bollinger Band to below the mean.
- 5-day performance gap has widened, with NTC underperforming LHC (-6.98% vs 0.13%).
- The 5-day correlation is negative vs a 0.69% correlation over 21 days and a 70% correlation over 250 days.
- 7-day RSI at 17, suggesting the price in oversold territory.
Suggested Levels:
- Entry Range: 0.06385 to 0.6416
- Stop: 0.6330
- Target: 0.6700
- Current Ratio: 0.6407
A successful pair trade can be realized 1 of 3 ways:
The long position rises while the short position falls
The long position rises faster than the short position rises
The short position falls faster than the long position falls.
For more real-time insights and trade ideas, or if you're considering at alternative trading services provider, get in touch today.


$NTC Netcare Nice break and retestNetcare broke what seemed like an inverted head and shoulders neckline and retested that neckline. Possible target after 1700 would be 1970.

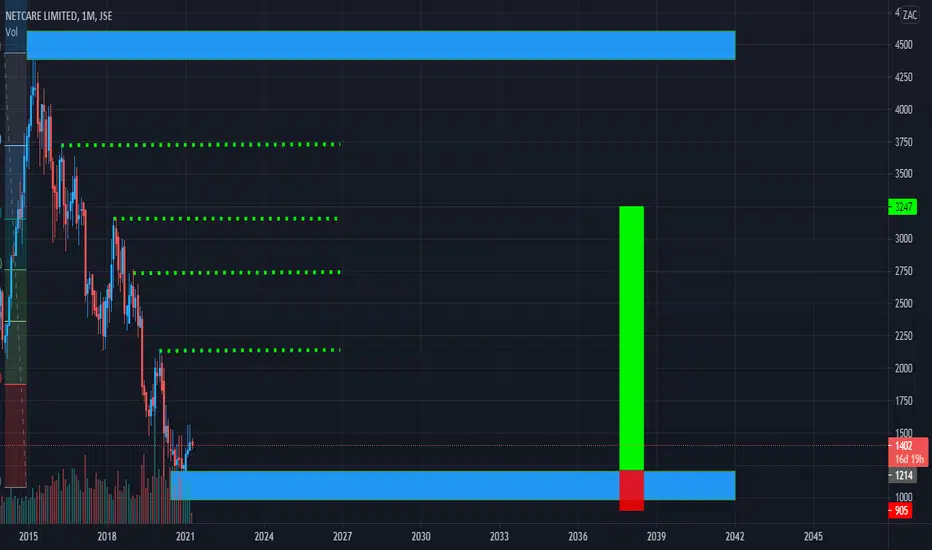
Netcare LtdNTC Monthly Chart
From an equity portfolio perspective, South African hospital stocks have been out of favour for an extended period however short and medium term opportunities have arisen in both Q1 and Q2, with both Life Healthcare and related-sector stock, Aspen Pharmacare as flagged as buy/longs during the period. Reviewing the monthly chart of Netcare Ltd, we note the price having found multi-month support from March 2020 to January 2021 at the prior demand zone (Aug 2011 to February 2012). Further motivation for a possible long term change of trend is the price emerging from the downward channel (trend line extending back to May 2018) while also attempting to trade above the long term demand/supply zone. We also note that despite being below the zero bound, the MACD has developed a crossover while the monthly RSI is just above the 50 level and pointing high. The potential long term trend change is early but possibly worth noting from an equity portfolio perspective.
This comment was originally published on our client platform earlier today.
Also published this morning via our client platform: Technical views on Sasol, Absa, S&P 500 Futures and FTSE 100 Index
For more real-time insights and ideas, get in touch today.

NTC - Ascending TriangleAscending triangle in the making. A close above R15.50 triggers the long idea with full target of R17.50 and stop loss a close below R14.25


$JSENTC Netcare. Potential head and shouldersNetcare seems to be building a potential head and shoulders formation. Watch the 1560 neckline for resistance. A break of that neckline could open 1700 and 1970 targets.
Wait for a neckline break. Stop loss around the 1400 level.


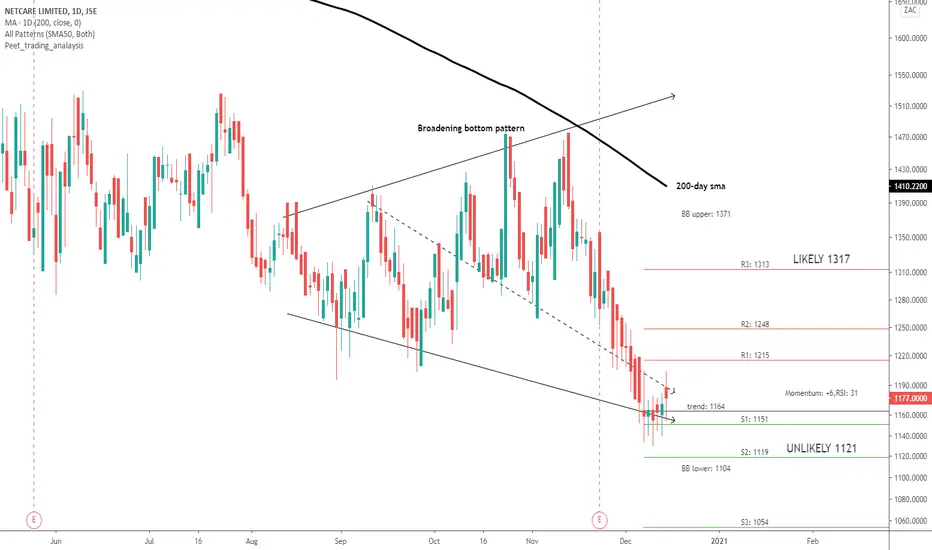
$JSENTC Pushing 200dma.Watching JSENTC when it dropped below channel, punt to buy at deemed lowest point paid off. Subsequent Buy entry points indicated, now waiting for 200DMA push through up to next target 15.00.

JSE:NTC LONG TERM TRENDJSE:NTC has been on a downtrend since march 2015 after reaching a high of 4438
Trade Idea: Short term- Long if price breaks above 1380
Long Term - Short if price breaks below 1700 with Target of 700.

NTC 1D - UPSIDE POTTENTIALGrammaphone formation risky, however it is within a downward channel. I can see upside to the 200 day MA. It is a long term punt, there profits have dropped due to low occupation rate of beds. COVID ALSO WILL PASS. Mediclinic in pretty much the same boat, the difference being that NTC are now going to start focusing on day clinics.