NTC trade ideas

NETCARE - Resistance - After a decent move up, price is clearly finding resistance at the 200ma
- Bulls attempted 3 times but have so far failed (although volume is low)
- Will look to enter on any attempt to move up and target the retracement levels

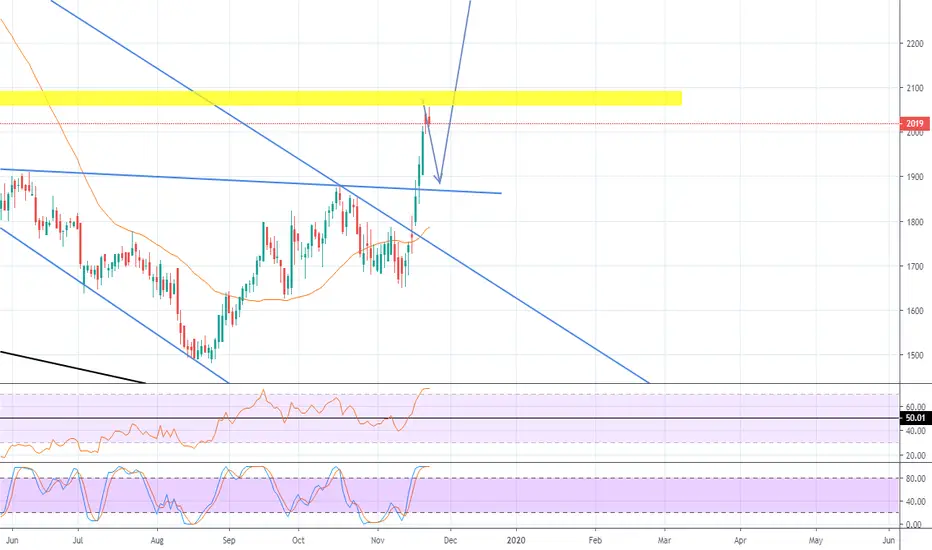
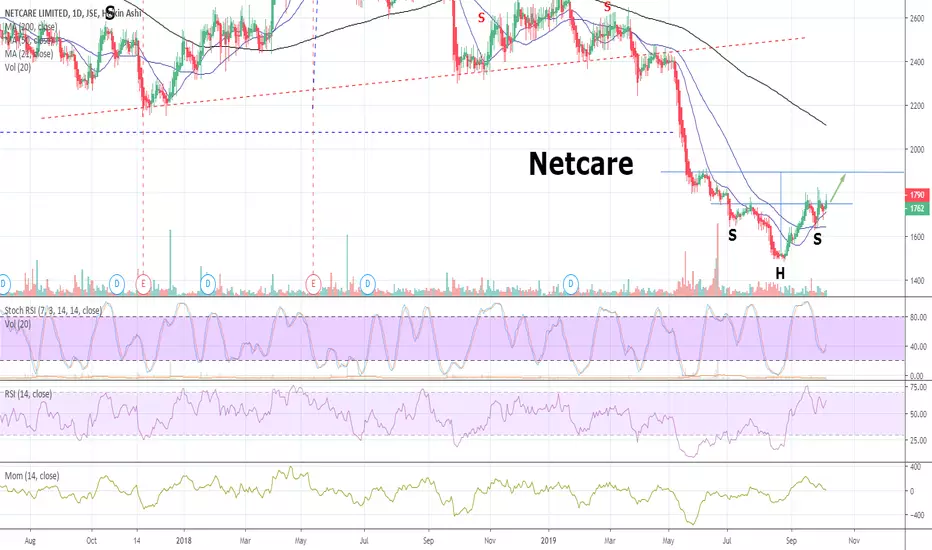
$JSENTC completing a reverse Head & shoulders formationConsidering Netcare's price action holds up today and closes above the neckline level at 18.65, we are witnessing the completion of an inverse or reverse Head & Shoulders formation. Results released yesterday have been received well by the market, which should ease investors concerns for the time being.
These patterns are reversal patterns that form at the end of an extended downtrend and confirm once prices breaks above the neckline. What i really like about this setup is the expansion of volume that we have seen from the advancement of the right shoulder and during the break above the neckline. This is crucial to confirm the validity of the formation. Should all go to plan, this pattern has a target of R22.34
Entry : buy the break above neckline @ 18.65
Stop loss: Close below right shoulder @ 16.71
Target: R22.34


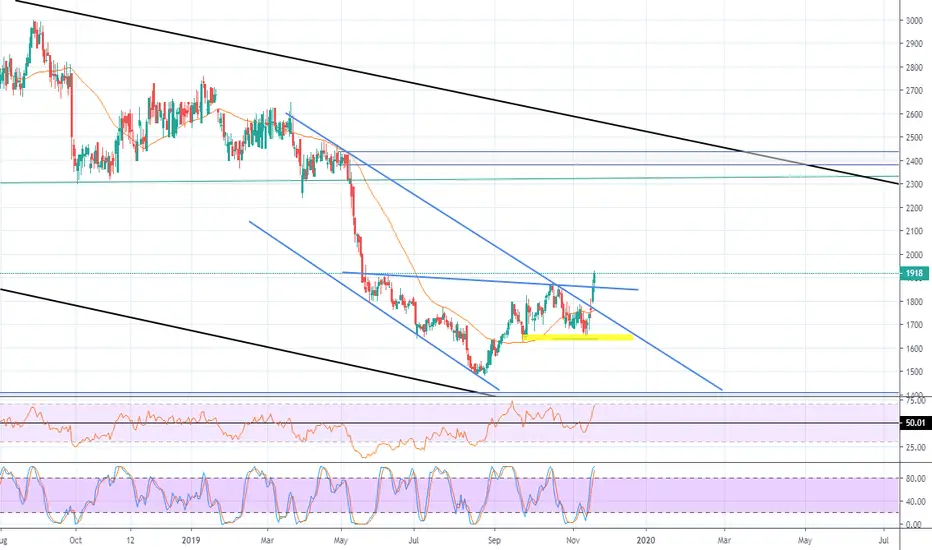
NTC - Inverted HS pattern neckline retest.NTC Daily cahrt- Inverted HS pattern neckline retesting for the last few day, if it hold can move higher to see targets.
Risk / Reward - 1 : 2.25

Netcare reversalUsually a good indication of a reversal at the bottom of a trend is the inverse head and shoulders pattern. I'm looking to buy IF the price pulls back to 17.50 (or very close). I am going a little more aggressive on this one and risking 3% of my portfolio should my SMART strategy clients get entry. I'll be targeting R18.95 with a stop loss at 16.75. robp@unum.co.za
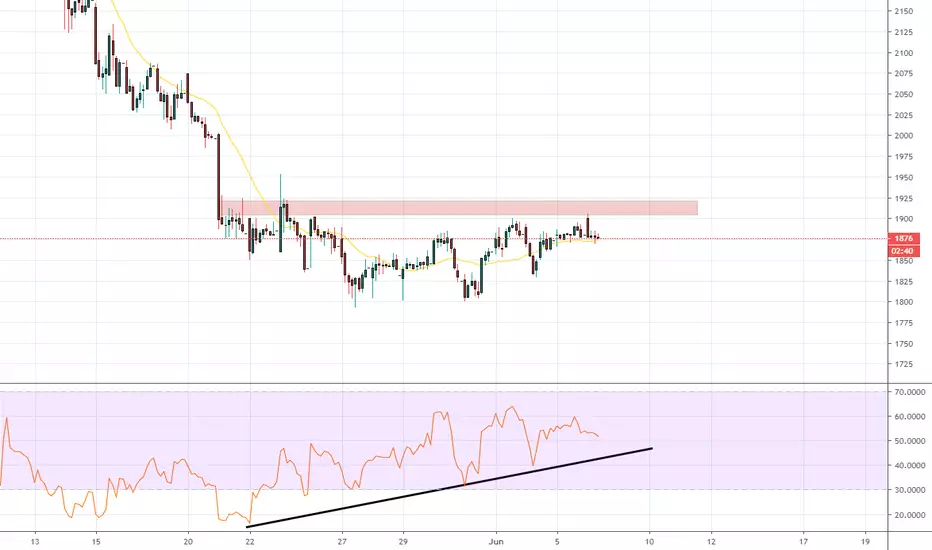
Netcare Ltd - Short Term Trade Idea Netcare Ltd (NTC) is signaling potential for a short term recovery. Yesterday we saw the price test it's downward trend line resistance while the RSI gave an early signal, having broken resistance going back to March. At current levels or better (R15.73) I see an opportunity to take a buy/long, using a stop-loss of R14.95 and Take Profit Target of R16.90.

NTC - A bit lower firstWe may derive the following from the Monthly NTC chart:
1. Price is still in a massive downtrend.
2. Price i.m.o should respect the monthly channel support.
3. I would wait for around ZAR 15 p/s before considering any buys.
4. NB: The trend is still down - so be cautious in buying.
5. As always - maintain your risk.
Note: The views provided herein do not constitute financial advice.

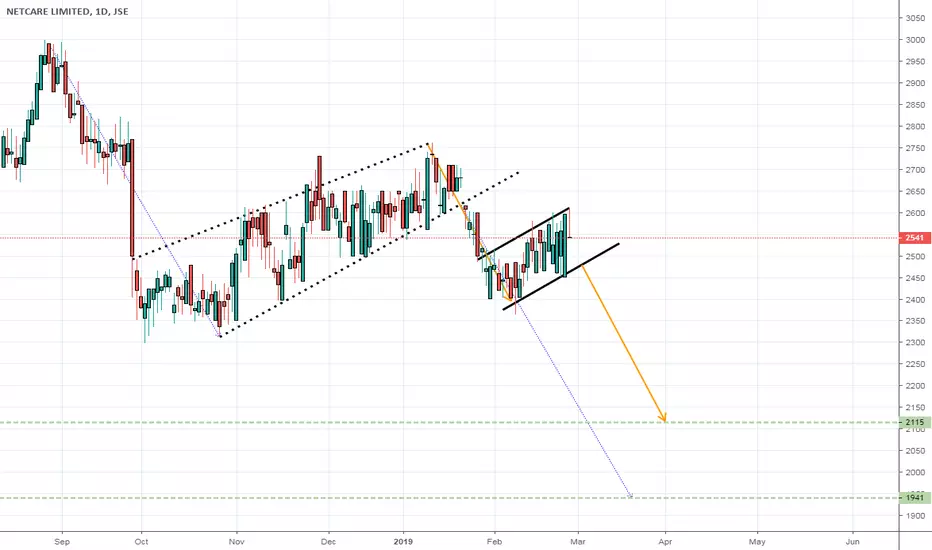
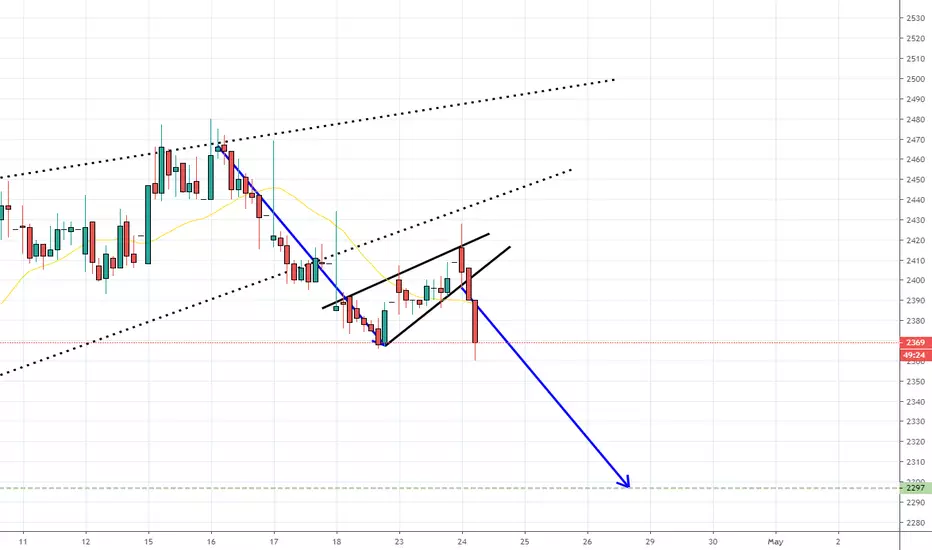
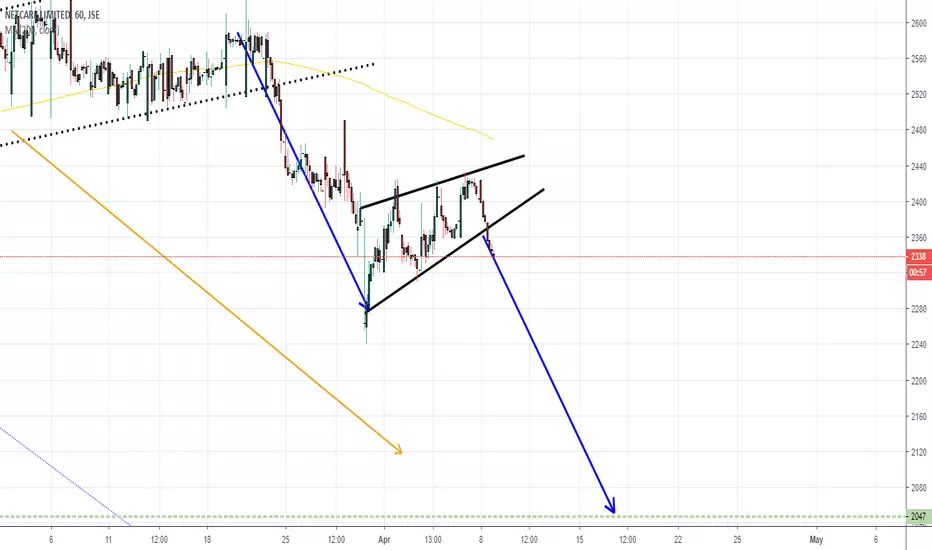
NTC 6 RRR shortTrading Methodology:
1. An asymmetric bullish/bearish pennant is drawn using ascending and descending curved trend lines with a minimum of three price action touche points per line. The direction is determined by the previous trend.
2. The angle tool is applied from the earliest two trend touch points, beginning at the earliest touch point.
3. A trend-based Fibonacci retracement triangle is drawn starting from the earliest trend touch point and ending at the earliest touch point of the opposite trend line .
4. Based on the degree, of the earlier defined angle, the appropriate (and secret) levels are selected for the fibonacci retracement ; two levels for stop-loss and two levels for take-profit. The closest stop-loss level to the current price level is the top priority stop-loss. Though the secondary stop-loss level is often chosen for some markets such as FX and some equities in order to account for seldom unexpected resistance breaks. The greater target level is the top priority, and where majority of the shares are sold, though some may choose to close part of the position at the first target level or set it to be the stop-loss once price exceeds it. Entries should be laddered in around the levels closest of the yellow line.
This trading strategy can be applied to any market and time frame, and positions most often garner the greatest risk-to-reward ratio with the highest success rate. What more can you ask for? I will only be posting my unique trading strategy until EOY. I work solely with price action to identify pennants and apply unique trend-based fibonacci retracement levels for SL and TP levels. Reach out to me if you have any questions.

JSE:NTC Netcare High Volume RedistributionNetcare has shown high volume during a small redistribution trading range. Some buying has taken place but supply has overcome the demand. There is still supply but no demand indicated by the low volume. Price is continuing to be marked down.

Help is on the way - Netcare Limited - NTCZoom out a little and you will find support. Let's hope this support is as strong as it looks. ;-)

$JSENTC Netcare 911, we have an emergency!This chart looks like an emergency that requires an urgent intervention! Perhaps the major volume seen today could be an indication of capitulation and i will be monitoring the price action in the days ahead to see if it is able to recover from these over extended levels. Should this level hold which is also coincidentally the bottom of the downward sloping channel, we could see a bounce take place to the R21.00 - R21.60 area. R21.60 is an area where the chart also has a small gap which might want to fill first before any further downside ensues.


Double Head and shoulders- NETCAREI have spotted a Head and shoulders inside a head and shoulders on the stock. The price has bounced to test the common neckline so I have used this bounce to get SHORT. RSI and Stochastic RSI are still weak so I don't expect the bounce to carry. I'm looking for a move to below R22.00

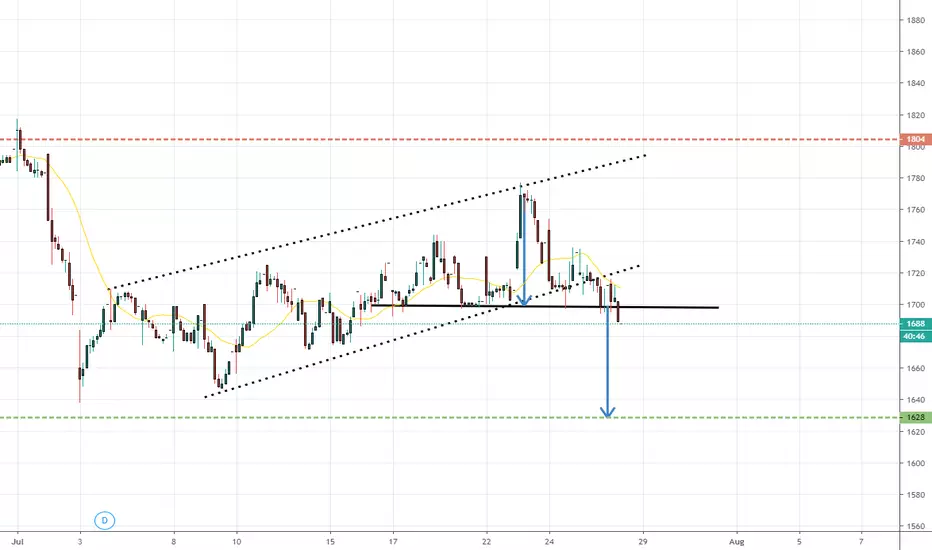
Building up for next leg lower?Another bear flag in the making. Still holding previous short position